

This educational strategy is designed for traders who want a repeatable decision process. It defines location, confirmation and invalidation before entry; it does not claim a fixed win rate or return.
How the strategy works
The setup combines Horizontal zones, swing highs/lows and optional ATR. Its advantage is selectivity: a signal counts only when price context and confirmation agree. The strategy is best treated as a checklist to test, journal and adapt to a specific broker—not as an automatic promise.
Draw zone boundaries from completed reactions visible before the signal; do not move them to fit the later turn. Repeated tests are a warning when rejection weakens or price spends more time through the zone, not proof that a fixed touch count causes a break. Location quality and acceptance matter together.
Indicators, markets and timeframe
Horizontal zones, swing highs/lows and optional ATR.
Any liquid pair with visible repeated reactions.
H1 and H4 for zone quality; daily for directional context.
Timeframes are starting points, not guarantees. Lower timeframes produce more signals and more noise, spread impact and execution sensitivity. Confirm the higher-timeframe structure before taking a lower-timeframe trigger.
Entry rules
BUY checklist
- Mark a support zone from multiple reactions and candle bodies/wicks, not a one-pixel line.
- Price enters the zone and fails to close decisively below it.
- A bullish rejection, engulfing close or higher low provides the entry trigger.
SELL checklist
- Mark a resistance zone supported by multiple market reactions.
- Price probes the zone but acceptance above it fails.
- A bearish rejection, engulfing close or lower high confirms sellers have regained control.
Wait for the confirming candle to close. If the entry has moved so far that the planned stop no longer offers acceptable reward relative to risk, let the trade go.
The baseline requires a completed rejection or engulfing close at the predefined zone, followed by the next executable quote. The far edge and swing define invalidation. An analytical candle-close filter does not suspend a protective price stop: a live SL can trigger intrabar. A breakout-and-retest through the zone is a different method, not an automatic rescue trade.
Stop Loss and Take Profit
Stop Loss
Beyond the far edge of the zone and rejection swing. A close through the zone is often more meaningful than an intrabar touch.
Take Profit
Nearest opposing zone first. Only hold for a larger target when higher-timeframe structure and available reward justify it.
Calculate size only after defining the stop. Do not widen a stop after entry merely to avoid realizing a loss.
Risk management
Set a fixed account-risk ceiling per trade and reduce size when stop distance grows. Count correlated positions together. Predefine maximum daily and total drawdown, and stop trading when execution or market conditions differ materially from the tested plan.
Position size follows the stop: divide the planned cash-risk budget by the estimated loss per lot in the account currency at that stop, including costs. Round down to the broker’s volume step; if even the minimum lot exceeds the budget, skip. Here 1R is the initial entry-to-stop price distance; costs reduce the gross reward multiple.
Example trade walkthrough
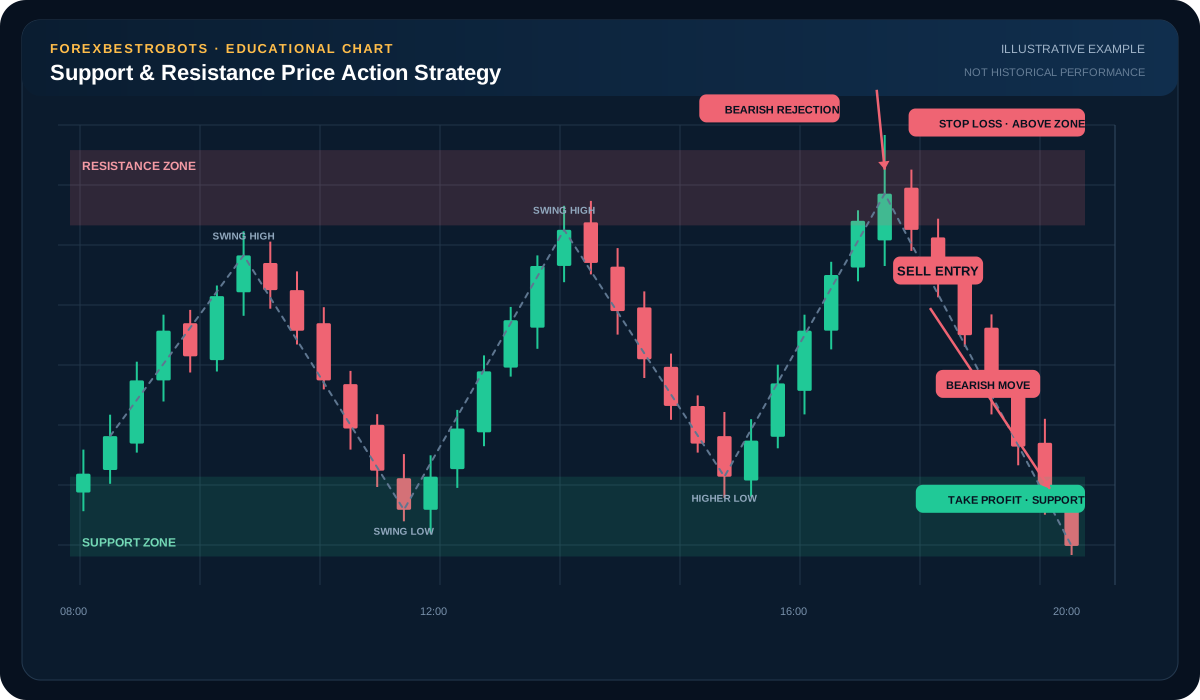
The schematic illustrates a resistance test followed by bearish rejection. A short candidate is evaluated after the confirmation close, with SL above the zone and rejected high; the nearest support supplies the first target.
Calculate reward from the actual SELL quote rather than the candle's earlier high. The downward candles show an invented teaching path. If the zone is reclaimed and the SL price is reached, exit according to the protective order rather than waiting for another candle merely because close-based analysis looked stronger.
When to avoid this setup
Repeated zone tests with weakening rejection or increasing acceptance beyond the boundary, levels formed during illiquid spikes, and entries in the middle of a range with no location advantage.
How to test it responsibly
- Write the rules in a checklist before looking at results.
- Mark historical examples without changing rules after each loss.
- Include spread, commission and missed fills.
- Separate development and out-of-sample periods.
- Forward-test on demo and record every valid signal, including skipped trades.
Freeze each zone before its first eligible signal. Compare modest changes in zone width and confirmation type as separate tests, including areas that failed rather than only visible turning points. Record spread, both intrabar SL/TP possibilities and correlated exposures; hand-picked clean reactions cannot establish a performance record.
No win rate, monthly return or “best strategy” claim is made. Results depend on market, costs, execution and rule discipline.