

Aroon measures how recently a rolling high or low occurred. It does not measure the size of the price move. A reading of 100 can come from matching an earlier extreme, while a crossover can arise when an old extreme leaves the window. Real EUR/USD candles make these differences visible.
1. What Aroon actually measures
Aroon-Up tracks the age of the highest high; Aroon-Down tracks the age of the lowest low. A recent high puts Up near 100. An old low puts Down near zero. The two lines describe the timing of extremes, not the distance between them or a probability of making money.
The Aroon oscillator is Up minus Down and ranges from −100 to +100. A positive oscillator means the selected high is more recent than the selected low. It does not say that the latest candle was bullish. The high and low of the same wide candle can both be the newest extremes, producing Up = Down = 100 and an oscillator of zero.
2. A precise 25-period calculation
Here N = 25 means the current completed candle plus the previous 25 candles: 26 observations, with ages from 0 to 25. Select the highest high and lowest low in that window. For equal prices, select the most recent occurrence. This convention matches the referenced TA-Lib implementation; a platform using 25 observations instead can produce different values.
Aroon-Up = 100 × (N − age of high) / N. Aroon-Down = 100 × (N − age of low) / N. With N = 25, each additional candle of age changes the reading by 4 points. Possible values include 48 and 52, but not exactly 50. Do not interpolate ages to create a smoother-looking line.
A value of 100 means the current high or low equals the selected extreme under this tie rule. A value of zero means that extreme is 25 candles old. When it leaves the next window, the indicator can jump to the next eligible extreme without a new price breakout.
Aroon-Up = 100 × (N − kH) / N
Aroon-Down = 100 × (N − kL) / N
Aroon Osc. = Aroon-Up − Aroon-Down
kH: High age, in bars; kL: Low age, in bars.
3. A real candle: Up = 100, but no higher high
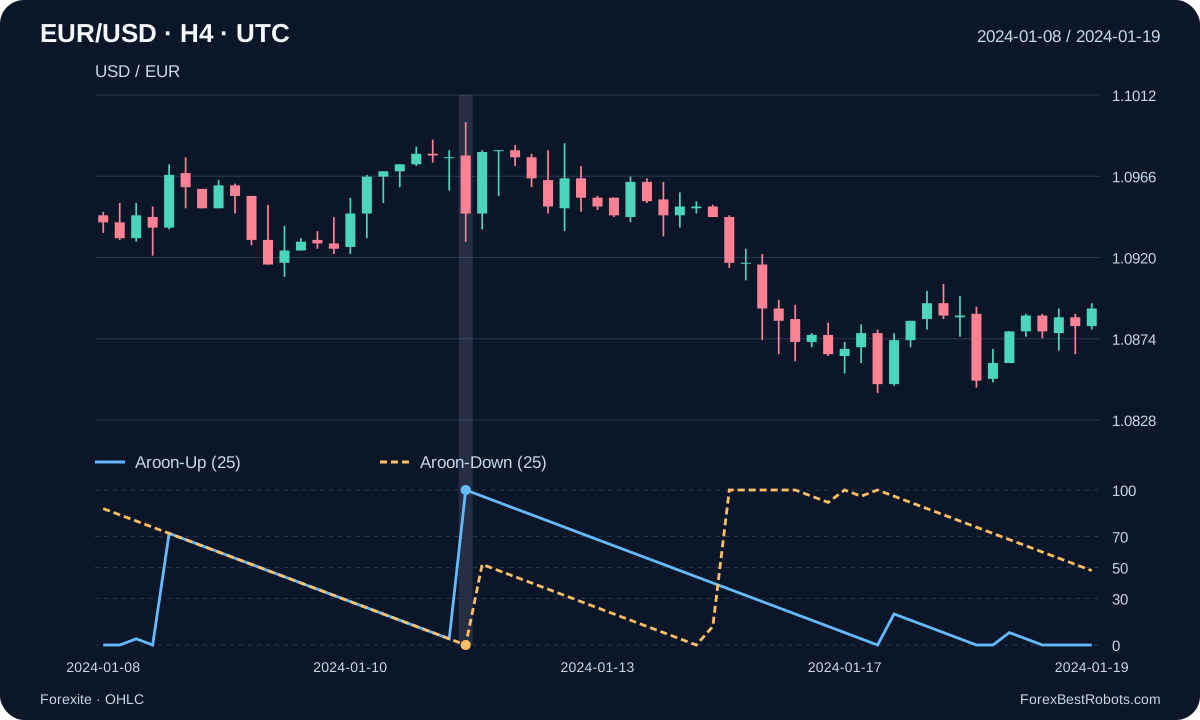
For the EUR/USD H4 group ending 2024-01-11 at 16:00 UTC, the archive gives O = 1.0978, H = 1.0997, L = 1.0929 and C = 1.0945. The highest high in the 26-candle window was also 1.0997 on the group ending 2024-01-05 at 16:00 UTC. The latest tie wins, so the high has age 0 and Up = 100.
The selected low, 1.0876, remains on that older candle, 25 bars back. Down = 0 and the oscillator = +100. Nevertheless, the current candle closes below its opening price. Neither an oscillator of +100 nor Up = 100 proves an upward close or a break above the previous high. These are historical observations, not a trade recommendation.
4. Read persistence, crossovers and price together
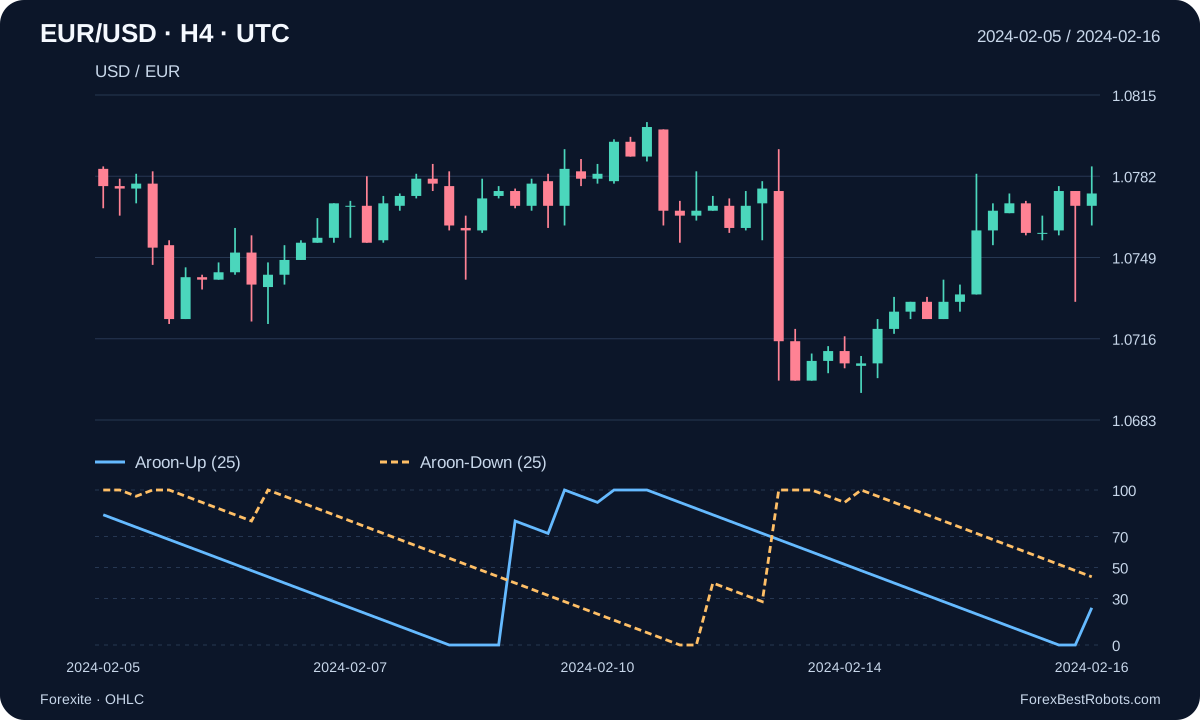
Repeatedly high Up readings with low Down readings show that highs have been refreshed more recently than lows. The opposite arrangement describes more recent lows. Levels such as 70/30 can be descriptive reference lines, but they are not validated entry thresholds for this pair.
In a range, the lines can alternate as price revisits its edges. A cross changes the ordering of the selected extremes; it does not establish that price has escaped the range. If both lines decline together, neither extreme has been refreshed, but price can still move within the old boundaries. Check the actual highs, lows and closes before assigning a trend label.
A fresh upward cross can be defined as Up[t] > Down[t] and Up[t−1] ≤ Down[t−1], using two completed, valid readings. A line already above the other is a continuing state, not another fresh cross. Freeze the window at decision time instead of redrawing it using later candles.
5. Why 14, 25 and 50 look different
A shorter lookback forgets an older extreme sooner; a longer one can keep it relevant after the short window has discarded it. This changes timing and can change which line is higher. It does not make either setting universally better. Compare 14, 25 and 50 on the same completed candles in the example below.
Twenty-five H4 bars are not always 100 elapsed hours: market closures interrupt the sequence. Changing the feed, time zone or H4 grouping can also change the selected extremes. Our charts retain observed groups, including shorter opening and closing sessions; no weekend candles or missing prices are invented.
6. Inspect the actual calculation
Choose a completed H4 group and a lookback. The chart shows only its calculation window, ending at the selected group. The prices stay unchanged when N changes. All available rows can also be downloaded as CSV.
- Completed group ending (UTC)
- —
- Open
- —
- Close
- —
- High
- —
- Low
- —
- High age, in bars
- —
- Low age, in bars
- —
- Aroon-Up
- —
- Aroon-Down
- —
- Oscillator
- —
- Source minute records in this group
- —
- Window
- —
- Selected high: group end UTC
- —
- Selected low: group end UTC
- —
Calculation
These are quote observations. No order fills or trading returns are simulated.
7. Check your platform before comparing signals
Match the instrument, feed, timeframe and price precision. Then check whether the implementation uses N or N + 1 observations, includes the current forming candle, selects the newest tied extreme and labels time by the start or end of a candle. A matching setting of 25 is not enough to establish matching calculations.
A value on a forming candle can change before completion. Record the last completed candle and its two line values. If an indicator redraws earlier signals after later data arrives, investigate its indexing before using it for testing. Aroon uses the declared window of rolling extremes. It needs no observations before that window and no smoothing seed.
8. From a chart reading to a testable strategy
Aroon supplies neither a stop distance nor an executable entry price. A full strategy still needs a precise trigger, entry timing, invalidation, exits, position sizing and a rule for overlapping positions. Fix these before evaluating results on a separate period.
The supplied quote candles contain no Ask series, spread, commission or slippage. They cannot establish net profitability or prove that a stop filled at its drawn level. An intrabar high and low do not reveal which came first. For execution research, obtain suitable Bid/Ask data and document ambiguous paths, gaps and trading costs.
Frequently asked questions
Does Aroon-Up at 100 mean buy?
No. It identifies a current high or a tied high under the stated rule. It does not specify an entry, future direction or risk.
Can both lines be at 100?
Yes. One candle can contain both the highest high and lowest low of the window. Under the newest-tie rule, an entirely flat window also produces two readings of 100.
Why does my broker chart differ?
Compare the feed, precision, candle boundaries, window length and tie handling. These charts use a declared grouping of Forexite records rather than your broker’s native H4 candles.
Is this a backtest?
No. It is a calculation guide with historical price examples. No trades, win rate or net performance are claimed.
Data, timing and reproducibility
Source: Forexite’s public daily MetaStock archives for January–February 2024. Their timestamps use CET in winter, so we subtract one hour to obtain UTC. We group the published minute-record timestamps into intervals (end − 4 hours, end], with ends at 00:00, 04:00, 08:00, 12:00, 16:00 and 20:00 UTC. Chart times denote group ends. This explicit record-time grouping may differ from a broker’s candle convention.
Each group uses the first observed open, maximum high, minimum low and last observed close. No prices are filled or interpolated. The last group cut by the downloaded interval is excluded; shorter market-opening and market-closing groups are retained. The CSV records their minute counts. The provider’s four-decimal quotes are retained as published; no Ask or spread is inferred.
The data file contains 266 H4 groups and 241 valid Aroon(25) readings. The download includes the used minute records, source URLs, original-archive SHA-256 hashes and calculation code. Dates and windows were selected for illustration; they are not independent evidence of a profitable trading edge.