

A stop defines an intended exit condition, not a guaranteed maximum loss. A target defines an intended profit-taking condition, not the chance of reaching it. This guide connects both levels to executable prices, position size and a cost-adjusted payoff. Every price, fee and outcome below is a fictional teaching assumption.
1. Choose the invalidation rule before the trade size
Start with the condition that invalidates the trade idea: a stated structural level, volatility distance or fixed rule. Specify whether the exit is an accepted server Stop Loss or an EA instruction after a completed candle. A close-based exit can permit substantial movement beyond the level before it acts.
Select the target separately, using a declared reference or reward multiple. If the market leaves insufficient room, skip the setup rather than tightening its stop solely to manufacture an attractive ratio. Freeze the initial levels before entry and record later modifications as separate decisions.
2. Use the executable side for both exits
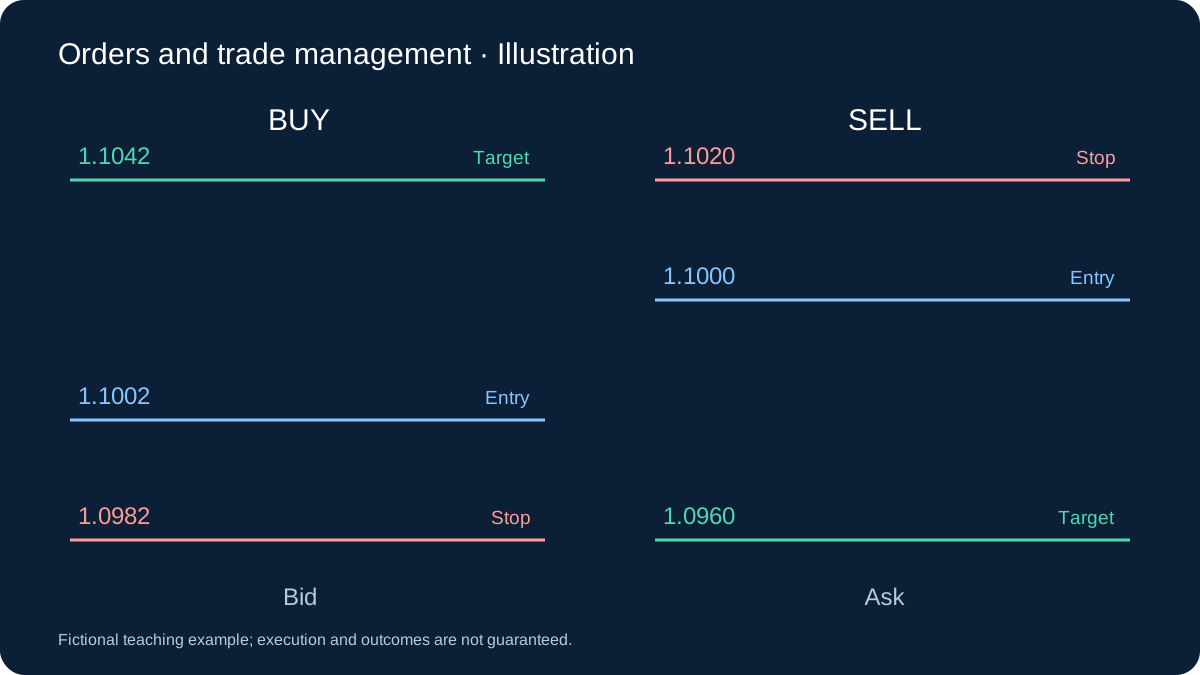
A BUY enters at Ask and exits at Bid. Its initial stop is normally below entry and target above it. A SELL enters at Bid and exits at Ask; its initial stop is above entry and target below. These are initial arrangements: a later protective stop can pass beyond the entry price.
For a BUY filled at Ask 1.1002, a Bid stop at 1.0982 is 20 pips away, and a Bid target at 1.1042 is 40 pips away. Both distances already start from the executable entry. Do not add the opening spread again. A stop at a chart level measured only from entry Bid would give a different executable distance.
3. Work the SELL case independently
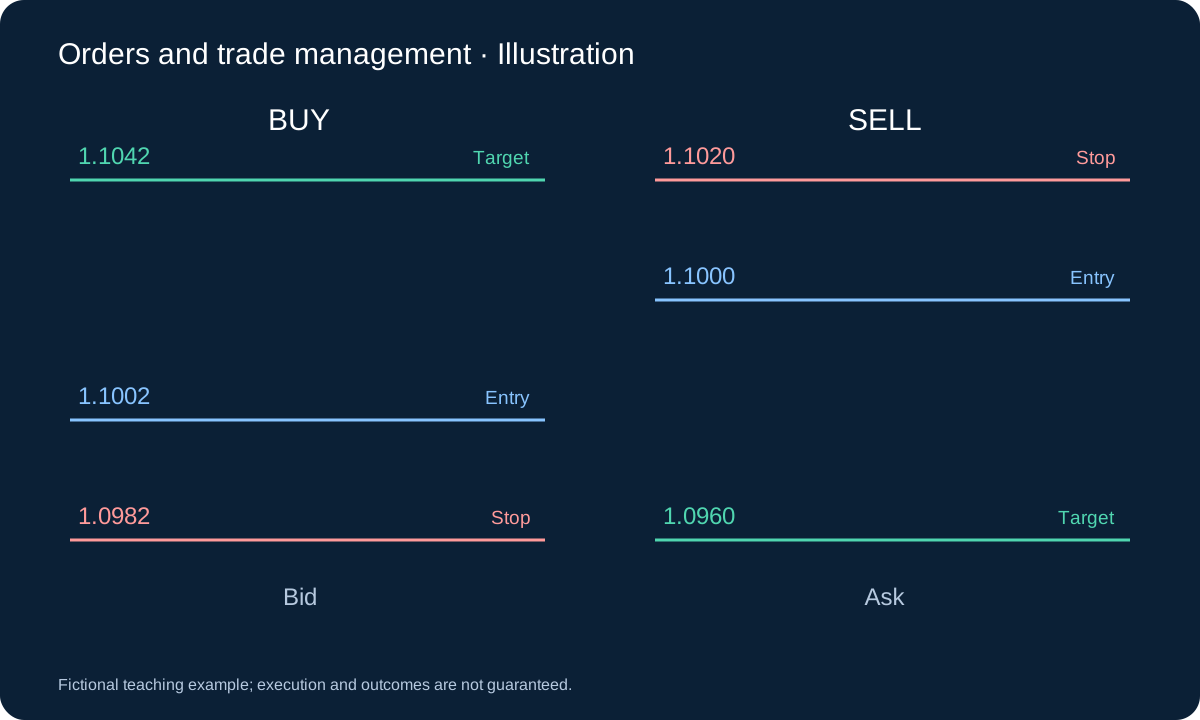
Assume a SELL filled at Bid 1.1000 while Ask is 1.1002. Set the Ask stop at 1.1020 and Ask target at 1.0960. Executable risk is (1.1020 − 1.1000) / 0.0001 = 20 pips, and target room is (1.1000 − 1.0960) / 0.0001 = 40 pips. The stop belongs above entry and potential profit below. The current Ask already makes an immediate close adverse by 2 pips.
If the spread remains 2 pips, Bid 1.0960 alone does not reach the Ask target: Ask would be 1.0962. Ask 1.0960 would correspond to Bid 1.0958. Under the same exact-fill and cost assumptions as the BUY, this SELL has the same cash arithmetic. A different Ask path or fill changes that result; symmetry of a drawn chart does not supply historical execution evidence.
4. Size from the loss budget, not the margin requirement
Assume EURUSD, a USD account, 100,000 EUR per lot, USD 10 per pip per lot, equity USD 10,000 and an illustrative 1% loss budget of USD 100. These contract and currency assumptions are essential. For a different account currency, convert pip value using an appropriate contemporaneous rate; verify the broker’s contract.
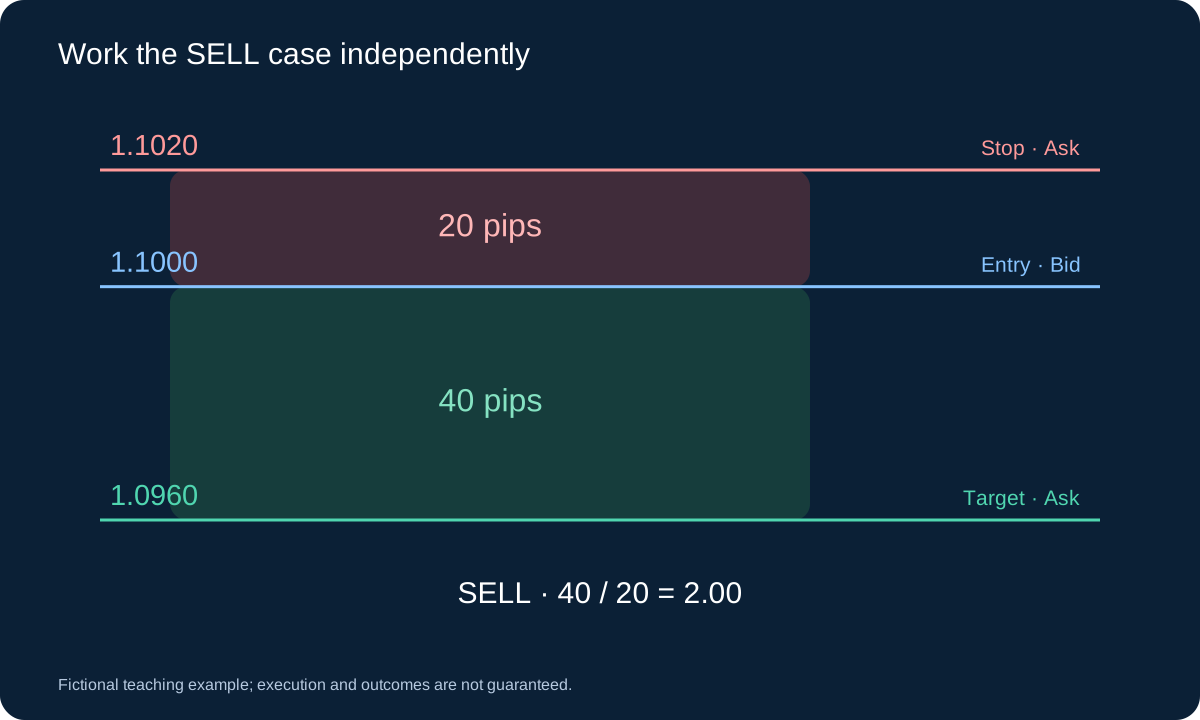
Allow USD 7 round-trip commission per lot and a 2-pip adverse stop-fill allowance, worth USD 20 per lot. Estimated loss per lot is 20 × 10 + 7 + 20 = USD 227. With a 0.01-lot step, round 100 / 227 down to 0.44 lots. The estimate is USD 99.88; 0.45 lots would be USD 102.15 and exceed this budget.
See the position-sizing guide for volume, contract and currency calculations.
loss_per_lot = 20 × 10 + 7 + 2 × 10 = 227 USD; lots = floor((100 / 227) / 0.01) × 0.01 = 0.44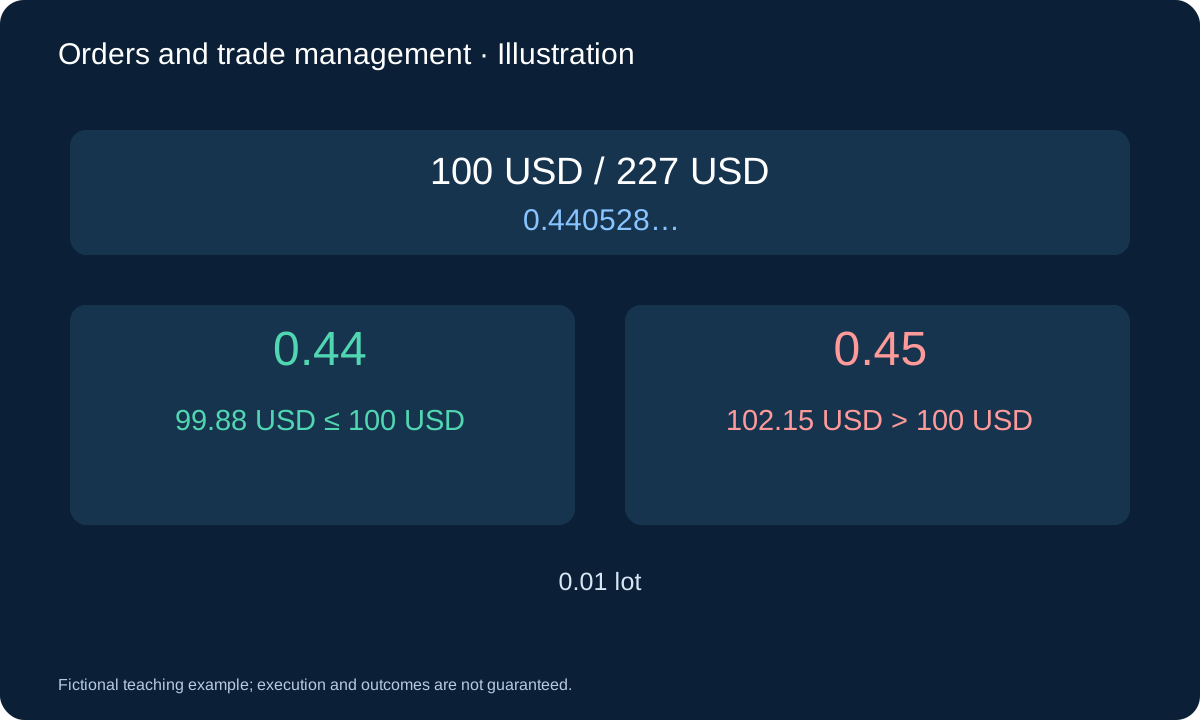
5. Keep the contract, pip and account currency separate
In EURUSD, EUR is the base currency and USD the quote currency. With a 100,000-unit contract and pip size 0.0001, one pip per lot is 100,000 × 0.0001 = USD 10. The USD result follows from this contract and quote currency; it is not a universal pip value for every symbol. A five-decimal display usually makes one point 0.00001, so this pip is 10 points. The minimum executable tick must still be checked separately.
If the account is in EUR and EURUSD is 1.1000, USD 10 converts to about EUR 9.09 per pip per lot under that illustrative conversion. Use the applicable conversion side and rate for an actual account; they can change between sizing and exit. For other instruments, derive value from the documented contract or tick value in account currency. Do not copy the USD 10 assumption into a yen pair, gold or an index.
6. A gross 2:1 distance becomes a smaller net payoff
At 0.44 lots, the 20-pip gross stop loss is USD 88.00 and the 40-pip gross target profit is USD 176.00. Commission is USD 3.08. The adverse stop allowance is USD 8.80. Thus the assumed net loss is USD 99.88 and the assumed net win is USD 172.92, with no target slippage or swap in this example.
The resulting payoff ratio is about 1.73:1, although the chart distances remain 2:1. This is a scenario estimate, not a ceiling on real loss. Gaps, changed conversion rates, financing, execution charges and worse slippage can change the outcome. Recalculate from actual fills after the trade.
net_win / net_loss = 172.92 / 99.88 ≈ 1.73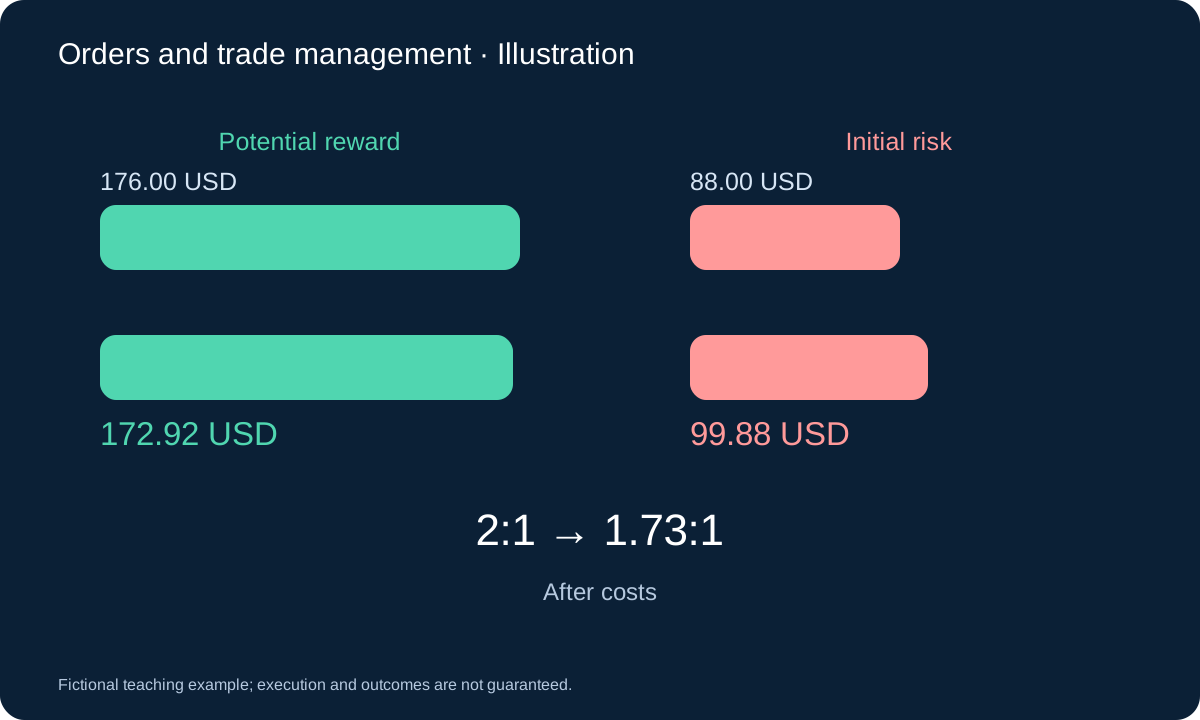
7. Stress the loss estimate before sending
Hold the entry, 20-pip stop, USD 10 pip value and USD 7 round-trip commission per lot fixed. Change only adverse stop slippage. These rows are alternative scenarios for one trade, not three realised outcomes. The 2-pip allowance is a sizing assumption, not a maximum the broker must respect.
| Adverse stop slippage | Net loss at 0.44 lot | Versus USD 100 budget |
|---|---|---|
| 0 pips | 91.08 USD | Within budget |
| 2 pips | 99.88 USD | Within budget |
| 8 pips | 126.28 USD | Budget exceeded |
At an 8-pip allowance, estimated loss per lot would be USD 287. A fresh size calculation gives 0.34 lots and USD 97.58 estimated loss; this is a pre-entry calculation, not a reason to enlarge the stop after entry. If the broker’s minimum lot is too large, the trade does not fit the budget. Keeping extra free margin does not repair an oversized loss estimate.
8. A reward ratio does not supply a win probability
For constant wins W and losses L, zero expected payoff requires p = L / (W + L). Gross +2R / −1R gives 33.3% before costs. The example’s W = 172.92 and L = 99.88 gives about 36.6%. Neither number estimates how often this strategy will actually win.
Real strategies have variable exits, missed orders and changing costs. Use the observed distribution of net results rather than forcing all trades into two outcomes. Keep initial R defined consistently: price risk, net loss estimate and the chosen budget are different denominators. Do not improve reported R by shrinking the denominator after a partial close.
p_break_even = 99.88 / (172.92 + 99.88) ≈ 36.6%9. Test the payoff against an explicit outcome distribution
Imagine 50 independent recorded outcomes with the same hypothetical net win USD 172.92 and net loss USD 99.88. Twenty wins and thirty losses give 20 × 172.92 − 30 × 99.88 = USD 462.00. Fifteen wins and thirty-five losses give 15 × 172.92 − 35 × 99.88 = −USD 902.00. Both use the same stop and target distances. The difference is the outcome distribution, which a reward ratio cannot supply.
This arithmetic is a teaching comparison, not a model of real serial dependence, confidence or future profit. Actual trading also includes variable time exits and exceptional losses. Before sending, confirm the current quote, cost assumptions, downward-rounded volume and accepted protection. Afterwards reconcile the realised net result with the estimate, investigate the discrepancy and preserve the original denominator. Use a series of trades and untouched validation to assess the rule.
10. Handle protection failures explicitly
Check minimum stop distance, tick alignment, volume step, market availability and the server response. A request is not proof of an attached stop. If the intended protection is rejected after entry, the EA needs a predeclared response, such as an attempted immediate close and an alert; repeated unbounded retries are not a risk policy.
An ordinary Stop Loss may execute beyond its level in a gap. An emergency local exit also needs connectivity and available execution. Moving the stop farther away increases exposure; reassess the entire open risk rather than treating the change as harmless. Margin or leverage does not replace this loss calculation.
11. Validate stop and target together
Compare complete rule sets on the same chronologically separated data, with spread, commission, financing and realistic fills. Record stop-outs, targets, time exits, rejected protection and ambiguous bars. If one candle reaches stop and target, its OHLC alone does not reveal which came first.
Inspect net expectancy, drawdown, tail losses, trade count and sensitivity to nearby settings. A wide target may increase gross reward while reducing its hit rate or extending holding time. A very tight stop may increase costs relative to risk. Confirm the selected rules on untouched data and then forward-test without retuning after each loss.
Questions
Does a Stop Loss guarantee the chosen loss budget?
No. It sets an exit instruction. A gap, slippage, unavailable trading or rejected protection can produce a larger loss. Budget allowances are assumptions to test, not execution guarantees.
Should I move the target to maintain 2:1 after every price change?
Define that policy before testing. Moving the target creates a different exit rule and can change holding time and outcomes. The initial ratio does not need to be continually restored.
Sources and scope
MetaQuotes documents exit mechanics and platform distance limits. The sizing arithmetic, cost assumptions and validation framework here are our own educational examples. No suitable personal risk percentage or profitable parameter setting is established.
Fictional teaching example; execution and outcomes are not guaranteed.