

A currency pair can rise over several days and fall for the last few hours. A moving average can still point upward while the latest candle closes below it. Neither observation is necessarily an error: they may describe different horizons or different stages of a move.
This guide explains how to read that evidence without treating an indicator as a forecast. You will define the chart you are analysing, use a simple moving average to organise the data, and work through an example whose calculations you can check. The aim is a repeatable description of the market, before any entry, exit or position-sizing decision.
1. Define the trend you are trying to identify
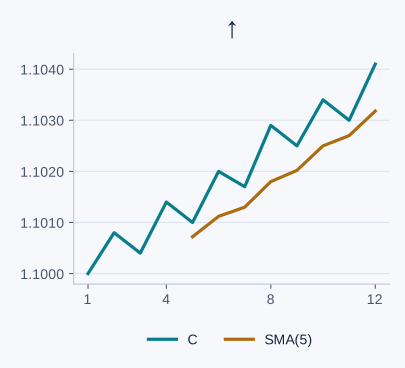
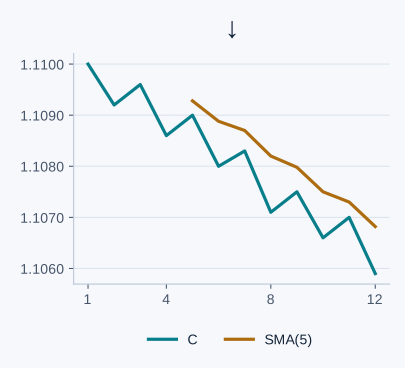
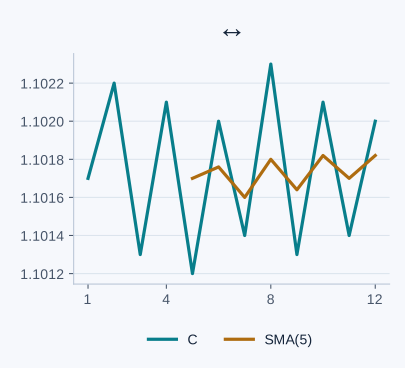
For this guide, a trend means a directional pattern over a stated section of a price chart. An upward structure has successive higher swing highs and higher swing lows; a downward structure has lower highs and lower lows. A range repeatedly returns through a similar area without maintaining that sequence. A transition may fit none of those descriptions cleanly.
A swing is a local turning point, not every change in candle colour. Its identification needs a rule. A point that looks obvious after several more candles may not have been identifiable when it first formed. Use only the swings that your chosen rule could already confirm at the time. Our market-structure guide explains that timing in detail.
Keep the observation window consistent. Reclassifying the same chart as a five-minute trend after previously judging it on H4 changes the question. It does not resolve the disagreement.
2. What a trend indicator actually does
A technical indicator transforms market data into a value, line or other display. A trend indicator uses that transformation to help describe direction, persistence or a related feature of movement. A moving average is a simple example: smoothing a sequence makes its recent path easier to see.
The output depends on the inputs. Change the timeframe, the averaging period, the price field or the broker's history and the reading can change. An average calculated from closing prices is not the same measurement as one calculated from the midpoint of each candle's high and low.
An indicator adds a particular way of organising information. It does not add knowledge of prices that have not occurred. Its usefulness depends on whether that organisation answers your question more clearly than the raw chart.
3. Separate direction, strength and persistence
| Question | What to examine | What it does not establish |
|---|---|---|
| Direction | The swing sequence and whether an average is rising or falling over a specified interval. | The size or probability of the next move. |
| Strength | How pronounced directional movement is under a defined measurement. The Average Directional Index (ADX) is one such measure. | A BUY or SELL instruction from the ADX main line alone. |
| Persistence | Whether the directional structure survives successive pullbacks over the period you are assessing. | How long it will continue to survive. |
ADX illustrates why the distinction matters: its main line concerns trend strength, while price and the separate +DI and −DI lines provide directional context. An increase in ADX is not, by itself, evidence of an upward price trend.
A steep line is also not a portable strength score. Changing the chart's vertical scale changes its visual angle. Record an actual price change over a stated number of bars if you want a repeatable slope description. Do not compare the apparent angle of two screenshots as though it were a calibrated measurement.
4. Trend indicators, oscillators and the meaning of “leading”
The categories describe a tool's main job, and they overlap. A moving average is commonly used to describe trend direction. An oscillator such as the Relative Strength Index (RSI) describes a different feature of price movement on its own scale. Moving Average Convergence/Divergence (MACD) is derived from moving averages and is used for both trend and momentum analysis; it does not fit a strict either-or classification.
Lagging means a signal follows a change already present in its inputs. A moving average needs new observations to alter its reading. Leading usually describes a tool or interpretation intended to flag a possible turn before another confirmation appears. The label does not mean it can observe future prices or that the turn must happen.
For example, an oscillator can remain elevated while price continues to rise. A faster warning and a slower confirmation answer different questions. Neither is automatically superior; judging one by the other's job produces misleading conclusions.
5. Use a moving average as a transparent first example
A simple moving average, or SMA, gives each observation in its window equal weight. For an SMA calculated from closes, add the last N closing prices and divide by N. An exponential moving average, or EMA, gives greater weight to recent observations. The weighting changes responsiveness; it does not remove uncertainty.
SMA(N) = (sum of the last N closes) / N
Read two different relationships. Price location tells you whether the selected close is above or below its corresponding average. Average slope compares the average's value with an earlier value. A close can move below an average while that average is still rising.
For the walkthrough below, the settings are EURUSD, H1, SMA, period 5, Close, chart shift 0. Five periods keep the arithmetic visible. This is an illustrative choice, not a recommended universal setting or an optimised trading parameter.
In MT4, add the built-in Moving Average through the Navigator or the Insert → Indicators menu, then check the calculation settings. Leave the chart shift at zero for this example. Moving the plotted line horizontally changes where it is drawn, not which future prices are available.
6. Choose the timeframe and period before judging the chart
The timeframe defines a candle; the period defines how many observations the calculation uses. An SMA(20) on M15 uses twenty 15-minute closes. On H1 it uses twenty hourly closes. On D1 it uses twenty daily closes. Those are different sampling windows, even though the period input is identical.
There is another important difference: twenty M15 closes do not equal five H1 closes simply because their nominal duration is five hours. The observations and their weights differ. Session gaps and the broker's bar boundaries also matter.
A shorter averaging window generally responds more quickly to changes in its inputs and exposes more short-term variation. A longer one smooths over a larger window but can retain an old directional reading through a substantial correction. Neither setting makes a ranging market trend.
Start with the horizon you need to describe and a review schedule you can follow. If you inspect H1, write an H1 conclusion. If you also inspect H4 (four-hour candles), record it separately: “H4 upward structure; H1 pullback” is more informative than switching between charts until you find agreement.
7. Know whether the candle has finished
A forming candle's current price can change before it closes, and an indicator using that price can change with it. In MT4 price timeseries, index 0 refers to the current bar; the most recent completed bar is at index 1 once the next bar has begun and the data are available.
For this guide's routine, compare completed closes with their matching completed indicator values. Keep the pair, timeframe and observation time the same. A screenshot taken during a candle and a journal entry recorded after its close can legitimately show different readings.
For an Expert Advisor (EA), the indicator's chart displacement and the bar being read are separate settings. MQL4's iMA has both a ma_shift argument and a final shift argument. Selecting a closed bar is not the same as moving the line on the chart.
8. Work through an upward-trend reading
This is a synthetic EURUSD H1 sequence. It is constructed to explain the method, not taken from a historical account, and it contains no trades or performance results. Bars are numbered in chronological order. In this example, one pip is 0.00010.
First stop after bar 12 has completed. Do not use bars 13–15 for this first assessment. The last five closes available for its SMA are:
| Completed bar | Close |
|---|---|
| 8 | 1.10220 |
| 9 | 1.10190 |
| 10 | 1.10160 |
| 11 | 1.10210 |
| 12 | 1.10250 |
| Sum / 5 | 5.51030 / 5 = 1.10206 |
The previous SMA, at bar 11, is 1.10186. The average has therefore risen by 0.00020, or 2.0 pips, over one bar. Bar 12 closes at 1.10250, above its SMA of 1.10206.
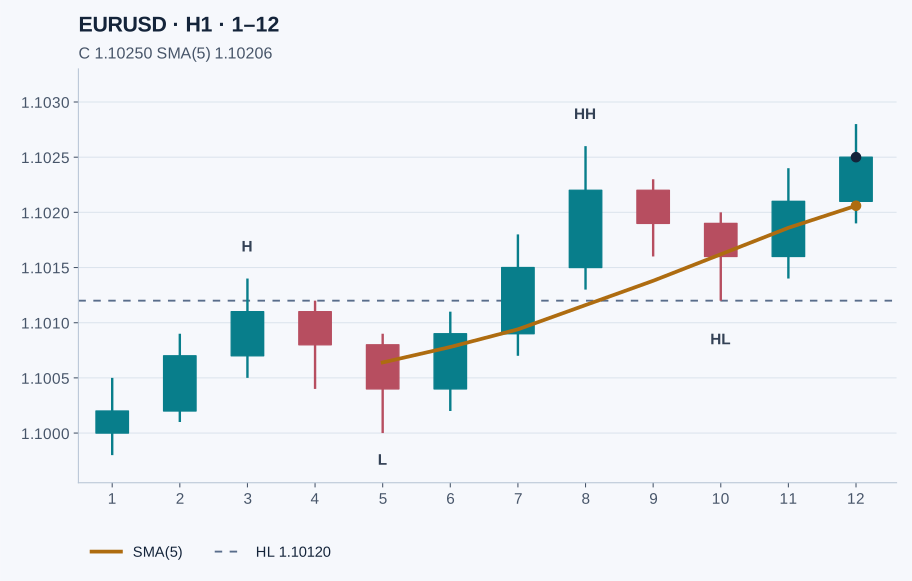
The price structure adds a separate description. The confirmed swing highs are 1.10140 at bar 3 and 1.10260 at bar 8. The confirmed swing lows are 1.10000 at bar 5 and 1.10120 at bar 10. Each later high and low is higher than its predecessor.
Here a swing must exceed the highs, or fall below the lows, of two bars on each side. It only becomes confirmed after the second following bar completes; equal values would not qualify. The low at bar 10 therefore becomes available as a confirmed reference at bar 12, not at bar 10. This is one explicit convention for the example, not a universal swing definition.
A defensible journal entry: “After H1 bar 12: upward confirmed swing sequence; SMA(5) rising; close above the average. Last confirmed higher low: 1.10120.” That describes available evidence. It does not establish an entry price, a stop, an acceptable position size or the probability of a profitable trade.
9. Reassess when price and the average disagree
Now advance to the close of bar 15. Its close is 1.10210. SMA(5) is 1.10244, up from 1.10234 at bar 14. The close is below a still-rising average.
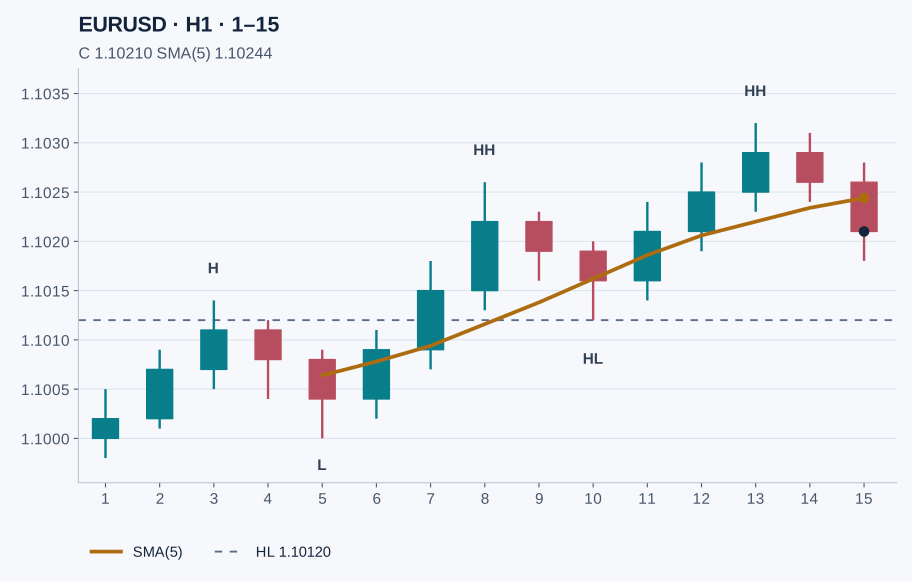
The latest confirmed swing low remains 1.10120; the intervening candles have not traded below it. The higher high at bar 13 (1.10320) is now confirmed too, only after bars 14 and 15 have completed. Crossing the average has changed one observation, but has not by itself created a lower-high/lower-low structure under the stated swing convention.
A more careful update is: “Short-term price location has weakened; the average still rises; the last confirmed higher low remains intact.” The next observation may clarify the situation or make it less orderly. Keep the mixed reading visible rather than changing the period to restore an attractive chart.
This example shows why “above means buy, below means sell” is an incomplete trading process. A strategy would still need a specific trigger, invalidation, execution checks and risk rules. The existing moving-average pullback strategy addresses that separate task.
Show the complete synthetic OHLC dataset
All fifteen rows below are illustrative inputs. Only rows 1–12 are available in the first snapshot. The second snapshot uses rows 1–15.
| Bar | Open | High | Low | Close | SMA(5) |
|---|---|---|---|---|---|
| 1 | 1.10000 | 1.10050 | 1.09980 | 1.10020 | — |
| 2 | 1.10020 | 1.10090 | 1.10010 | 1.10070 | — |
| 3 | 1.10070 | 1.10140 | 1.10050 | 1.10110 | — |
| 4 | 1.10110 | 1.10120 | 1.10040 | 1.10080 | — |
| 5 | 1.10080 | 1.10090 | 1.10000 | 1.10040 | 1.10064 |
| 6 | 1.10040 | 1.10110 | 1.10020 | 1.10090 | 1.10078 |
| 7 | 1.10090 | 1.10180 | 1.10070 | 1.10150 | 1.10094 |
| 8 | 1.10150 | 1.10260 | 1.10130 | 1.10220 | 1.10116 |
| 9 | 1.10220 | 1.10230 | 1.10160 | 1.10190 | 1.10138 |
| 10 | 1.10190 | 1.10200 | 1.10120 | 1.10160 | 1.10162 |
| 11 | 1.10160 | 1.10240 | 1.10140 | 1.10210 | 1.10186 |
| 12 | 1.10210 | 1.10280 | 1.10190 | 1.10250 | 1.10206 |
| 13 | 1.10250 | 1.10320 | 1.10230 | 1.10290 | 1.10220 |
| 14 | 1.10290 | 1.10310 | 1.10240 | 1.10260 | 1.10234 |
| 15 | 1.10260 | 1.10280 | 1.10180 | 1.10210 | 1.10244 |
10. Put the reading beside structure and price levels
A rising average is a summary of its input window. It cannot tell you that a previous high will break, or that a pullback will hold at the line. Describe nearby support and resistance from the price chart instead of assuming the average acts as a barrier.
An upward reading immediately beneath a prior swing high is different from the same reading after price has moved away from that area. That distinction matters when a separate strategy assesses the room available before the next obstacle. It does not require adding another indicator.
Likewise, a pullback through an average and a break of a predefined structural reference are different events. Record which occurred, and whether your rule requires a wick or a completed close. Our BOS and CHoCH guide works through closed-bar structural breaks without treating every break as a confirmed reversal.
11. Build a simple trend-reading routine
- Define the question. Record the pair, broker feed, timeframe, price input and whether the assessment uses completed bars.
- Describe price first. Identify the confirmed swing sequence or a clearly bounded range. If the structure is transitional, write that down.
- Add one understandable measurement. For a first exercise, calculate an SMA from closes. Keep its period and chart shift fixed while you observe the sequence.
- Separate its observations. Record the close's location relative to the average and the average's change over your chosen interval.
- State the disagreement and the review condition. Note nearby levels and what new information would alter your description. Revisit it at the next scheduled assessment.
This routine is an exercise in interpretation. It contains no automatic entry rule. If you later need a strength measure, learn what it measures before adding it; the ADX and directional-movement strategy keeps strength and direction distinct.
12. Recognise the conditions that make readings less useful
A range can generate repeated crossings. If price oscillates around an average, each side change may say little about persistence. Slowing the average can reduce some changes but also delays its response. It does not guarantee better trade outcomes.
A transition can preserve an old slope. Strong earlier observations remain inside the calculation after price begins to turn. Conversely, an old low dropping out of the window can lift an SMA even when the latest close falls.
A sudden move can stretch the distance to the average. A line pointing in the same direction is not a reason to ignore an extended price, a nearby obstacle or a changed spread. Analysis and the ability to execute a sensible trade are different matters.
Data and display choices can obscure the comparison. Missing history, different bar boundaries or a different price source can produce different values. Check those inputs before deciding an indicator has failed or an EA is reading the wrong signal.
13. Keep an indicator signal separate from an EA's rules
A manual trader can write “close above a rising average.” An Expert Advisor needs precise definitions: which symbol and timeframe, which average, which completed bars, how the slope is compared, and what happens when data are unavailable.
That signal definition is only one part of a trading system. Entry timing, exits, invalidation, costs and position sizing still need their own rules. The risk-management guide addresses the exposure question that an indicator reading cannot answer.
Any claimed trading benefit must be evaluated separately. Use a documented backtesting process, include execution costs and keep forward observations. Repeatedly choosing the period that best matches a historical chart risks overfitting. A clean example or attractive indicator line is not performance evidence.
14. Replace common shortcuts with specific observations
| Shortcut | A more precise record |
|---|---|
| “The pair is trending.” | “On H1, these confirmed swings form an upward sequence as of this completed bar.” |
| “It crossed the average, so the trend reversed.” | Record the crossing, slope and structural references separately. |
| “The indicator changed its mind.” | Check whether you compared a forming candle with its final close. |
| “A steeper chart means a stronger trend.” | Use a stated price change and interval; check the chart scale. |
| “More agreeing indicators prove the move.” | Check whether they repeat a similar calculation on the same price history. |
| “This period always works best.” | State the purpose of the setting and evaluate it beyond the examples used to choose it. |
15. A checklist before you label the trend
- The pair, timeframe and assessment point are recorded.
- The indicator's method, period, price input and chart shift are known.
- The analysis distinguishes forming candles from completed ones.
- The swing references were identifiable at the time they are used.
- Price location and average slope are recorded separately.
- Any range, transition or conflicting evidence remains visible.
- Nearby structural levels and a condition for reassessment are stated.
- Any trade decision will also require execution and risk rules.
16. Questions that arise on a real chart
Can price be above a moving average while the larger trend is downward?
Yes. Price can rally above a short-window average during a correction within a longer downward structure. State the timeframe and lookback before comparing the two descriptions. A close above an average does not, by itself, replace the larger swing sequence.
Why can an average rise when the latest candle closes lower?
A moving window both adds an observation and removes an older one. For an SMA, the change depends on the new close relative to the close leaving the window, not solely on the new close relative to the immediately preceding candle. Bar 15 in the walkthrough shows this distinction.
Does a rising ADX mean I should look for a BUY?
The ADX main line does not specify upward direction. It can rise during a downward move too. Read direction separately from price or the directional-movement components, then apply the rules of a separately defined strategy.
Which timeframe or moving-average period should a beginner choose?
There is no universal best combination. Choose a horizon that matches the movement you want to describe and a review schedule you can maintain. Begin with a calculation you understand, keep its settings fixed for the exercise, and record its weak readings as well as its clear ones. The five-period example here is for arithmetic only.
Does waiting for a candle close make every indicator non-repainting?
No. It avoids treating an unfinished value as final, but custom indicators may revise historical signals or use later data. Historical data can also be corrected. Check the indicator's calculation and the time each signal actually became available; a closed-candle rule alone is not a complete audit.
Do I need a paid indicator or a live trading account to practise this?
No purchase or live trade is needed to reproduce this guide's example. The built-in Moving Average and the synthetic data below the walkthrough are enough for the exercise. Practising the calculation does not establish that any related strategy will be profitable.
17. Method and scope
The calculation and platform descriptions were checked against MetaQuotes documentation. The official Moving Average reference explains the averaging methods. The synthetic dataset, the two snapshots and the journal routine are original educational examples, not a tested trading system.
Calculation settings and trading rules serve different purposes. The next guides in this cluster will compare individual trend indicators and examine how to combine signals. This first guide establishes the reading process on which those tasks depend.