

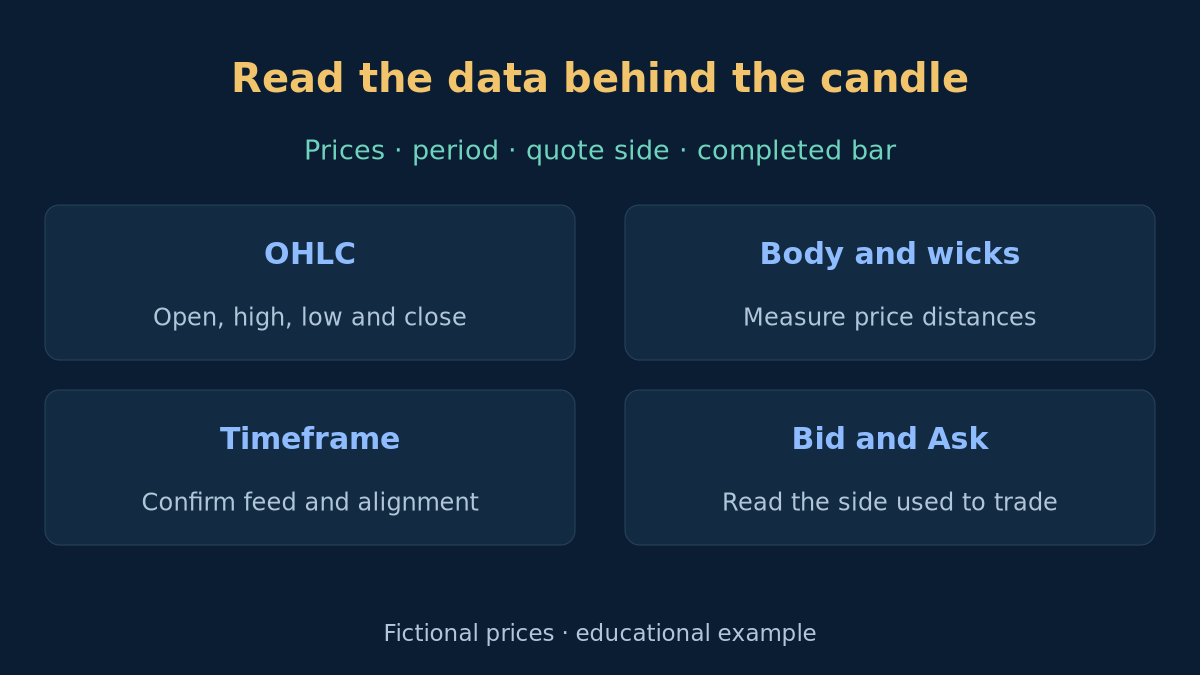
A candle is a compact record of prices, not a complete replay of the market. Learning to read it means connecting its shape to actual values and knowing which information the picture leaves out. This guide builds a small EURUSD example, combines lower-timeframe bars and separates MT4 chart prices from execution quotes. The examples explain chart mechanics; they do not define an entry setup or establish that a candle pattern is profitable.
1. Start with the symbol, axes and data feed
Before naming a candle, identify the exact instrument, provider, chart type and period. The vertical axis shows price; the horizontal axis locates bars in time. Check the date as well as the hour. Zoom and automatic scaling change the visual proportions, so a tall-looking candle is not a reliable measurement of pips. Read the values rather than measuring screen pixels.
For ordinary Forex candlesticks in MT4, the bar history is based on Bid prices. Another platform can show a different price basis or a transformed chart. Heikin-Ashi and other calculated candles are not the raw OHLC record used here. Confirm the actual symbol and contract specifications, including suffixes and decimal precision, before comparing charts.
2. Match the body and wicks to OHLC
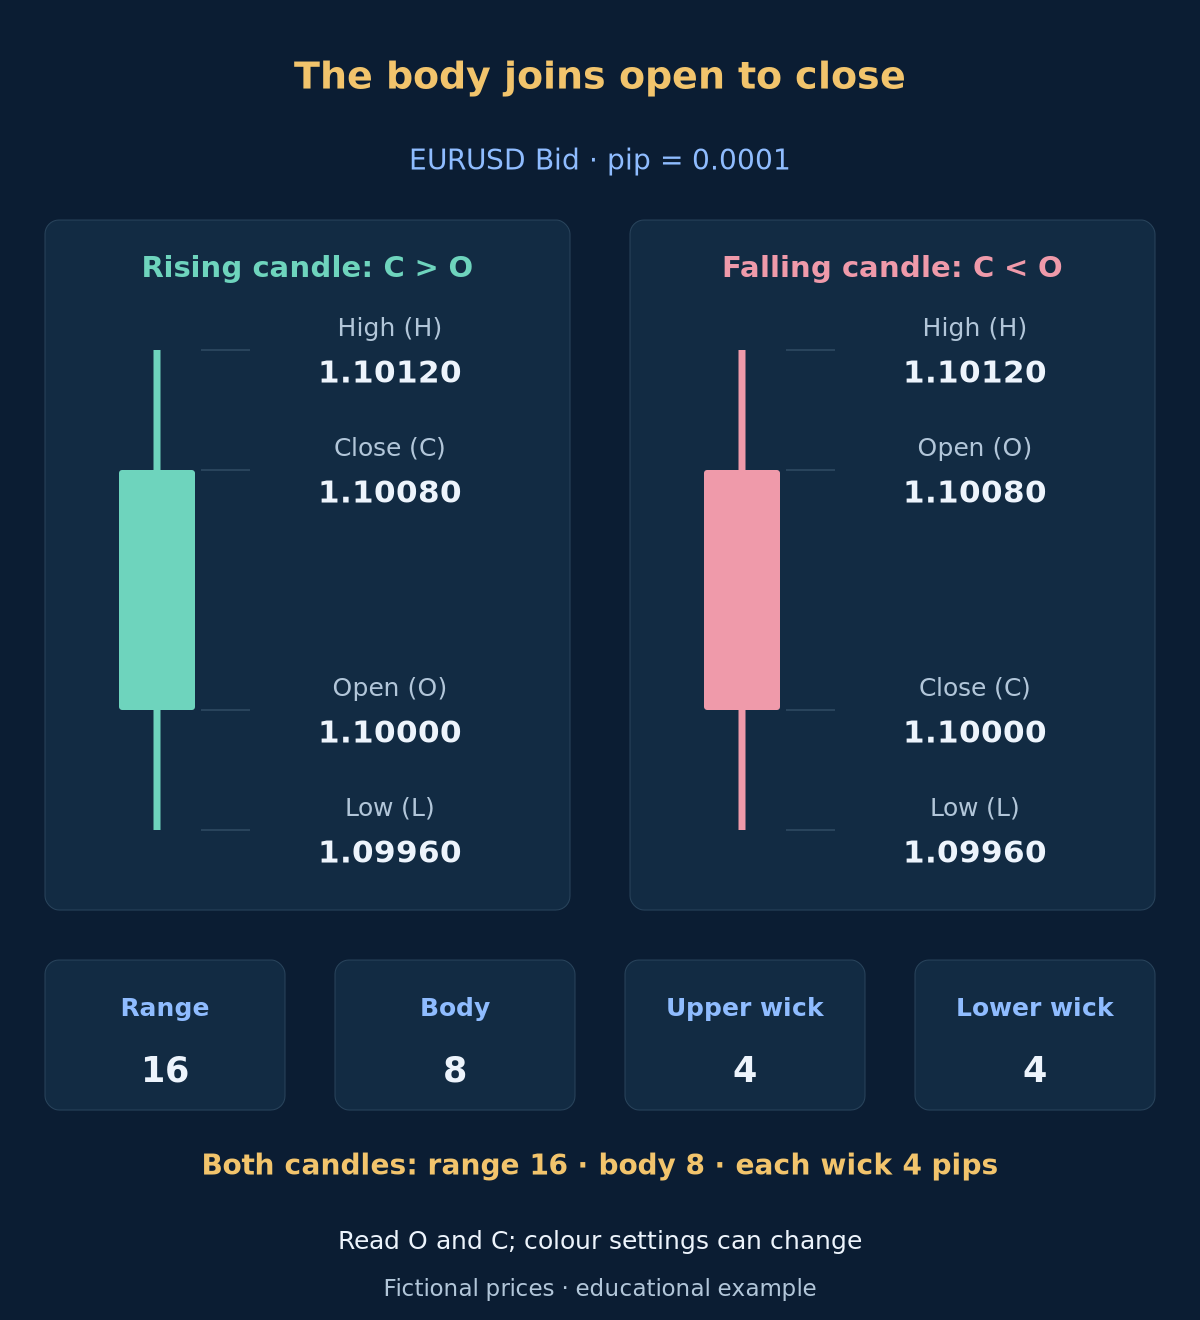
O is the opening price of the period, H its highest price, L its lowest price and C its closing price. For a bar still forming, C is the latest available price and is not final. Our completed rising EURUSD Bid candle has O 1.10000, H 1.10120, L 1.09960 and C 1.10080. The body joins O to C; the upper wick reaches H and the lower wick reaches L.
A rising candle closes above its own open; a falling candle closes below it. Colours and fill styles are configurable. Read the O and C values even if the template uses unfamiliar colours. A rising candle can still close below the previous candle’s close. If open equals close, the body has zero price height; a small-body or doji label does not by itself explain the next move.
3. Measure range, body and wicks in consistent units
In the rising example, H - L is 0.00160, or 16 pips with pip size 0.0001. The body is 0.00080, or 8 pips. H minus the higher of O and C gives an upper wick of 0.00040, or 4 pips; the lower of O and C minus L gives the same 4 pips. Range equals body plus both wicks. These are price distances, not cash profit or risk.
On this five-decimal example, point is 0.00001: the range is 160 points, and 1 pip equals 10 points. Do not apply that conversion to every instrument. A price-update tick, the permitted tick size and a pip are different concepts. Use the symbol’s definitions and the pip and pip-value guide when converting a chart distance into units or money.
4. Know what a finished candle cannot tell you
OHLC gives endpoints and extremes but does not show the order of all price movements inside the bar. The high could have occurred before the low or after it. Many quote sequences can produce the same completed candle. A wick records an excursion in that price feed; it does not identify who traded, prove a stop hunt or establish why price moved.
The body also does not measure how many buyers or sellers participated. MT4 iVolume reports tick volume for the specified bar, not a universal traded-contract volume for the whole Forex market. Avoid reconstructing exact fills or the order of a stop and target from one candle alone. Those questions need suitable quote or tick history and explicit execution assumptions, especially in backtesting.
5. Combine timeframes without averaging the prices
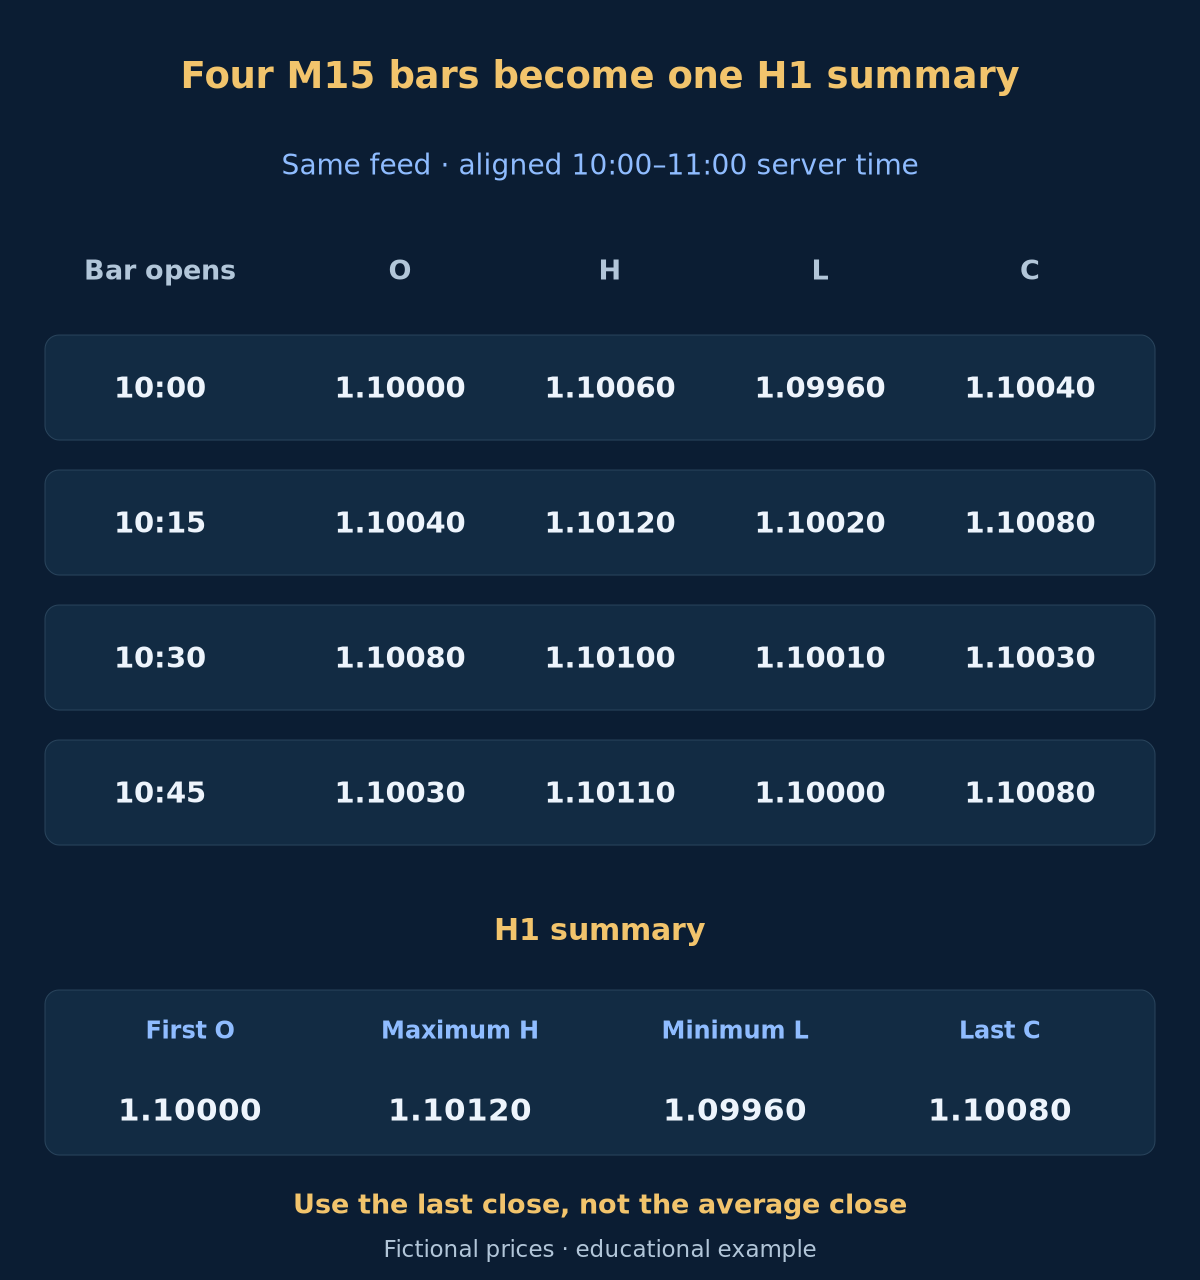
M15 means a period of 15 minutes; H1 means one hour. For the fictional, complete Bid data below, four aligned M15 bars cover the H1 interval starting at 10:00. All times use the same server clock. Each row gives its opening time. The bars share a feed and have no missing subperiods in this teaching example.
| M15 opening time | Open (O) | High (H) | Low (L) | Close (C) |
|---|---|---|---|---|
| 10:00 | 1.10000 | 1.10060 | 1.09960 | 1.10040 |
| 10:15 | 1.10040 | 1.10120 | 1.10020 | 1.10080 |
| 10:30 | 1.10080 | 1.10100 | 1.10010 | 1.10030 |
| 10:45 | 1.10030 | 1.10110 | 1.10000 | 1.10080 |
The H1 open is the first M15 open, 1.10000. Its high is the maximum of the four highs, 1.10120; its low is the minimum low, 1.09960; its close is the last close, 1.10080. Do not average the closes to construct an OHLC candle. Aggregation compresses information: an H1 candle conceals the changes in direction that appeared within the smaller bars. Misaligned sessions or incomplete data will not support a clean comparison.
6. Separate the current bar from a closed bar
In MT4 timeseries indexing, shift 0 refers to the current, unfinished bar; shift 1 refers to the most recent completed bar available in that series. As new quotes arrive, the current close changes, and the high or low can extend. A candle that looked like a small body can finish very differently. Specify the symbol and timeframe when checking a value in another series.
A wall-clock boundary alone does not deliver a new price. In a quote-driven chart, confirm that a quote belonging to the next period has produced the new bar before treating the previous bar as completed. A disconnected or inactive chart can be stale. Closed-bar rules prevent using the unfinished close as final, but they do not guarantee future direction; historical records can also be corrected by the provider.
7. Read Bid and Ask before interpreting a trade
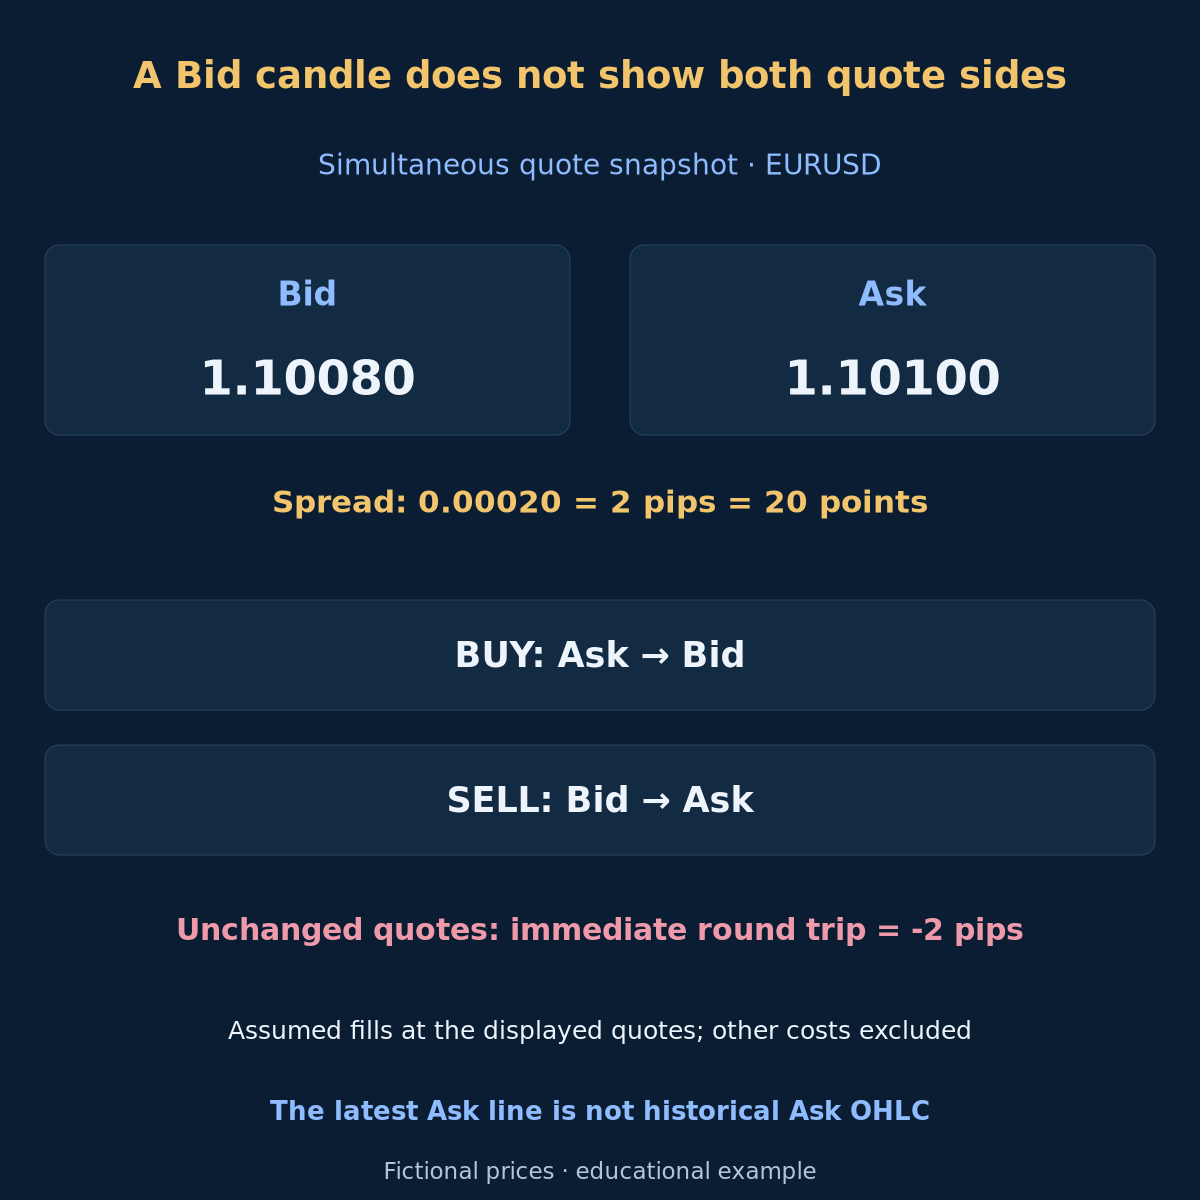
Bid is the quoted side at which a trader sells; Ask is the quoted side at which a trader buys. In the normal MT4 Forex convention, a BUY opens using Ask and closes using Bid. A SELL opens using Bid and closes using Ask. The Bid candle on its own does not show the Ask price used for a buy entry or a sell exit. Check spread and other trading costs separately.
Assume simultaneous EURUSD quotes of Bid 1.10080 and Ask 1.10100. Ask - Bid is 0.00020: 2 pips, or 20 points under our unit definitions. If quotes do not change and both fills occur exactly at those quotes, an immediate BUY round trip or SELL round trip loses 2 pips before commission, financing or other costs. This arithmetic does not promise those fills or a fixed future spread.
| Position | Opening quote | Closing quote |
|---|---|---|
| BUY | Ask | Bid |
| SELL | Bid | Ask |
8. Distinguish a chart level from an execution condition
Enabling the Ask line in MT4 displays the latest Ask level. It does not add the complete historical Ask OHLC or spread path to every Bid candle. For a short position, an Ask-based exit condition can be reached even when the visible Bid high appears below the same numerical level. Compare the relevant quote side, timestamps and account execution records before drawing a conclusion.
An apparent touch on a screenshot is not proof of an executable fill. Spreads can change, price can gap, and an order can fill at a different price. A stop instruction, a chart candle and an executed trade are separate records. Preserve the original journal and order details when investigating a mismatch; do not estimate a missing historical Ask series by adding today’s spread to old Bid bars.
9. Check server time, sessions and missing data
The displayed bar time identifies its opening period, not a promise that it matches your local clock. MT4 server time comes from the trading server; it is independent of the computer’s clock setting. Providers can use different server offsets and session boundaries. Their daily candles can therefore group prices differently. Record the time basis and check session times and daylight-saving changes when comparing feeds.
Confirm whether the chart has loaded enough history and whether the feed is current. Missing quotes, market closures, different liquidity feeds and corrected history can affect a comparison. Not every empty time interval necessarily produces a normal bar. Compare the same instrument, price side, period and time alignment before deciding that two different-looking candles indicate a platform error.
10. Use a repeatable chart-reading checklist
Record the symbol, provider, raw candle type, timeframe, timestamp and price side. In MT4, select candlesticks and use the Data Window to inspect the chosen bar’s OHLC. Then mark whether it is still forming, calculate distances in the proper pip and point units, and check the quote side relevant to any trade. Keep that record with the chart instead of relying on colour or shape alone.
For practice, reproduce the range and wick calculations, combine the four M15 rows and explain the Bid/Ask round trip without placing a trade. Then compare a forming bar with its completed version on a demo feed. This establishes the vocabulary for the next guides on candlestick patterns and chart patterns. Recognising a shape still requires context, defined rules and separate validation before any trading claim.
Optional: formulas and MT4 series examples
range = H - L
body = abs(C - O)
upper_wick = H - max(O, C)
lower_wick = min(O, C) - L
spread = Ask - Bid
iClose(Symbol(), PERIOD_M15, 0)
iClose(Symbol(), PERIOD_M15, 1)
iVolume(Symbol(), PERIOD_M15, 1)
11. Questions about reading Forex candlesticks
Does a green or rising candle mean I should buy?
It means that the close is above that candle’s open under the chosen display convention. It does not establish an entry, future return or even a close above the previous bar. Verify OHLC and the chart’s colour settings.
Can OHLC tell me whether the high or low came first?
No. The same four prices can result from different intrabar paths. Use appropriate finer-grained data for sequencing questions, and do not treat an invented path as observed history.
Why can a short trade close above the high I see?
A standard MT4 Forex candle is based on Bid, while a SELL closes using Ask. A changing spread can make the relevant Ask level differ from the visible Bid high. Check historical quotes and execution records; a screenshot alone is insufficient.
Are candle size and account profit the same thing?
No. Candle size is a price distance. Cash results also depend on position quantity, entry and exit sides, currency conversion and costs. The candle’s full range is not automatically the profit available to a trade.
12. Sources and scope
Primary documentation: MetaQuotes chart configuration and price basis, Data Window, timeseries indexing, iClose, server time, tick volume and trade price sides. Checked 2026-10-19. The arithmetic and bar examples are our own fictional constructions. Platform-specific explanations apply to ordinary MT4 Forex charts, not every chart or instrument.
Forex and leveraged trading involve substantial risk. This guide is educational and is not investment advice. Its prices and calculations are hypothetical; a chart pattern, completed bar or correct calculation does not guarantee a trading outcome.