

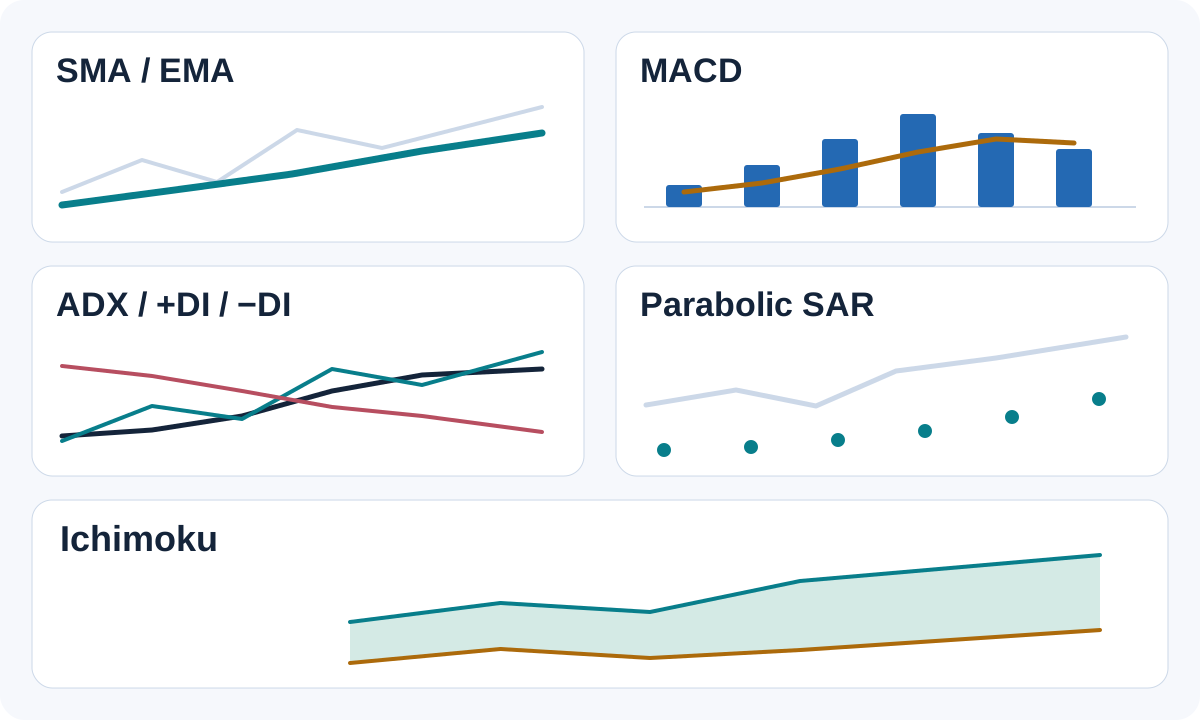
Choosing a trend indicator starts with a specific question. Do you need a readable direction filter, a measure of directional strength, a view of changing momentum, or a reference for an exit? Those jobs require different information.
This guide compares five familiar tools by their calculations, useful readings and failure modes. “Best” means suitable for a stated task, not the winner of a profitability ranking. For the foundations of trend reading, begin with our guide to identifying Forex trends.
1. Compare the jobs, not a promised win rate
A direction filter describes which side of a defined reference price occupies. A strength measure asks how pronounced directional movement has been. An entry trigger specifies when a trade becomes eligible; an exit rule specifies when exposure ends. Confirmation recognises evidence that is already available. These are separate functions.
The table describes analytical uses, not tested trade results. In a sustained move, smoothing or trailing references can remain orderly. In a range, repeated crossings and direction changes can make the same displays less informative. A clean-looking historical chart does not measure the cost of those changes.
| Tool | Main task and reading | Useful feature | Typical context | Main limitation | What it cannot establish |
|---|---|---|---|---|---|
| SMA / EMA | Direction reference: slope and price location. | Transparent smoothing on the price chart. | Following an established directional phase. | Lag and repeated crossings in congestion. | That the average will hold as support or resistance. |
| MACD | Average separation: main line, signal line and zero. | Distinguishes the sign of separation from a change in it. | Reviewing a directional move as momentum changes. | Lag, whipsaws and platform display differences. | That a divergence must produce a reversal. |
| ADX / +DI / −DI | Strength from ADX; directional context from the DI lines. | Separates strength from upward or downward direction. | Checking the character of directional movement. | Smoothing retains old information during a transition. | A BUY or SELL from ADX alone. |
| Parabolic SAR | A moving price reference; dots can switch sides. | Makes a possible trailing-exit reference explicit. | Studying management of an existing directional position. | Frequent flips in sideways or irregular movement. | An executable stop price or a profitable reversal trade. |
| Ichimoku | Midrange lines, cloud location and displaced close. | Presents several time horizons in a single framework. | Reading a directional phase against a broader price zone. | More components and a risk of time-alignment errors. | Future prices from a cloud drawn ahead of the chart. |
Scroll tables horizontally on a narrow screen.
2. Moving averages: a clear reference for direction
An SMA gives equal weight to prices in its window. An EMA weights recent prices more heavily. With the same period and price input, that weighting changes the response to new data; it does not make either version a forecast.
Price above an average, a rising average and a faster average above a slower one are distinct observations. Crossovers are possible signal definitions, but they arrive after the underlying prices have changed. In a steady move, the line can make direction easier to follow; in a range, successive crosses can alternate without useful follow-through.
Set the period, method, applied price and chart displacement deliberately. A close-based average differs from one using median price. A chart shift moves the drawing horizontally. It does not supply later observations. The moving-average pullback strategy illustrates how a separate method adds entry and invalidation rules.
Checkable example. Four synthetic closes are 1.10000, 1.10020, 1.10040, 1.10080. For period 3, seed the EMA with the first three closes' SMA: 1.10020. The next EMA, using weight 2 / (3 + 1) = 0.5, is 1.10050. The corresponding SMA of the last three closes rounds to 1.10047. The difference comes from weighting and the stated seed, not superior predictive accuracy.
3. MACD: distinguish zero from the signal line
MACD subtracts a slower EMA from a faster EMA. With the familiar close-based 12, 26, 9 setup, its main value is EMA(12) − EMA(26). Standard MT4 uses a 9-period SMA of that main series as its signal line. Other implementations can use a different signal average; check before comparing charts.
A main value above zero means the fast EMA exceeds the slow EMA. A main value above its signal means something else. A signal-line cross can occur while both values remain positive. This makes MACD useful for describing a change within an existing move, but noisy crossings in a range and late confirmation remain possible. Divergence is a warning to examine, not a required reversal.
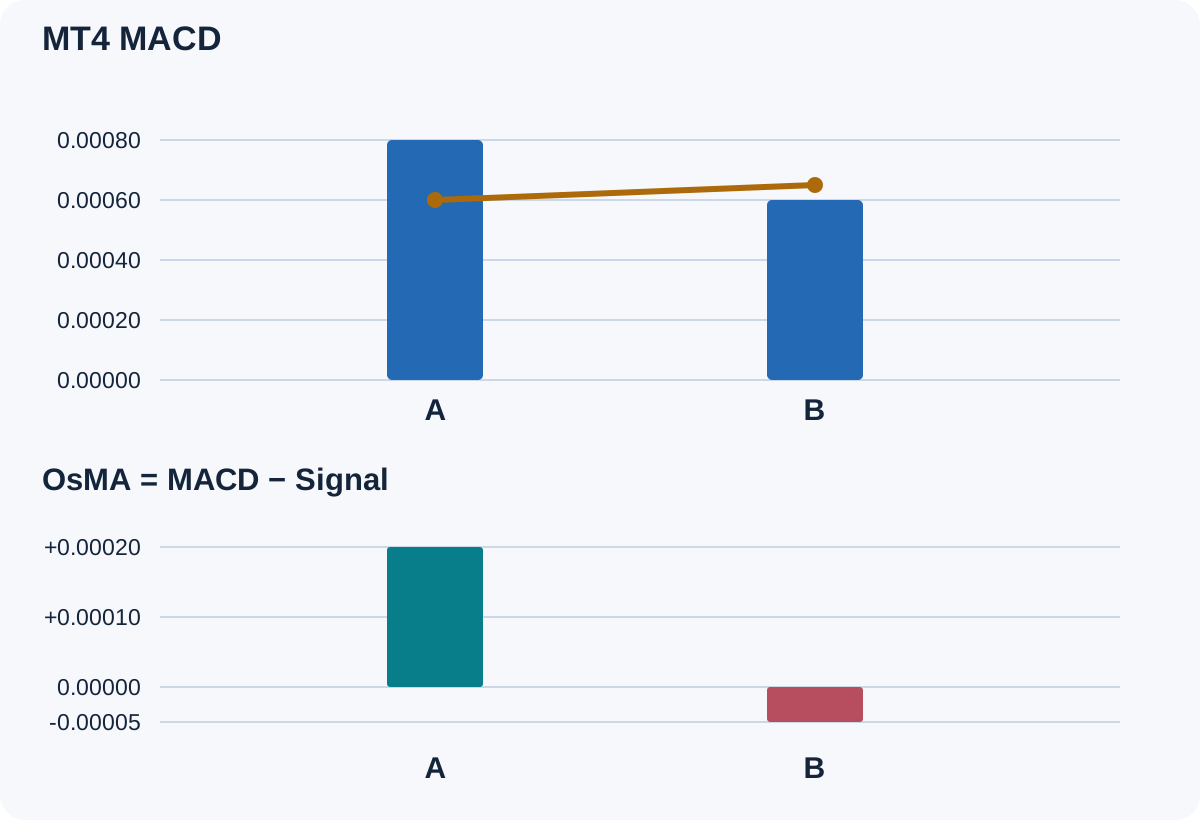
MT4 display trap. Its built-in MACD draws the main value as bars. Those bars are not automatically the difference between main and signal, often called the MACD histogram elsewhere. That difference is main − signal, the OsMA relationship. Compare the actual series, not just bar colours. Our MACD strategy keeps the trading rules separate.
Two illustrative observations. At A, assumed main and signal readings are 0.00080 and 0.00060; their difference is +0.00020. At B, they are 0.00060 and 0.00065; the difference is −0.00005. The main value stays above zero but moves below its signal. These are assumed indicator outputs for arithmetic, not a reconstruction of a complete price history.
4. ADX: strength needs a separate directional reading
The directional-movement system uses changes in highs and lows, scales movement against true range and smooths the result. Its ADX main line describes the strength of directional movement without an upward or downward sign. +DI and −DI provide separate directional information.
A rising ADX can accompany a falling market. A falling ADX can accompany a continuing upward move whose directional strength is easing. Smoothing also means that a high reading can survive the start of a disorderly transition. Check the DI relationship and the price structure rather than translating “high” into “buy”.
Period 14 is a familiar starting convention, not a proven optimum. Levels such as 20 or 25 are candidate thresholds to evaluate on the chosen implementation and market; neither is a universal boundary or a probability. The ADX and directional-movement strategy adds its own structure and timing conditions.
Reading example. Consider two independent assumed snapshots with ADX = 30. One has +DI = 28, −DI = 12; the other has +DI = 12, −DI = 28. ADX is identical, while the directional relationship is opposite. These values demonstrate interpretation, not a calculation from an OHLC dataset or evidence that either trade should be opened.
5. Parabolic SAR: examine the exit reference
Parabolic Stop and Reverse plots a reference that moves toward an extreme using an acceleration factor. Dots below or above price describe its current state. A side change is an indicator event; it does not prove a durable reversal. In an orderly directional run, the advancing reference can help study a trailing exit. A range can produce repeated flips.
The step and maximum acceleration control how that reference develops. Values 0.02 and 0.20 are familiar MT4 conventions. More responsive settings may bring the reference closer sooner, with more opportunities for price to cross it. Keep the implementation and initialization fixed when comparing settings.
One calculation step. In an assumed upward state, take previous SAR 1.10000, extreme 1.10500 and acceleration 0.02. The raw update is 1.10000 + 0.02 × (1.10500 − 1.10000) = 1.10010. This is only the recurrence: a complete implementation also handles price constraints, new extremes and reversals. It is not a complete SAR history.
A plotted dot is not a broker stop order. An exit method still needs a rule for when to update, the relevant Bid or Ask, valid stop distance, gaps and execution costs. Flipping a position on every side change is a separate strategy that requires its own testing.
6. Ichimoku: preserve the calculation time
The familiar 9, 26, 52 configuration uses midranges, not averages of all closes. Tenkan-sen is the midpoint of the highest high and lowest low over 9 bars; Kijun-sen uses 26. Senkou Span A averages Tenkan and Kijun; Span B uses the 52-bar high–low midpoint. Both spans are drawn 26 bars ahead. Chikou plots the close 26 bars behind.
Price above, inside or below the cloud describes its location relative to a zone. Tenkan–Kijun crossings are another reading. In a sustained move, these relationships can remain orderly; around or inside a repeatedly crossed cloud, directional interpretation becomes less clear. A flat midrange can persist because its window's extremes have not changed. Cloud edges are references, not guaranteed barriers.
Timing example. At completed bar 80, assume Tenkan 1.10300 and Kijun 1.10200. Span A is 1.10250, drawn at bar 106. If the close is 1.10400, its Chikou point is drawn at bar 54. Both become known at bar 80. The cloud located at bar 80 instead comes from calculations at bar 54. Drawing a value elsewhere does not move its availability back in time.
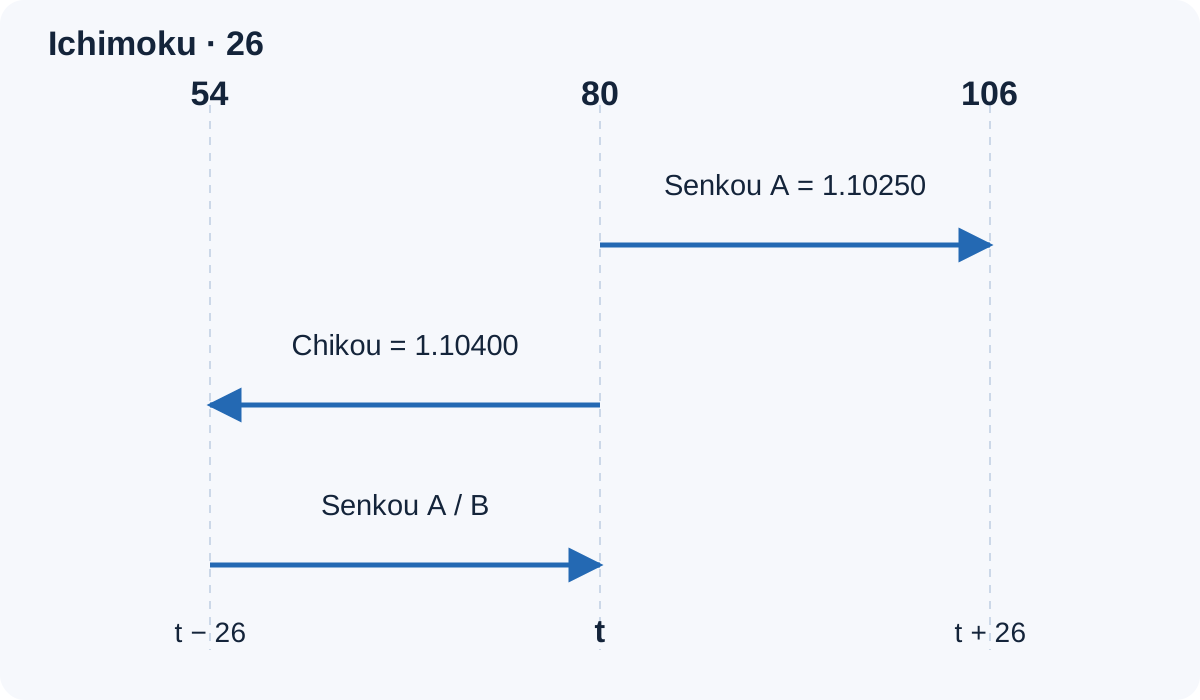
When reviewing a historical signal or an EA, record the calculation bar and the display bar separately. In particular, a Chikou point drawn on an earlier candle must not be treated as information known then. Verify buffer alignment against the actual platform before automating a cloud comparison. Our Ichimoku strategy covers a distinct trading method.
7. Settings define the question you are testing
Record the symbol, broker feed, timeframe, implementation, inputs and observation time. The same period on H1 and D1 samples different data. EMA seeds, available warm-up history and smoothing conventions can also explain differences between platforms. A parameter list alone is not a reproducible comparison.
| Tool | Record at least | Check before interpreting |
|---|---|---|
| SMA / EMA | Period, method, applied price and chart shift. | Slope, price location and initialization are different issues. |
| MACD | Fast, slow and signal periods; price; signal method. | Whether bars show main or main minus signal. |
| ADX | Period, implementation, price input where applicable and chosen threshold. | Main ADX is separate from +DI and −DI. |
| SAR | Acceleration step, maximum and initialization. | A dot, a rule and an executable stop are different things. |
| Ichimoku | Line periods, displacement and alignment convention. | When each value became available, not just where it is drawn. |
8. Select a tool for one practical job
- Describe direction simply: start by comparing price and an understandable average. Write down what slope and price location each tell you.
- Examine a change within a move: distinguish MACD's zero relationship from its signal relationship. Name the series you are reading.
- Assess directional strength: examine ADX while keeping direction in the price structure and DI relationship.
- Study an exit reference: examine SAR's behaviour through pullbacks and ranges, including the consequences of repeated flips.
- Use a broader chart framework: choose Ichimoku only after you can explain the components' lookbacks and display times.
These are starting points for study. A simpler tool that answers your question clearly can be more useful than a crowded screen. Agreement between several transformations of the same prices is not independent proof. Detailed combination rules belong in the next guide in this cluster.
9. Evaluate a rule before trusting a result
Use completed observations for this comparison and record exactly when they become available. In MT4 timeseries, bar 0 is forming and bar 1 is the latest completed bar once the next begins and data are available. Closed-bar reading does not by itself establish that every custom indicator is non-repainting.
To evaluate trading usefulness, define entry, exit, invalidation, costs and risk separately. Keep a documented backtesting process, sufficient initialization history, a reserved evaluation period and forward observations. Compare the same rules and assumptions. Repeatedly selecting settings on the best-looking history creates overfitting risk.
There is no accuracy score in this comparison because no complete trading system has been tested here. The examples are independent synthetic arithmetic or assumed readings. They contain no trades, account results or measured edge. Position sizing remains a separate risk-management decision.
10. Questions to resolve before choosing
Is EMA always better than SMA?
No. Different weighting answers a different responsiveness question. Earlier reactions can also produce more changes in congestion. Choose a purpose and evaluate the resulting rule rather than treating responsiveness as accuracy.
Why are MT4 MACD bars positive while the signal reading is bearish?
The built-in bars show the main value relative to zero. Main can stay positive while falling below its signal. A main-minus-signal display would then be negative. Establish which comparison your rule calls bearish.
Does ADX above 25 confirm an upward trend?
No. ADX has no directional sign, and 25 is not a universal boundary. Inspect price and the DI lines, the chosen implementation and how the reading developed.
Should every SAR flip close and reverse a position?
Only if a separately specified and evaluated method requires it. A chart event does not account for position ownership, spread, valid stops or the cost of repeated reversals.
Does the Ichimoku cloud predict prices 26 bars ahead?
No. The forward cloud is calculated from data already available and displayed at a later chart coordinate. It contains no future market observations.
Do I need to pay for these indicators?
These tools are included in standard MT4. A paid variant may change calculations or add features; price alone does not establish analytical value or trading performance. Check the exact implementation.
11. Method and scope
Definitions and platform distinctions were checked against the official MetaTrader 4 indicator documentation and the corresponding MQL4 references. The selection criteria and examples are educational analysis. No indicator is ranked by claimed returns, and the arithmetic examples are not backtests.
A useful choice begins with a clear job. Name what you need to measure, understand how the chosen tool transforms data, and document its limitations. A trading method still needs execution and risk rules, followed by separate validation.
Educational content. Forex and leveraged trading involve substantial risk. Illustrative calculations are not investment advice or evidence of future returns.