

Momentum divergence describes a disagreement between selected price swings and an indicator. The difficult part is deciding which swings qualify and when they became observable. A convincing line on a finished chart can hide information that was unavailable at the time. This guide makes the selection and timing explicit.
1. Define what is being compared
This guide uses a price-pivot-aligned convention: identify price pivots first, then sample RSI on those same bars. The sampled RSI values need not be separate RSI pivots. A method that matches independently detected price and indicator pivots is different; it needs its own alignment window and confirmation times.
Keep the symbol, feed, timeframe, applied price and indicator settings fixed. The momentum indicators guide explains the measurements. Here the question is narrower: can a specified swing comparison be reconstructed using only information already available?
3. Freeze the pivot rule before drawing
For the worked example, a low pivot has a Bid low strictly below the lows of the preceding 2 bars and following 2 bars. A high pivot uses the mirrored comparison. All five bars must be complete. If any compared low equals the candidate low, that low candidate fails; apply the corresponding rule to highs.
With chronological indexing, the low rule is Low(k) < min(Low(k−2), Low(k−1), Low(k+1), Low(k+2)). It becomes knowable only after bar k+2 completes and data are ready. This is the guide's strict rule, not a claim that every platform's Fractals indicator handles ties identically.
4. Pair pivots without selecting the outcome
Our example compares consecutive confirmed price-low pivots in chronological order. At each new low-pivot confirmation, compare it with the immediately preceding confirmed low pivot. Do not skip an intervening pivot because a more distant pair produces a better-looking divergence. The example adds no distance filter or overbought/oversold requirement.
Sample completed-bar RSI at each selected price pivot and retain its original timestamp. If either reading is unavailable, skip that comparison and log why. Do not replace it with zero or search backward for a more convenient value. These pairing rules are part of the definition, not adjustable chart decoration.
5. Reproduce the synthetic H1 example
These invented EURUSD Bid bars use one assumed server clock and labels showing closing time. RSI uses Close, period 5 and Wilder smoothing. The short period makes the arithmetic inspectable; it is not a recommended setting. No order, fill or account return is simulated.
| H1 close time | Bid open | Bid high | Bid low | Bid close |
|---|---|---|---|---|
01:00 | 1.10500 | 1.10530 | 1.10470 | 1.10500 |
02:00 | 1.10500 | 1.10630 | 1.10470 | 1.10600 |
03:00 | 1.10600 | 1.10630 | 1.10520 | 1.10550 |
04:00 | 1.10550 | 1.10630 | 1.10520 | 1.10600 |
05:00 | 1.10600 | 1.10630 | 1.10420 | 1.10450 |
06:00 | 1.10450 | 1.10480 | 1.10370 | 1.10400 |
07:00 | 1.10400 | 1.10430 | 1.10270 | 1.10300 |
08:00 | 1.10300 | 1.10330 | 1.10150 | 1.10200 |
09:00 | 1.10200 | 1.10330 | 1.10180 | 1.10300 |
10:00 | 1.10300 | 1.10430 | 1.10270 | 1.10400 |
11:00 | 1.10400 | 1.10480 | 1.10370 | 1.10450 |
12:00 | 1.10450 | 1.10480 | 1.10370 | 1.10400 |
13:00 | 1.10400 | 1.10430 | 1.10320 | 1.10350 |
14:00 | 1.10350 | 1.10380 | 1.10220 | 1.10250 |
15:00 | 1.10250 | 1.10280 | 1.10130 | 1.10180 |
16:00 | 1.10180 | 1.10310 | 1.10160 | 1.10280 |
17:00 | 1.10280 | 1.10380 | 1.10250 | 1.10350 |
18:00 | 1.10350 | 1.10380 | 1.10070 | 1.10100 |
Seed smoothed gain G and loss magnitude L with arithmetic means of the first 5 close changes, available at 06:00: G = 0.0003, L = 0.0005, RSI 37.5. Thereafter use new average = (4 × previous average + new value) / 5 and RSI = 100 − 100 / (1 + G/L). Do not round intermediate values; displayed RSI uses 6 decimals.
6. Trace the two pivots and their confirmation
| Pivot close time | Pivot Bid low | RSI(5) | Known after close |
|---|---|---|---|
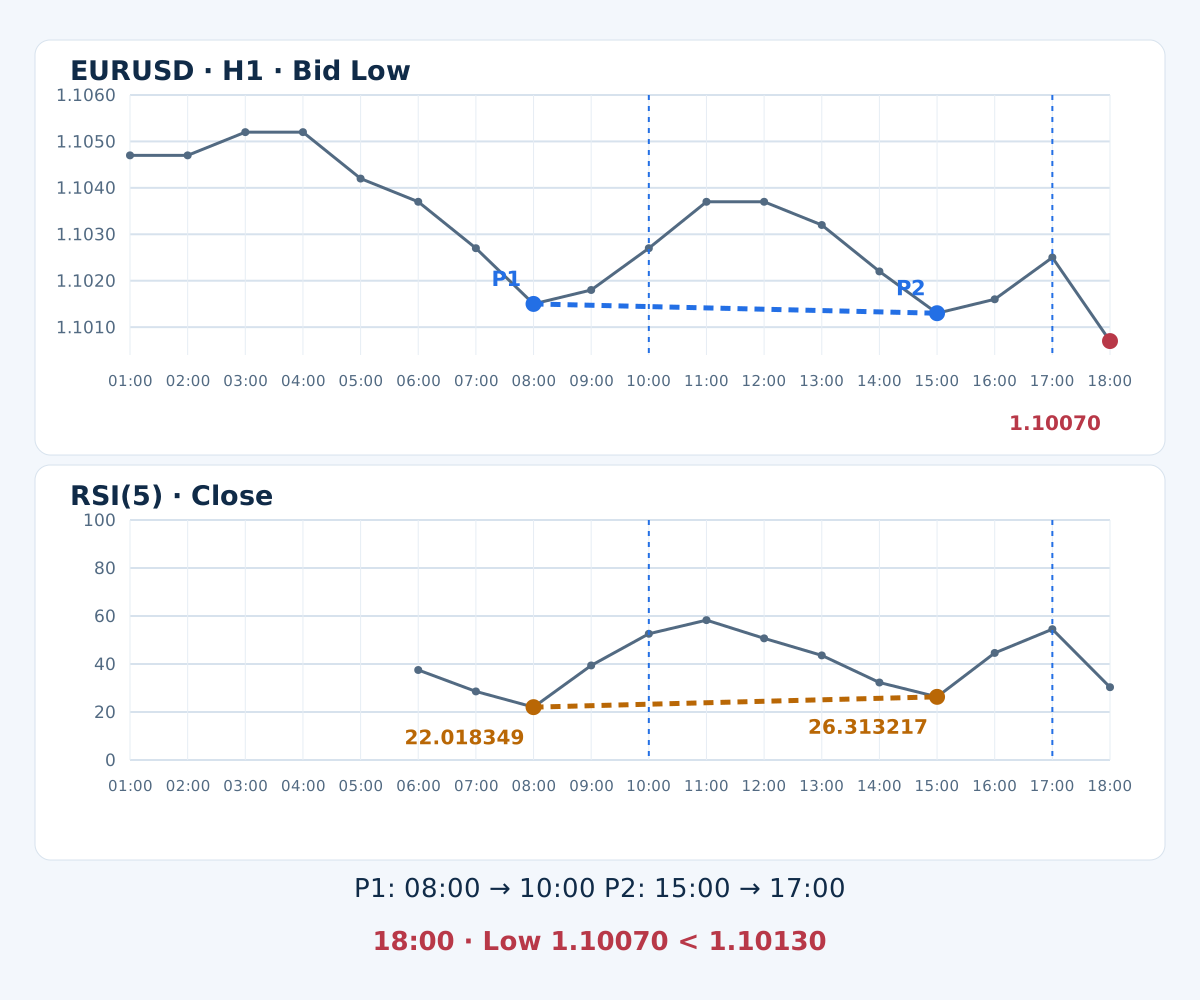
08:00 | 1.10150 | 22.018349 | 10:00 |
15:00 | 1.10130 | 26.313217 | 17:00 |
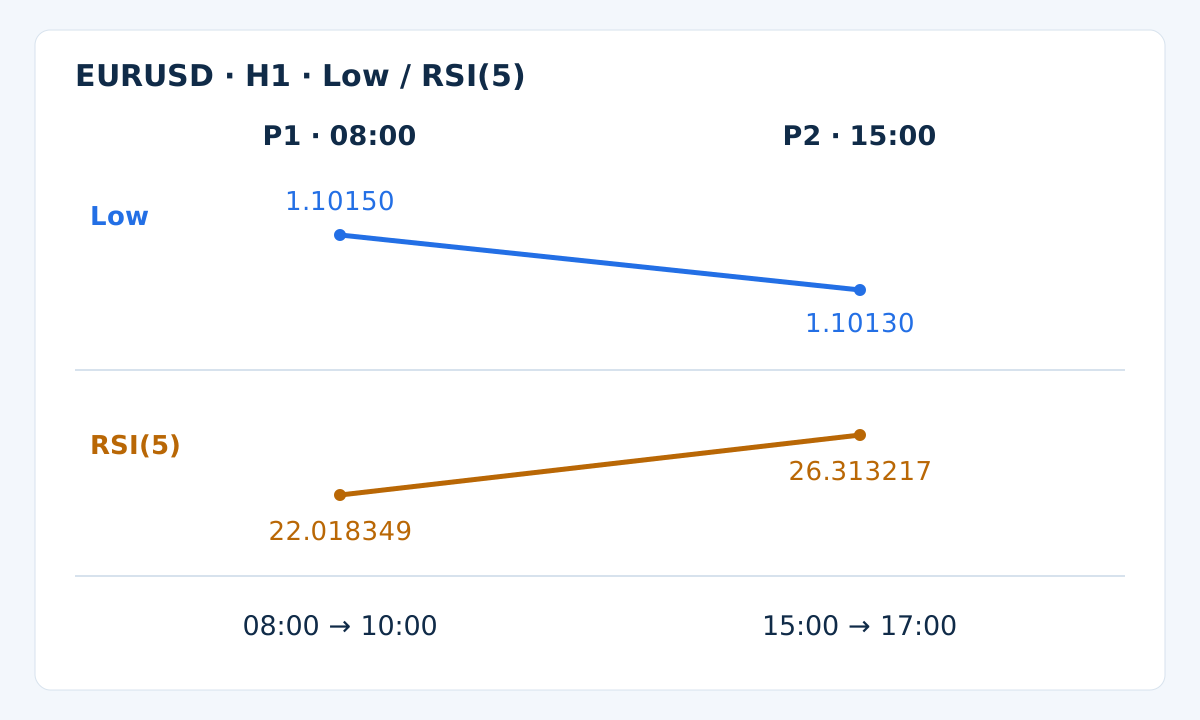
The low falls from 1.10150 to 1.10130, while sampled RSI rises from 22.018349 to 26.313217. These are the consecutive confirmed low pivots under the stated rule. Their relationship meets our regular-bullish definition. It does not require claiming that RSI formed independent local lows on those bars.
At 15:00, the second pivot is still a candidate. The bars closing at 16:00 and 17:00 supply its right-side evidence. The comparison becomes available only after 17:00, with completed data. Placing a tradable signal at 15:00 would import future information.
7. Map confirmation time to MT4 bars
Once the 17:00–18:00 bar starts and data are ready, MT4 shift 0 is forming, shift 1 has just completed, and the pivot closing at 15:00 is at shift 3. The two bars to its right are now complete. This describes that instant; shifts change as new bars arrive.
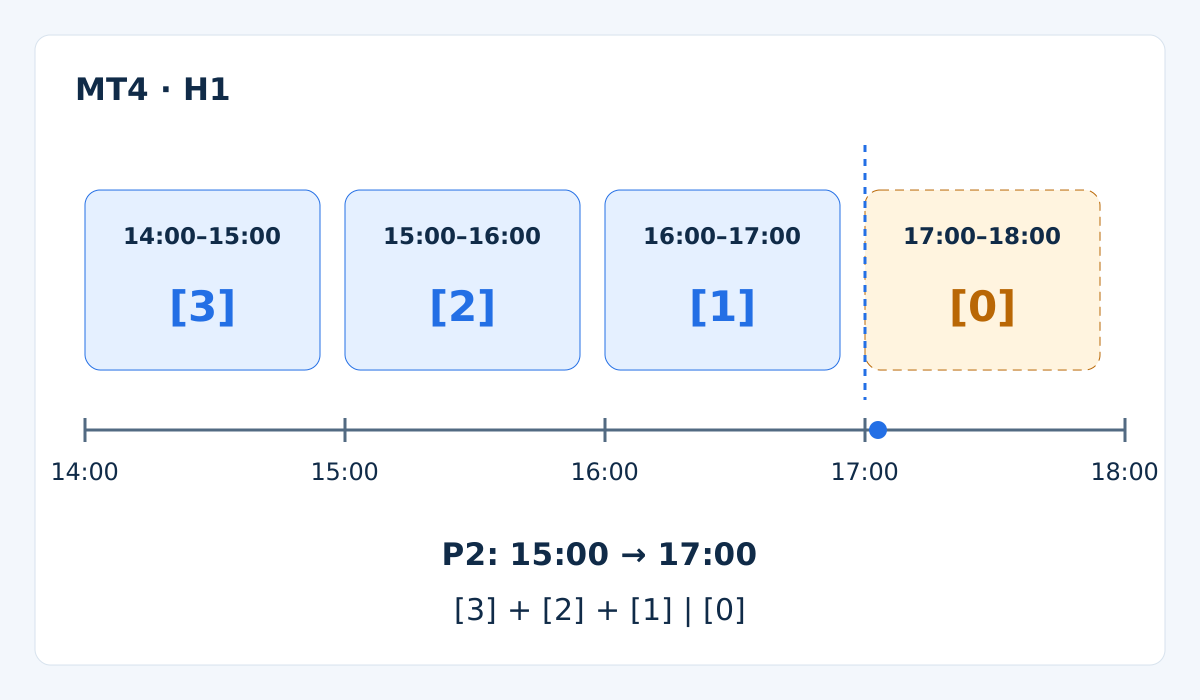
MT4 bar timestamps identify opening times. Our pivot labeled by its 15:00 close belongs to the 14:00–15:00 bar, so its opening timestamp is 14:00. Store both the pivot bar's identity and its confirmation event. Evaluate at the first available update after completion, not an assumed fill exactly on the hour.
8. A confirmed observation can still fail to predict
The next supplied bar, closing at 18:00, has a low of 1.10070, below the second pivot. The earlier bullish comparison remains a valid historical observation, yet it did not prevent a further price low. No entry, exit or profit claim follows from this example.
An unconfirmed candidate may disappear when a right-side bar breaks its extreme. A confirmed pivot under this fixed rule need not move when later bars arrive, assuming unchanged history. A later lower low does not erase it. Record candidate cancellation, observation confirmation and a strategy's separately defined invalidation as different events.
9. Respect the indicator's construction
Stochastic, RSI and ROC need not disagree with price at the same pivots. Keep each formula and smoothing choice fixed. A Stochastic plateau or identical RSI readings do not satisfy a strict inequality. Changing the oscillator or switching from candle lows to closing-price pivots creates another specification.
A strong trend may contain repeated divergence observations before any sustained reversal. Several oscillators share price inputs, so their agreement does not establish independent evidence. Define trend or range context using information available then, and test whether adding that context improves the complete method after costs.
10. Separate the observation from a trading method
A method still needs an entry event after confirmation, expiry, invalidation, protective stop, exits and exposure limits. A Bid-based observation does not promise a buy at Bid; Ask, spread, gaps and slippage affect execution. Apply position sizing and portfolio risk checks separately. The RSI strategy framework illustrates explicit rules; it does not validate this divergence definition.
11. Validate the event sequence, then the outcomes
Replay the data one completed bar at a time. Log candidate timestamp, confirmation timestamp, both price extremes, both indicator readings, pair identity and rejection reason. A restart should reconstruct the same events. For an EA, use stable event identifiers and reconcile order state so repeated ticks or reconnections do not create duplicate entries.
Include equal-price ties, missing indicator values, unconfirmed end-of-sample pivots, repeated signals and continuing trends in the checks. Freeze pivot width, pairing, indicator settings and execution rules before outcome testing. Log all tried variants, retain a later evaluation period and follow controlled MT4 backtesting with forward observation. A chart example establishes neither profitability nor a success rate.
12. A practical divergence checklist
- Specify price extremes, indicator inputs, pivot width, strictness and pairing.
- Distinguish price-aligned indicator samples from independently confirmed oscillator pivots.
- Record when each pivot occurred and when it became knowable.
- Keep cancelled candidates and confirmed observations in separate event states.
- Evaluate the complete execution, exit and risk method using data available at each decision.
13. Questions about momentum divergence
Does divergence guarantee a reversal?
No. It identifies a relationship under selected rules. Price can continue in the same direction, as the synthetic example shows. A tradable reversal and its risk limits require separate definitions and evaluation.
Must RSI itself form a pivot?
Not in this guide's price-aligned convention. We sample RSI on confirmed price-pivot bars. An independent oscillator-pivot method needs explicit matching and timing rules and may produce different observations.
Why wait for the bars to the right?
They are required by the chosen pivot definition. Until they finish, a candidate may fail. Showing a final chart marker at its earlier pivot location does not mean the marker was usable at that earlier time.
Can I choose a more distant pivot?
Only under a rule specified before examining outcomes. This example uses consecutive confirmed pivots. Selecting an older point because it creates a clearer line changes the method and can introduce hindsight bias.
Is hidden divergence stronger than regular divergence?
The labels describe different price–indicator relationships. They do not rank reliability. Any comparison needs consistent settings, context, costs, risk and evaluation data.
Can a divergence indicator repaint?
It depends on its algorithm, candidate display and data revisions. A confirmed strict pivot can remain fixed with unchanged history while an unfinished candidate changes. Check when alerts fire and whether the tool preserves that event history.
14. Check the reference and the chosen convention
The official MetaTrader 4 RSI reference introduces divergence. The strict pivots, price-aligned sampling, pairing and synthetic seed in this guide are explicitly chosen teaching conventions. They are not a platform profitability claim or a reproduction of a live terminal's complete history.
Forex and leveraged trading involve substantial risk. This guide is educational, not investment advice. Past or simulated results do not guarantee future performance.