

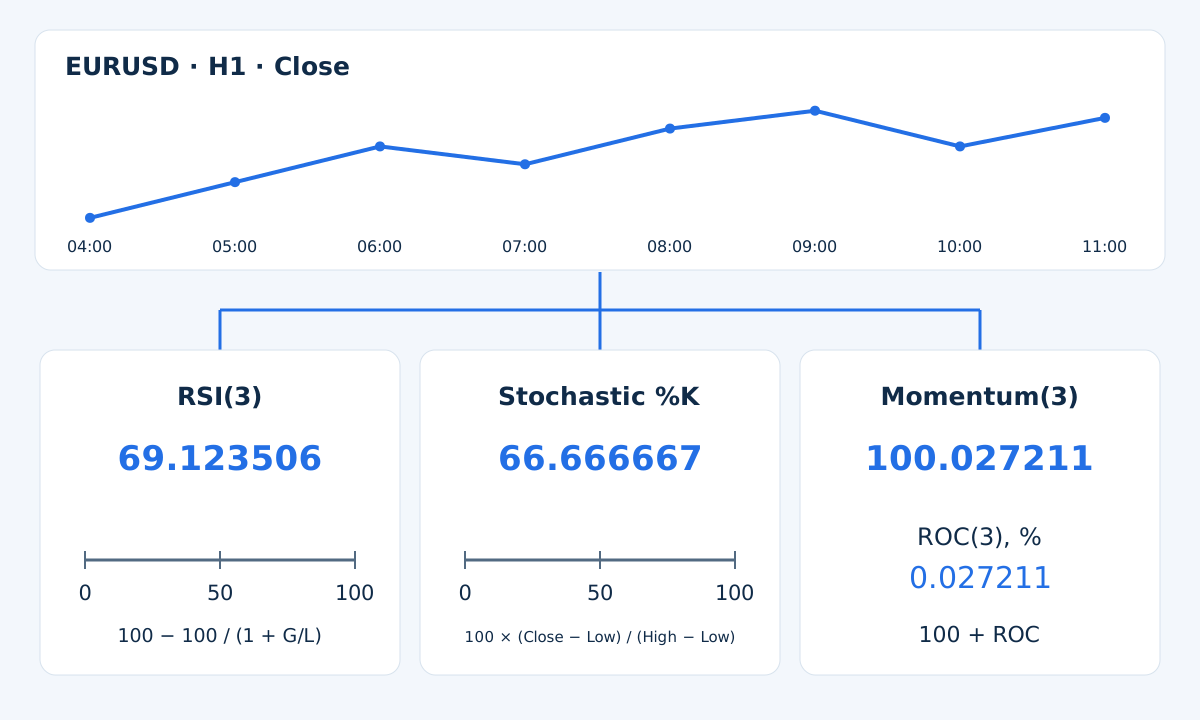
Momentum indicators summarize changes in price, but their scales answer different questions. RSI compares smoothed gains with losses; Stochastic locates the close within a recent range; Momentum and rate of change compare two prices. Understanding those differences comes before treating a reading as confirmation.
1. Momentum, direction and volatility
A rising market can continue rising more slowly. A falling market can rebound while remaining below an earlier reference. Momentum describes a specified comparison or balance of price changes; it does not settle the direction of the next candle. Volatility describes variability or range, which is another question.
Use trend and price context to describe the environment separately. Several oscillators derived from the same candles do not become independent evidence when they agree. Nor is an oscillator value a probability of profit.
2. Read the correct scale and baseline
| Indicator | Measurement | Reference and limitation |
|---|---|---|
| RSI | Balance of smoothed positive and negative close changes. | Bounded from 0 to 100; 50 means equal smoothed gains and losses when defined. |
| Stochastic | Close position inside a rolling high–low range. | Bounded from 0 to 100; 50 is the range midpoint for the unsmoothed reading. |
| Momentum / ROC | Current price relative to a price a fixed number of bars earlier. | The ratio version centers on 100; percentage ROC centers on 0. Neither uses the same fixed range as RSI or Stochastic. |
Scroll tables horizontally on a narrow screen.
3. Momentum and ROC: the rolling anchor matters
For closing prices and lookback n, this guide uses MT4's ratio convention: Momentum = 100 × Close(k) / Close(k−n). Percentage rate of change is ROC = 100 × (Close(k) / Close(k−n) − 1). Therefore Momentum = 100 + ROC. These versions contain the same comparison; using both does not add another source of information.
Some software instead labels a raw price difference “momentum.” Record the formula, not just the name. As the window advances, both the current close and its earlier anchor change. A lower Momentum value can accompany a higher latest close if the anchor rises proportionally more.
4. RSI: gains, losses and initialization
For each close change, keep the positive part as gain and the magnitude of the negative part as loss; the other part is zero. With smoothed averages G and L, RSI = 100 − 100 / (1 + G/L). Here Wilder smoothing uses new average = (previous average × (n−1) + new value) / n.
Our example seeds each average with the arithmetic mean of the first 3 changes. That seed and the available history affect later values. Match feed, applied price, period and initialization before comparing a spreadsheet with a terminal. Do not round intermediate calculations.
With positive gains and zero losses, RSI is 100; with zero gains and positive losses it is 0. When both averages are zero, the ratio formula alone is undefined: check the platform's flat-series convention. A missing or uninitialized reading must not silently become zero.
5. Stochastic: range position and smoothing
For an unsmoothed reading, %K = 100 × (Close − LowestLow) / (HighestHigh − LowestLow), using the selected window including the observed bar. A close near the window's high produces a high reading even if the absolute price move is small.
The example uses a 3-bar high–low window, slowing 1, and %D = SMA(3) of %K. This makes the arithmetic visible; it is not a recommended setting. Record the price field, slowing and smoothing method in a real test. Different smoothing choices need not match this example.
If the window's highest high equals its lowest low, the denominator is zero. Follow a documented platform convention or mark the reading unavailable. Do not invent a crossing from a missing value. The Stochastic strategy treats observation and trading rules separately.
6. An extreme is not a reversal
Common reference bands are 70/30 for RSI and 80/20 for Stochastic. They describe chosen regions of an indicator's scale, not guaranteed turning points. Sustained directional movement can keep an oscillator elevated or depressed while price continues in the same direction.
Define whether you are investigating continuation, a pullback or reversal. Each needs its own price event, invalidation and evaluation. “Overbought” alone supplies none of those. The RSI strategy framework provides a separate example of explicit rules; its existence does not validate every RSI signal.
7. Synthetic H1 inputs you can reproduce
The following EURUSD Bid bars are invented teaching data, labeled by closing time on one assumed server clock. All periods are 3, except Stochastic slowing 1. Prices, clocks and parameters are illustrative. No trade, fill, account return or backtest is shown.
| H1 close time | Bid high | Bid low | Bid close |
|---|---|---|---|
04:00 | 1.10040 | 1.09960 | 1.10000 |
05:00 | 1.10140 | 1.09990 | 1.10100 |
06:00 | 1.10230 | 1.10080 | 1.10200 |
07:00 | 1.10220 | 1.10110 | 1.10150 |
08:00 | 1.10290 | 1.10120 | 1.10250 |
09:00 | 1.10340 | 1.10220 | 1.10300 |
10:00 | 1.10310 | 1.10160 | 1.10200 |
11:00 | 1.10300 | 1.10180 | 1.10280 |
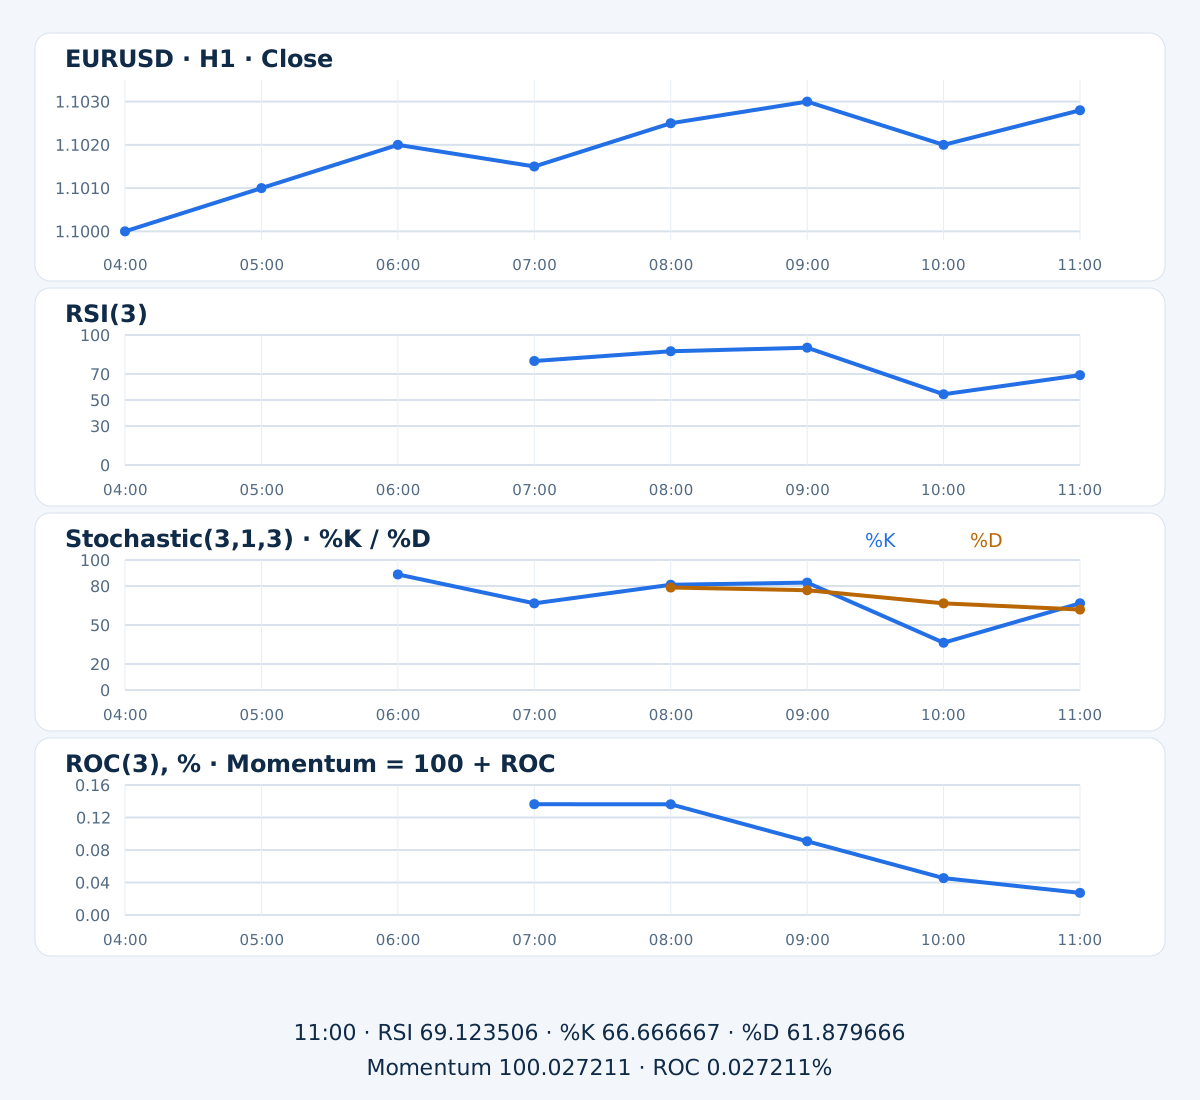
The first RSI seed is available at 07:00: mean gain 0.0006666667 and mean loss 0.0001666667, rounded here, give RSI 80. The first raw Stochastic reading is available at 06:00; its first complete signal average at 08:00. Momentum first has its earlier anchor at 07:00.
8. Read the apparent disagreement correctly
| Observation | 10:00 | 11:00 |
|---|---|---|
| RSI(3) | 54.411765 | 69.123506 |
| Stochastic %K | 36.363636 | 66.666667 |
| Stochastic %D | 66.641571 | 61.879666 |
| Momentum(3) | 100.045393 | 100.027211 |
| ROC(3), % | 0.045393 | 0.027211 |
Values are rounded to 6 decimal places after calculation. At 11:00, RSI rises and Stochastic's main line crosses above its signal. Yet Momentum falls while remaining above 100. Its anchor moves from the 07:00 close of 1.10150 to the 08:00 close of 1.10250. The measurements are answering different questions.
The latest 3-bar price difference is 0.00030, or 3 EURUSD pips under the conventional 0.00010 pip definition. ROC of 0.027211% is a relative price change, not pips or an account return. The example establishes arithmetic only; no combination has earned a trading edge here.
9. Use values available at the decision time
A forming candle changes with incoming prices, so its oscillator can cross a level and cross back. In MT4 timeseries, shift 0 is the current bar and shift 1 is the latest completed bar once the next starts and data are ready. Here the observation labeled 11:00 becomes usable after that close, not at the start of its hour.
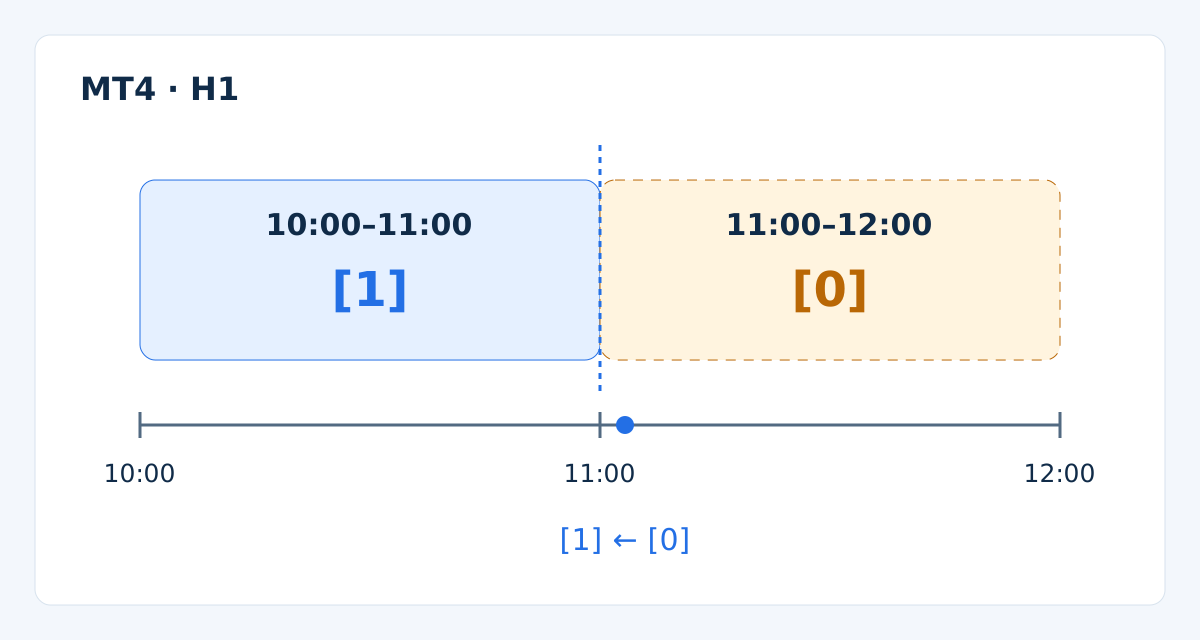
Platform timestamps commonly identify bar opening times; the teaching table uses closing times. Map them explicitly. At a past decision, use the bars and higher-timeframe values completed then. Do not reuse today's shift or a completed future candle in a historical signal.
10. Separate states, crossings and divergence
“RSI above its midpoint” is a state. “RSI crosses above its midpoint on the latest completed bar” additionally requires a previous value at or below that level. Define strict or inclusive comparisons and how missing inputs are handled. A failed long condition does not create a short signal.
Divergence compares selected price swings with selected indicator swings. A pivot needing candles to its right is confirmed only after those candles complete. Record both the pivot's location and when it became knowable. A line drawn later between attractive peaks is not a timely signal by itself.
11. Turn an observation into a testable method
Choose the context, event, expiry, entry quote, invalidation, protective stop and exit before evaluating outcomes. A Bid-close signal does not promise an entry at that price: a buy uses Ask, and available quotes, spreads, gaps and execution affect the result. Apply position sizing and portfolio risk limits separately.
Freeze settings and compare variants on the same feed, costs and risk assumptions. Record every tried variant and preserve a later evaluation period. A new threshold chosen after viewing its results needs fresh evaluation. Follow the MT4 backtesting guide, then monitor new incoming data; a historical holdout and demo forward observation answer different questions.
For an EA, verify indicator readiness, one decision per event, order ownership and reconciliation after rejected requests or reconnections. Agreement among indicators cannot override missing data, an invalid stop or excessive exposure. The guide to combining indicators explains distinct roles and mandatory checks.
12. A compact reading checklist
- Record symbol, feed, timeframe, formula, applied price, periods, smoothing and initialization.
- Identify the correct baseline and distinguish a bounded oscillator from a price ratio.
- Verify completed-bar availability, warm-up and zero-denominator handling.
- Name the observation precisely: state, fresh crossing or confirmed swing comparison.
- Check context, execution, costs, risk and the method's separate evaluation before considering an order.
13. Questions about momentum indicators
Which momentum indicator is best?
There is no universal winner. Select the measurement your question requires, then evaluate the complete method. A shorter delay, extra crossing or attractive historical chart does not establish better net results.
Is Stochastic a measure of price speed?
Its raw reading measures close position in a rolling high–low range. It can change sharply when the range changes, even without a large absolute price move. Smoothing changes that reading further.
Does high RSI mean price must fall?
No. It indicates the stated balance of smoothed gains and losses. Price can continue rising while RSI stays high. A reversal requires its own observable rule and risk specification.
Why do two platforms show different readings?
Check feed, candle boundaries, applied price, period, smoothing, seed, history length and forming versus completed bars. Compare exported inputs before assuming a software defect.
Do Momentum and ROC provide two confirmations?
Not under the formulas used here. One is simply the other plus its baseline offset. Different labels do not create independent information.
Can I enter whenever the indicators agree?
Agreement describes readings, not a complete trading method. You still need predefined execution and exit rules, acceptable costs and exposure, and evidence from controlled testing and forward observation.
14. Check the platform definition
The official MetaTrader 4 indicator reference provides the platform definitions for Momentum, RSI and Stochastic. The synthetic calculations here specify their own short periods and seed so that they can be reproduced; they do not claim to reproduce a live terminal's full history.
Forex and leveraged trading involve substantial risk. This guide is educational, not investment advice. Past or simulated results do not guarantee future performance.