

TRIX follows the change in a price series smoothed three times. Its zero line and signal line answer different questions. This guide traces the calculation on actual USD/JPY quotes, including a signal crossover while TRIX remains negative and the later move above zero.
1. What TRIX measures
TRIX is the one-period percentage change of an EMA smoothed three times. Here all three stages use N completed closing prices per seed and the same smoothing constant. TRIX above zero means the third EMA has risen from its previous value. It does not require the latest candle to close above its open.
2. Which prices and candle clock are used
The examples use Forexite USD/JPY minute quote records from January–February 2024. Winter CET is converted to UTC. Record timestamps in (end − 4 hours, end] form each group. Groups end at 00:00, 04:00, 08:00, 12:00, 16:00 and 20:00 UTC. These declared groups can differ from broker-native H4 candles; missing prices are not filled.
3. First EMA: weight and starting value
For N = 15, α = 2/(N+1) = 0.125. EMA1 begins with the arithmetic mean of the first 15 closes. Each later value is the previous EMA plus α times the difference between the current close and that EMA. Calculations retain full precision; the source price precision is two decimals.
α = 2/(N+1)
EMA1[t] = EMA1[t−1] + α × (C[t] − EMA1[t−1])
EMA2[t] = EMA2[t−1] + α × (EMA1[t] − EMA2[t−1])
EMA3[t] = EMA3[t−1] + α × (EMA2[t] − EMA3[t−1])
TRIX[t] = 100 × (EMA3[t]/EMA3[t−1] − 1)
Signal[t] = Signal[t−1] + (2/10) × (TRIX[t] − Signal[t−1])
Histogram[t] = TRIX[t] − Signal[t]
4. Second and third EMA: the warm-up grows
Apply the same procedure to EMA1 to obtain EMA2, then to EMA2 to obtain EMA3. Each stage starts from the mean of its first 15 available inputs. With zero-based indexing, the first values occur at 14, 28 and 42. These are consecutive observed groups, not consecutive wall-clock periods through market closures.
5. One-period percentage change and its units
TRIX[t] = 100 × (EMA3[t]/EMA3[t−1] − 1). Two available EMA3 values are needed, so the first TRIX(15) is at index 43, on the 44th group. A value of 0.01 means a 0.01% change in EMA3 over one group. It is neither 0.01 pip nor an account return. USD/JPY prices are positive; a zero denominator would leave the ratio undefined.
6. A worked calculation from real USD/JPY quotes
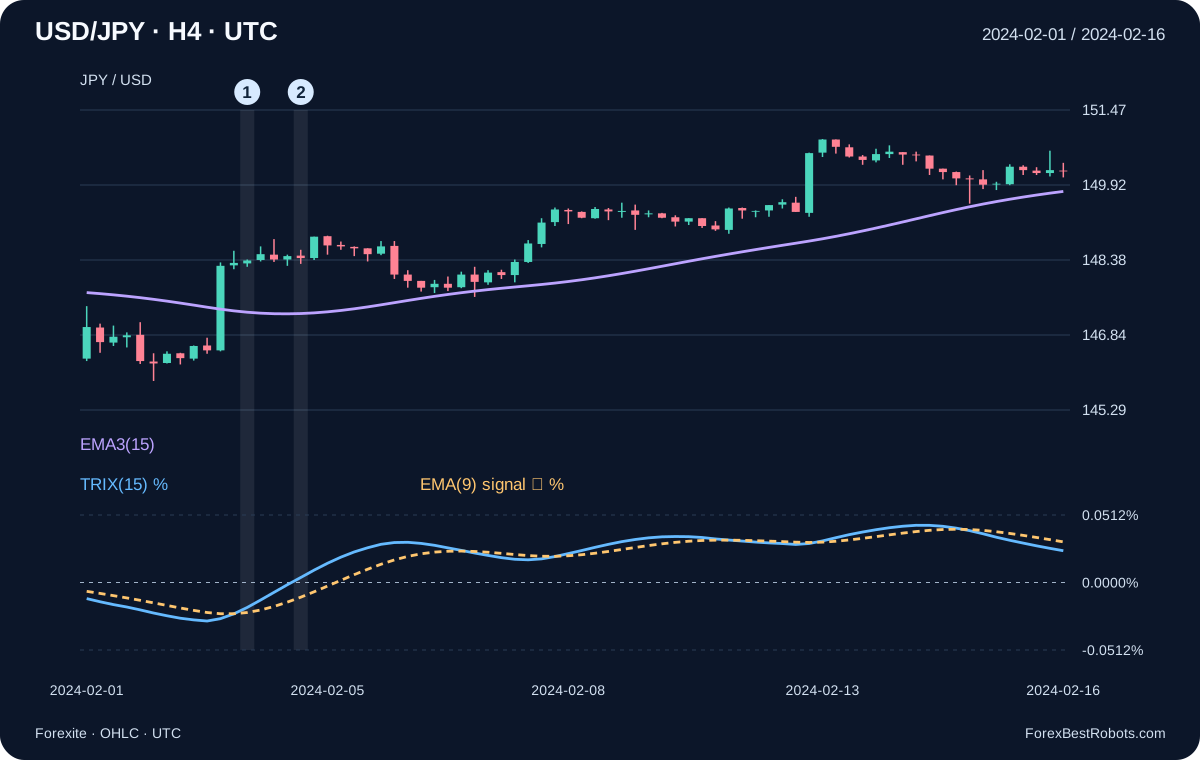
At the group ending 2024-02-05 at 12:00 UTC, the close is 148.42. EMA3 rises from 147.272107 to 147.277693. Using the unrounded values gives TRIX(15) = 0.003793%. The EMA(9) signal is −0.011143%; the difference is +0.014936 percentage points. Rounded intermediate values are for reading, not for recalculation.
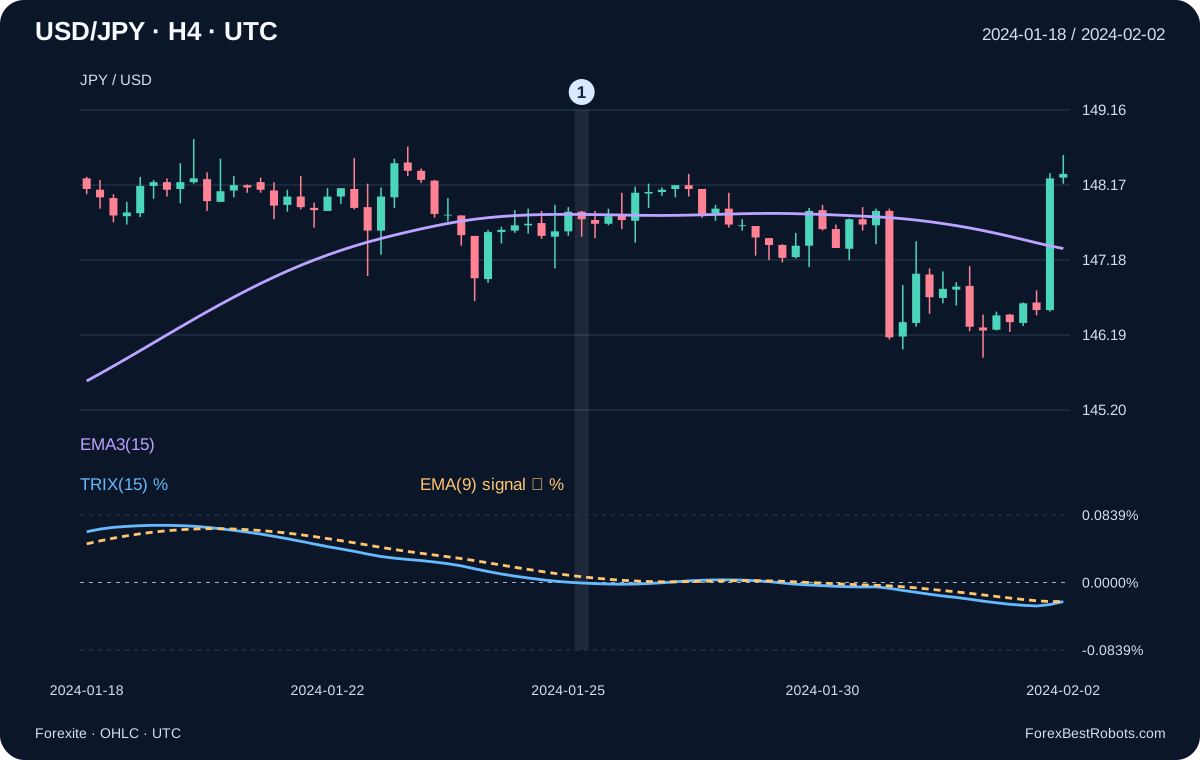
The January chart also shows a downward zero crossing at 2024-01-26 00:00 UTC. The close is 147.72 and TRIX is about −0.000600%. Its small size does not erase the sign; display rounding must not decide whether a crossing occurred.
7. Reading the zero line without confusing price direction
Positive TRIX describes a rising EMA3; negative TRIX describes a falling EMA3. A rising but still negative TRIX means that the decline in EMA3 is becoming smaller. That is different from EMA3 already rising. Smoothing can keep TRIX positive while price pulls back, or negative during a price rebound.
8. The EMA(9) signal and the histogram
This guide seeds the signal with the mean of the first nine valid TRIX values, then uses α = 2/10. For TRIX(15), the first signal is at index 51. The histogram is TRIX minus signal, measured in percentage points. A positive histogram says TRIX is above its signal, even when both are below zero.
9. A signal crossover before the zero crossover
At 2024-02-03 00:00 UTC, TRIX is −0.018925% and its signal is −0.022745%. Their difference has just turned positive, yet TRIX remains negative. At 2024-02-05 12:00 UTC, TRIX moves above zero. The February chart separates these observations; the first is not a claim that the trade would have been profitable.
10. Fresh crosses, equality and missing values
An upward zero cross requires previous TRIX ≤ 0 and current TRIX > 0. An upward signal cross requires the previous difference ≤ 0 and the current difference > 0. Reverse the inequalities for downward crosses. Compare unrounded values. If either required value is unavailable, no fresh cross is established; the first valid reading alone is insufficient.
11. Comparing periods 9, 15 and 30 fairly
The viewer offers N = 9, 15 or 30 with signal length fixed at 9. Shorter smoothing responds more quickly to recent input; it also permits more short-lived reversals. Longer smoothing needs more history. The first TRIX values are at indices 25, 43 and 88; the first signals are at 33, 51 and 96. Compare only dates available to every setting, using the same source and starting history.
12. Inspect each historical TRIX calculation
Select a smoothing period and move through the actual completed groups. Values and candles stop at the selected time. N changes all three EMA stages; the signal remains EMA(9).
- Group end (UTC)
- —
- Open
- —
- High
- —
- Low
- —
- Close
- —
- First EMA
- —
- Second EMA
- —
- Third EMA
- —
- Previous third EMA
- —
- TRIX (%)
- —
- EMA(9) signal (%)
- —
- TRIX − signal (percentage points)
- —
- Source minute records in this group
- —
- Calculation history starts (UTC)
- —
Calculation
Historical quote observations only. A crossover is not an executed order or a measured profit.
13. Why the visible chart is not all the history
The charts and viewer calculate from the beginning of the declared dataset, then show a shorter interval. They do not restart the EMA at the left edge of each chart. Changing the starting date or seed can alter values after the warm-up. Being mathematically available is not proof that initialization has become negligible; compare longer histories when exact platform agreement matters.
14. Completed candles and changes during a live candle
The examples use completed historical groups. On a live platform, the current close can change before the candle finishes, so TRIX and a tentative cross can change too. Confirming a completed-candle reading avoids that particular ambiguity. The calculation uses no later prices; adding future groups cannot alter its earlier outputs under the same data and convention.
15. TRIX is not TEMA: checking platform differences
TRIX is a rate calculated from EMA3. TEMA is a price overlay formed as 3×EMA1 − 3×EMA2 + EMA3. They are different outputs. To compare TRIX platforms, check the input price, time zone, N, all seeds, earlier history, percentage multiplier and signal type. A fractional rate without ×100 will be 100 times smaller. No platform match is implied without these checks.
16. A reading checklist and the limits of this guide
Identify the candle close, TRIX sign, its change and its relationship to the signal separately. Check whether the crossing is fresh and whether the reading has enough history. Then assess the price structure. These charts demonstrate calculations, not an order system: no trades, win rate or net return are simulated. A tradable strategy still needs entry, exit and sizing rules, plus spread, commission, slippage, gaps and out-of-sample evaluation.
Frequently asked questions
Does positive TRIX mean the last candle rose?
It means the triple-smoothed EMA rose from its previous value. The last candle can have another direction.
Why is the signal available later than TRIX?
EMA(9) needs nine valid TRIX inputs for its declared SMA seed. For N = 15, TRIX first appears at index 43 and the signal at 51.
Is TRIX the same indicator as TEMA?
No. TRIX is a one-period percentage change of EMA3. TEMA combines the three EMA stages into a price overlay.
Does a zero cross establish a profitable trade?
No. It describes a change in the direction of EMA3. Trade rules, execution costs and separate validation are needed to assess a strategy.
Data, timing and reproducibility
Source: 60 Forexite daily MetaStock archives for January–February 2024. Winter CET timestamps are converted to UTC by subtracting one hour. H4 groups use published minute-record timestamps in (end − 4 hours, end]. The first open, maximum high, minimum low and last close define each group.
No missing prices or weekend candles are filled. The final group cut by the download interval is omitted; short opening or closing groups remain, with minute counts in the CSV. Published two-decimal USD/JPY quotes are retained. No Ask, spread, intraminute path or executable fill is inferred.
The extracted source contains 61,972 minute records and produces 266 H4 groups. With N = 15 there are 223 TRIX readings and 215 signal readings. The download includes the used minute rows, source URLs and original archive hashes, the declared calculation and offline verification code.