

Kaufman’s Adaptive Moving Average changes its update weight as the closing-price path becomes more or less direct. A strong reading can accompany a falling market. A flat-looking line can still sit far from price. The GBP/USD examples below show what adapts, what remains delayed and why the starting history matters.
1. What KAMA changes
KAMA, developed by Perry Kaufman, uses an Efficiency Ratio (ER) to adjust the weight of the next closing-price update. It measures how direct the recent path was. A large net move relative to the sum of the individual moves produces a higher ER; a winding path produces a lower one.
ER uses absolute distances. It is not bullish or bearish, a probability of success or an ATR substitute. A steady decline can have a high ER. Read direction from price and the line’s slope; read the update speed from the final smoothing factor.
2. The calculation: 10, 2 and 30 have different jobs
Here C is the completed close and N is the ER lookback. N = 10 uses 11 closes to measure 10 close-to-close changes. Divide the absolute endpoint change by the sum of those absolute changes. For a nonzero path, ER lies between 0 and 1. If every change is zero, the written ratio is 0/0; this guide explicitly assigns ER = 0.
Fast = 2 and slow = 30 define constants F = 2/3 and S = 2/31. Blend them using ER, then square the result to obtain SC. Finally move the previous KAMA toward the new close by that fraction. Retain full precision until display. The first updated KAMA needs a prior state as well as the ER window.
Change[t] = |C[t] − C[t−N]|
Path[t] = Σ |C[j] − C[j−1]|, j = t−N+1 … t
ER[t] = Change[t] / Path[t]  (Path = 0 → ER = 0)
F = 2 / (2+1);  S = 2 / (30+1)
SC[t] = [ER[t] × (F − S) + S]²
KAMA[t] = KAMA[t−1] + SC[t] × (C[t] − KAMA[t−1])
3. A real decline with high efficiency
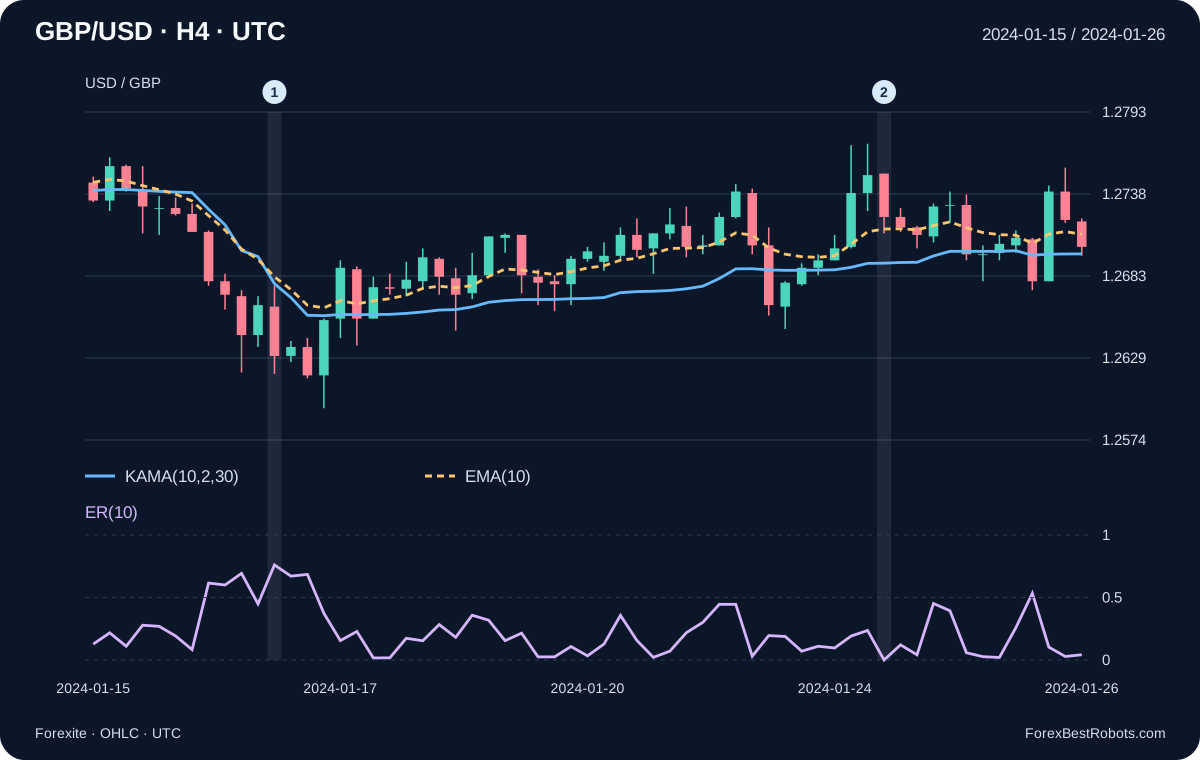
At the GBP/USD group ending 2024-01-16 at 20:00 UTC, the close is 1.2630. Over 10 changes, the absolute net move is 0.0127 and the path length is 0.0167. ER is about 0.760479 and SC about 0.272943. KAMA moves from 1.269650 to 1.267835: the relatively high efficiency accompanies a downward move.
Marker 2 shows a different case on 2024-01-24 at 20:00 UTC. The current close and the close 10 groups earlier are both 1.2723, but the intervening path totals 0.0208. ER is zero despite substantial movement within the window. KAMA still moves slightly because SC is positive and the close differs from the previous KAMA.
4. Why KAMA is not always faster than EMA
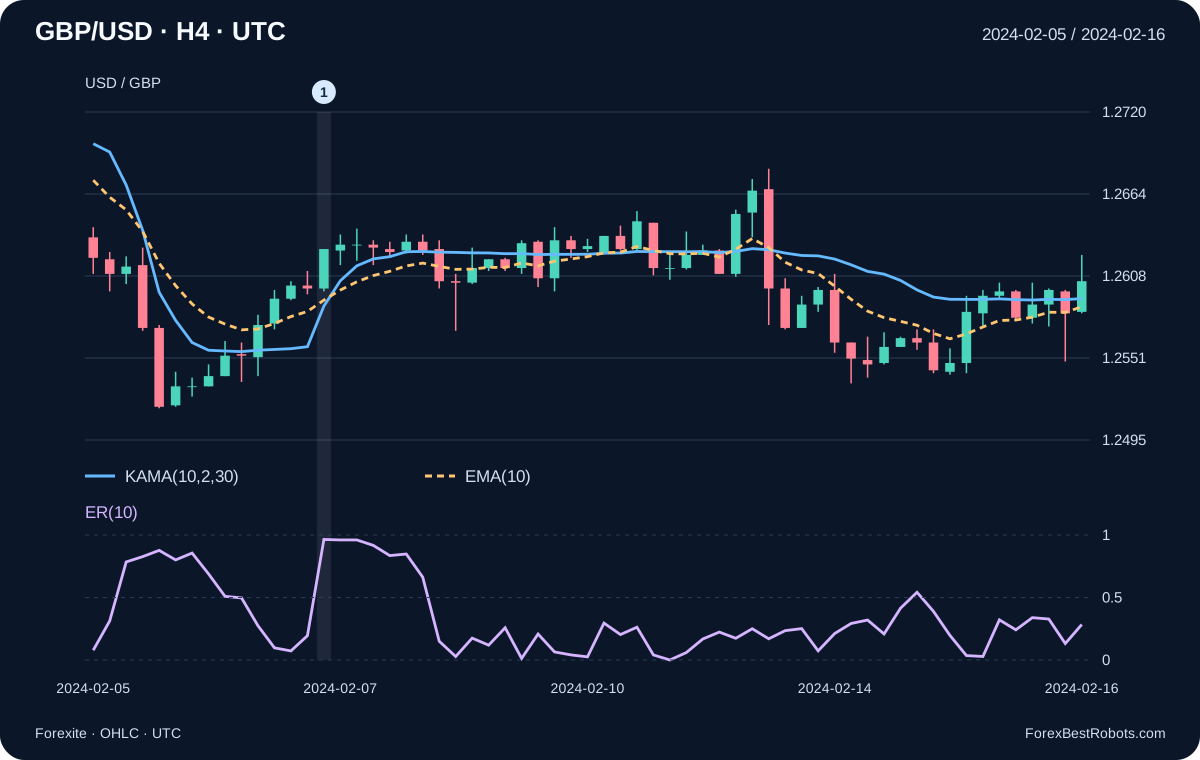
For fast 2 and slow 30, the final weight ranges from about 0.004162 at ER = 0 to 0.444444 at ER = 1. At ER = 0.5 it is about 0.133657. EMA(10) uses a fixed weight of 2/11, about 0.181818. Therefore KAMA’s update weight can be smaller or larger than EMA(10)’s on the same candle.
This compares weights, not trading performance or guaranteed distance from price: the two averages carry different prior states. The second chart includes a relatively direct rebound on 2024-02-07. Neither the shape of that interval nor a close above KAMA establishes a profitable entry rule. All chart windows were selected for explanation.
5. Lookback, initialization and platform differences
The viewer changes N between 10, 20 and 30 while holding fast 2 and slow 30 fixed. A longer N changes the measured path; it does not simply make every update slower. For each setting, the seed is the mean of the first N closes, placed at index N − 1. The first ER and recursive update appear at index N.
Every later value uses the complete earlier sequence in this dataset. Showing only the latest 50 candles does not restart KAMA. Another seed, a different flat-path rule or additional earlier history can change the line. Our SMA seed and ER = 0 convention are explicit choices; they are not a claim of exact agreement with every platform or TA-Lib.
6. Inspect each historical update
Choose an ER lookback and a completed group. The chart shows up to 50 groups ending at your selection. KAMA uses all earlier closes in the supplied history, not just the visible chart. EMA(10) remains unchanged when N changes.
- Completed group ending (UTC)
- —
- Open
- —
- High
- —
- Low
- —
- Close
- —
- Absolute net change
- —
- Sum of absolute changes
- —
- Efficiency Ratio (ER)
- —
- Squared smoothing factor (SC)
- —
- Previous KAMA
- —
- Current KAMA
- —
- EMA(10)
- —
- Source minute records in this group
- —
- Calculation history starts (UTC)
- —
- ER window
- —
Calculation
Historical quote observations only. The selected group is the last data used in its calculation.
7. A useful chart-reading routine
Start with the latest completed group. Check price relative to KAMA, the change in KAMA and the ER/SC values together. A close above a falling KAMA is a mixed observation; a high ER alone says nothing about upward direction. A forming candle can change both the ratio and the line before completion.
For a fresh upward price cross, one possible observation is C[t] > KAMA[t] and C[t−1] ≤ KAMA[t−1], with two valid completed readings. That defines an event, not a complete strategy. Repeatedly remaining above the line is a state, not a new crossover on every candle.
8. What these examples cannot establish
A trading test still needs entry timing, invalidation, stops, exits, position sizing and rules for overlapping signals. Freeze those decisions before examining a separate evaluation period. KAMA does not supply a stop distance or remove gap risk, and a smoother line does not demonstrate a trading edge.
These quote records contain no Ask series, spread, commission or slippage. No trades or returns are simulated. OHLC alone also does not reveal whether an intrabar high or low came first. Suitable execution data and explicit cost assumptions are needed before drawing conclusions about net results.
Frequently asked questions
Does a high ER mean the market is rising?
No. ER measures absolute net change relative to path length. An efficient decline can produce the same ER as an efficient rise.
Does fast 2 make KAMA identical to EMA(2)?
No. The blended constant is squared. Even at ER = 1, the final weight is 4/9, rather than the EMA(2) weight of 2/3.
Why does my platform show another KAMA value?
Compare the price source, candle boundaries, N/fast/slow settings, initialization, earlier history and zero-path convention. This guide declares an SMA seed and ER = 0 when the path is zero.
Is this a profitable KAMA strategy?
This is an indicator guide with real historical calculations. No orders, win rate or net returns are claimed. A strategy needs separate rules and evaluation.
Data, timing and reproducibility
Source: Forexite daily MetaStock archives for January–February 2024. Winter CET timestamps are converted to UTC by subtracting one hour. Published minute-record timestamps are grouped into (end − 4 hours, end], with ends at 00:00, 04:00, 08:00, 12:00, 16:00 and 20:00 UTC. This declared grouping may differ from a broker’s native H4 candles.
Each group uses its first open, maximum high, minimum low and last close. No missing prices or weekend candles are filled. The final group cut by the downloaded interval is omitted; shorter opening/closing groups remain, with their minute counts in the CSV. The published four-decimal quote precision is retained; no Ask or spread is inferred.
The dataset contains 61,972 minute records, 266 H4 groups and 256 valid KAMA(10,2,30) updates after the seed. The download contains the used minute rows, source archive URLs and hashes, the declared calculation and offline replay code. Reproducing an indicator is separate from validating a profitable strategy.