

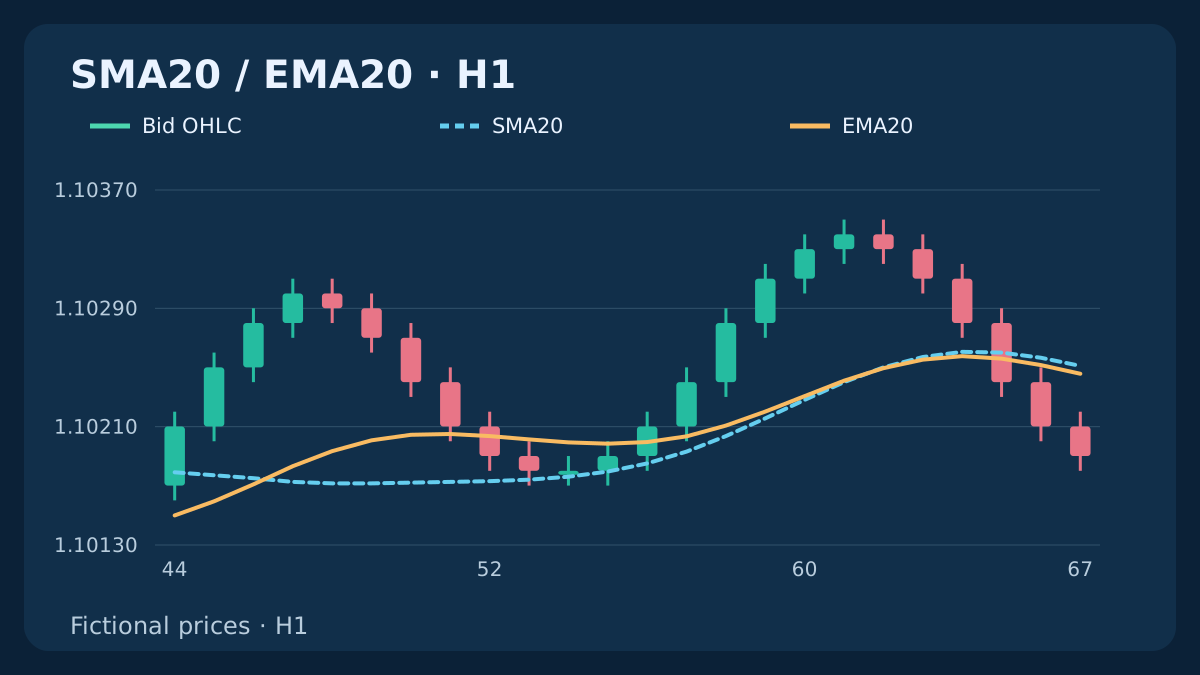
An EMA gives more weight to the latest close, but that does not make every crossover a new price breakout. Separate the calculation, its initialization and the event you are observing before considering trading costs.
1. Choose the price series first
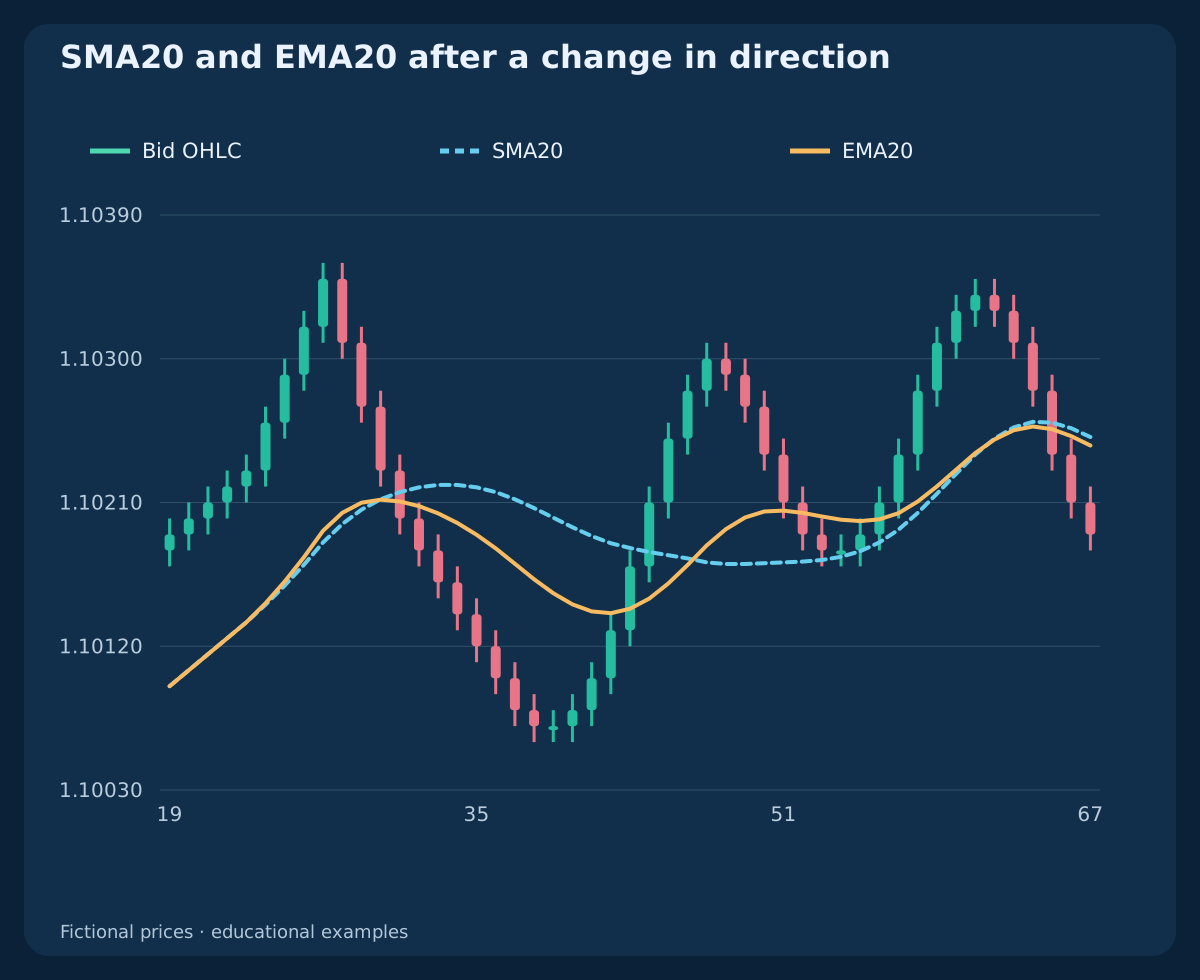
Use fictional EURUSD H1 Bid OHLC with 1 pip=0.0001 and a 0.00001 price grid. All averages use completed Bid closes. Six separate histories each contain 68 bars; they are constructed examples, not market observations.
The first bar opens at 2026-10-19 00:00 UTC and closes one hour later. Open equals the preceding Close, except the first Open equals its Close. High is one pip above the larger of Open and Close; Low is one pip below the smaller. These candles do not supply executable Ask quotes.
2. Calculate the rolling SMA
Use SMA_n(t)=ΣClose(t−j)/n; j=0…n−1. Each included close has equal weight and every earlier close has zero weight. Period counts bars, so changing timeframe changes the observation horizon.
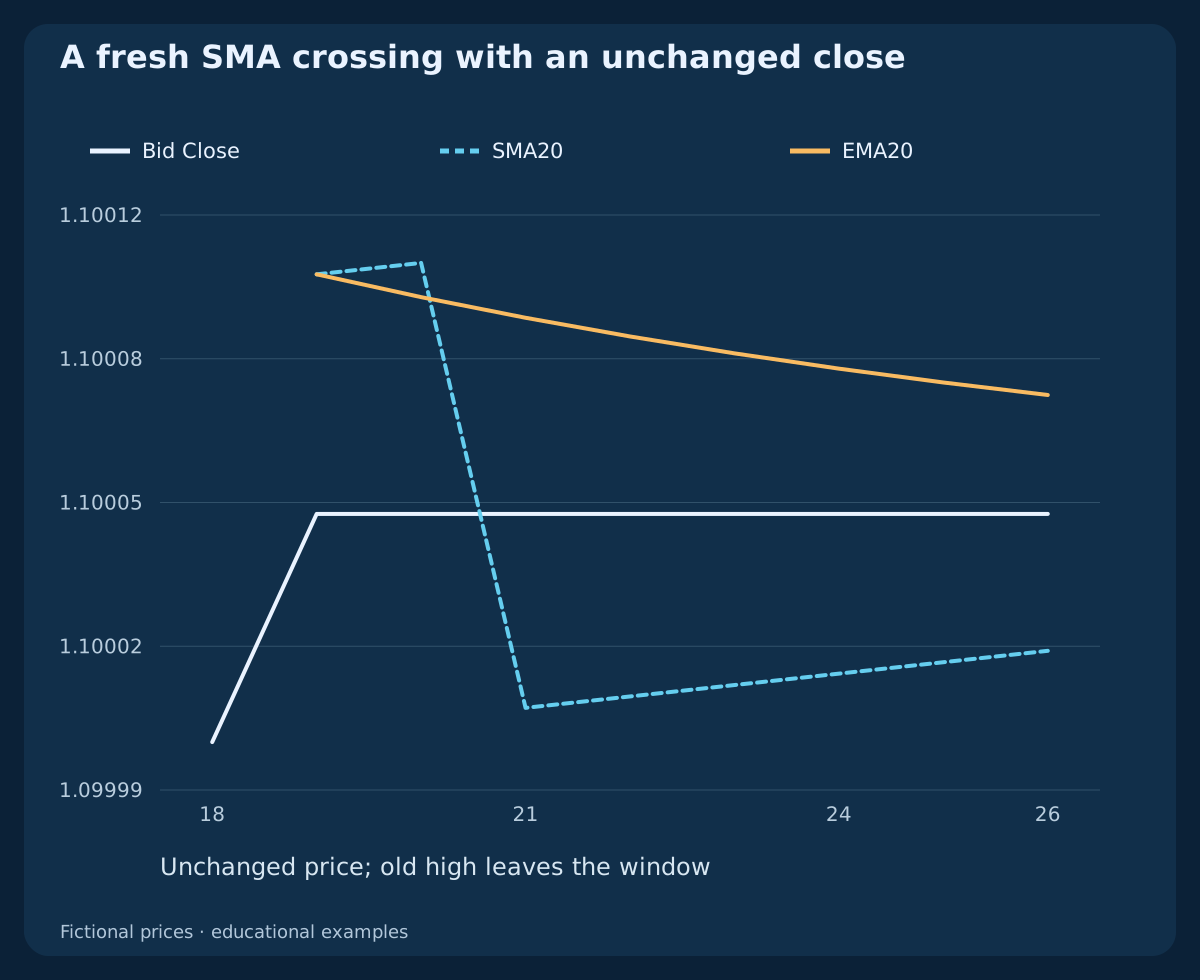
SMA20 first exists at k19. Its next change is SMA20(t)−SMA20(t−1)=[Close(t)−Close(t−20)]/20. This compares the entering and departing closes; it does not require the latest price to differ from the preceding close.
3. Declare the EMA initialization
Use α=2/(n+1); d=1−α and EMA_n(t)=αClose(t)+dEMA_n(t−1). Our reference starts from the mean of the first n closes at k=n−1. Earlier reference values are unavailable.
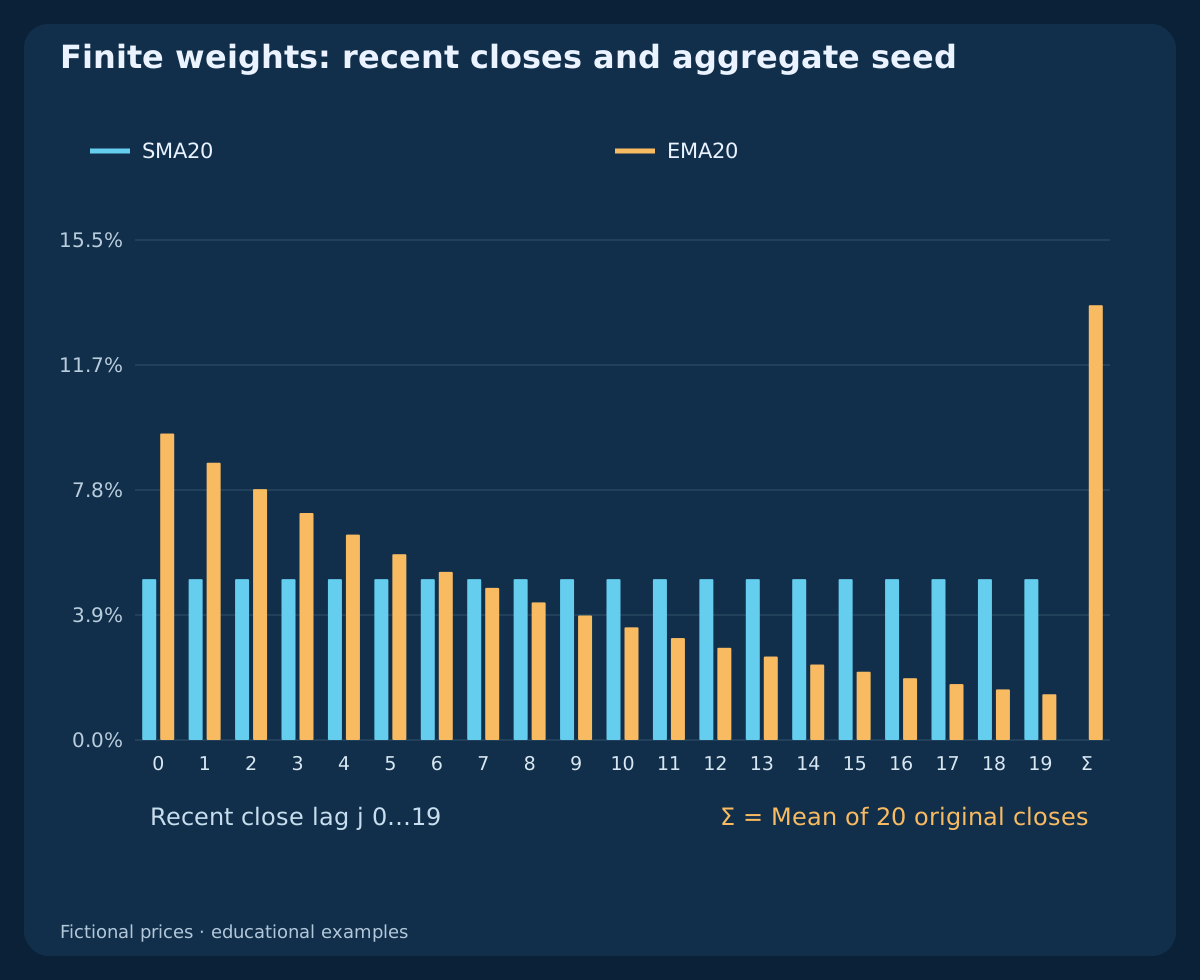
EMA20 assigns the latest close 2/21≈9.5238095%, versus 1/20=5% in SMA20. It retains older information recursively; it is not a twenty-bar rolling window. Compare actual history and initialization before claiming numerical parity with a terminal.
4. Separate individual weights and the seed
At k39, twenty updates have followed the EMA20 seed. Recent individual weights are αd^j; j=0…19; the remaining weight d^20 belongs to the seed mean. Together they sum to one.
The final weight column represents the mean of 20 original closes, now at lags 20…39. It is not one old close. Each original close contributes one twentieth of that aggregate. SMA20 gives weight only to the twenty recent closes.
5. Require two available observations
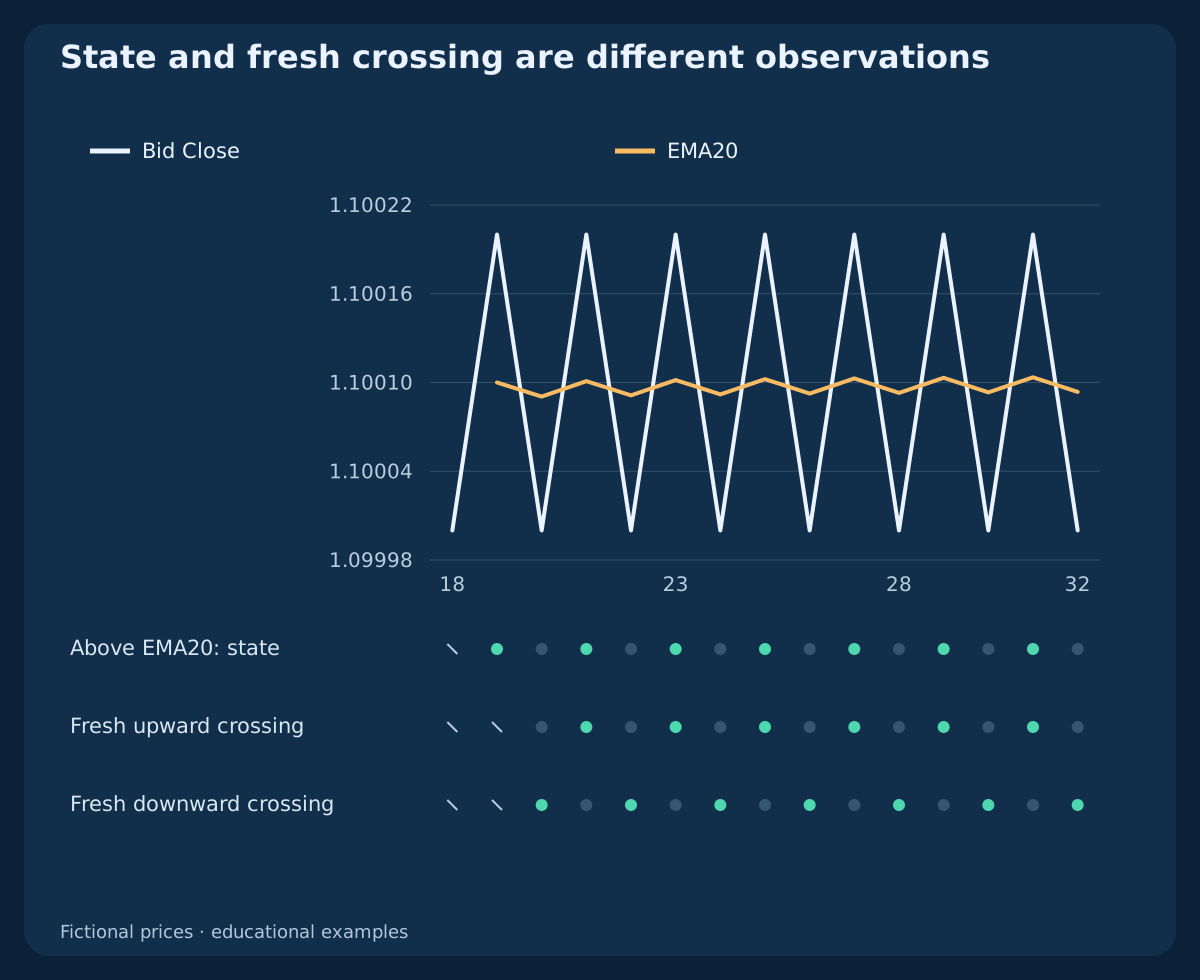
An upward crossing requires Close(t−1)≤MA(t−1) AND Close(t)>MA(t); downward requires Close(t−1)≥MA(t−1) AND Close(t)<MA(t). Previous equality is allowed; current equality is not a crossing.
Above an average is a state that can persist without another event. The first slow-reference crossing can occur at k20, after both observations exist. Missing values remain unavailable; substituting zero would manufacture an event at initialization.
6. See an SMA crossing without a price change
In the roll-off history Close stays at 1.10005 from k19 onward. SMA20 is 1.100105 at k20 and 1.1000075 at k21, when an earlier high leaves the window. Price crosses the moving SMA while remaining unchanged.
At k21 EMA20 remains above that close and gives no equivalent upward event. Price never broke the previous SMA level. Crossing a recalculated average and breaking a frozen price level are different definitions.
7. Compare two seeds explicitly
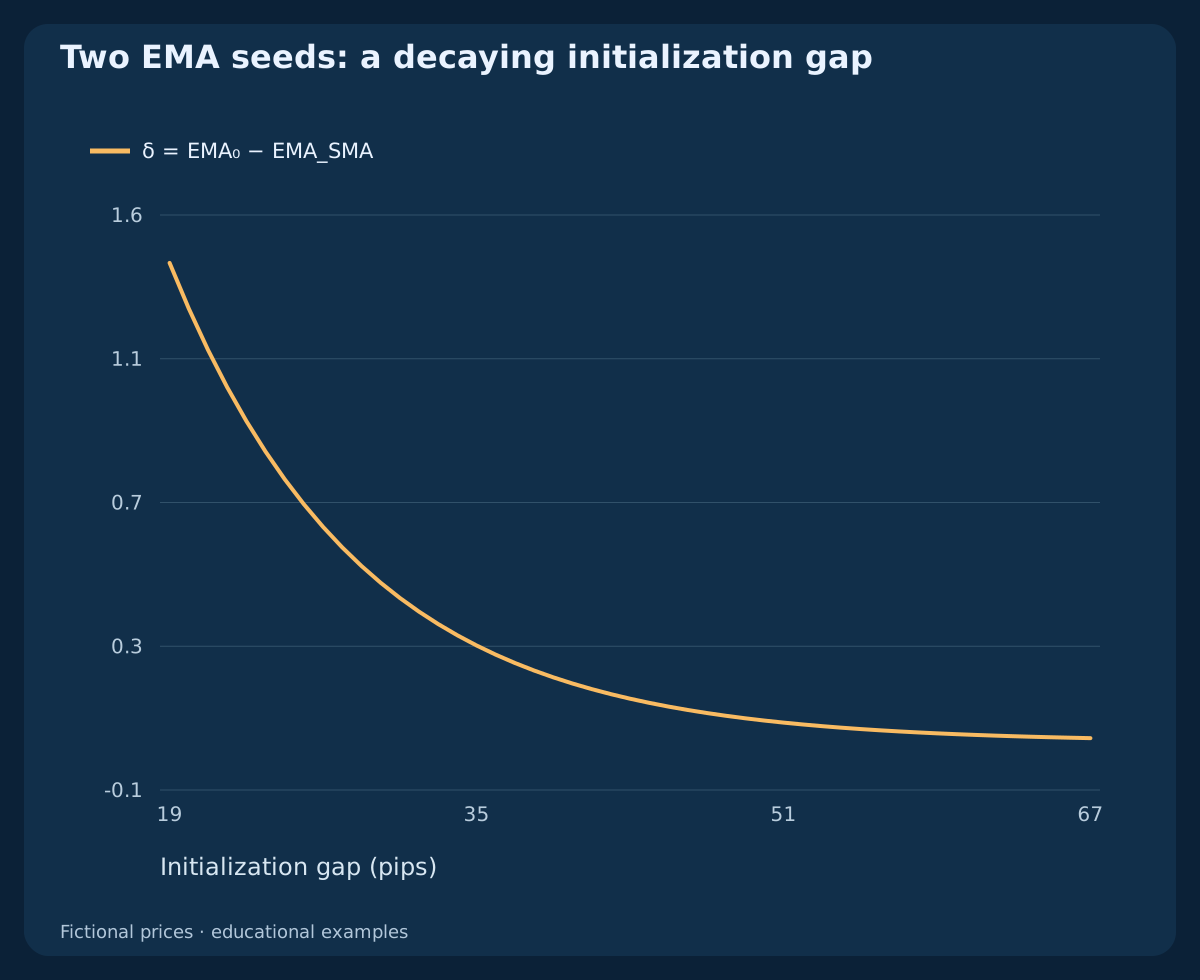
The alternate EMA20 starts from the first close at k0. Compare it with the SMA-seeded reference only from k19. With identical later closes, their gap satisfies δ(t)=dδ(t−1) and δ(k)=d^(k−19)δ(19).
Decay does not guarantee a universal warm-up count for every initial gap and tolerance. Declare the seed, starting history, precision and acceptable error. Do not silently substitute the earlier available alternate series for a missing reference value.
8. Check the claim that EMA always lags less
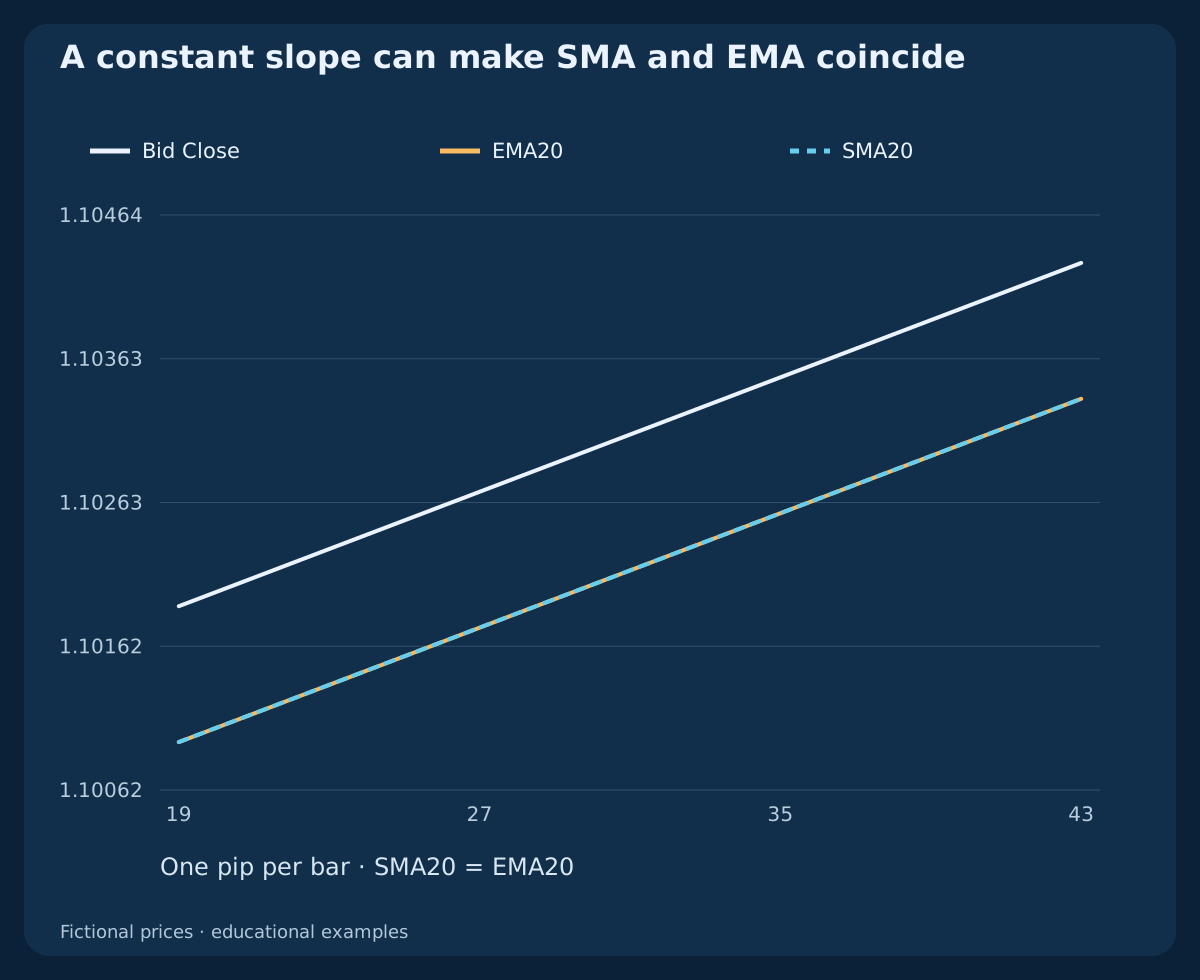
In the straight-line history Close rises by 1 pip per bar. Under our seed, EMA20 and SMA20 coincide from k19, both 9.5 pips below Close. The ten-period versions both lag by 4.5 pips from k9.
This identity depends on a constant slope and the declared initialization; it is not universal. After a single pulse EMA responds more strongly and then decays, while SMA holds the pulse until it leaves the window. Neither behavior predicts the next price.
9. Separate fast/slow and price crossings
An upward fast/slow event uses Fast(t−1)≤Slow(t−1) AND Fast(t)>Slow(t); reverse both comparisons for downward. State the methods and periods. A price/EMA event and an EMA10/EMA20 event describe different comparisons.
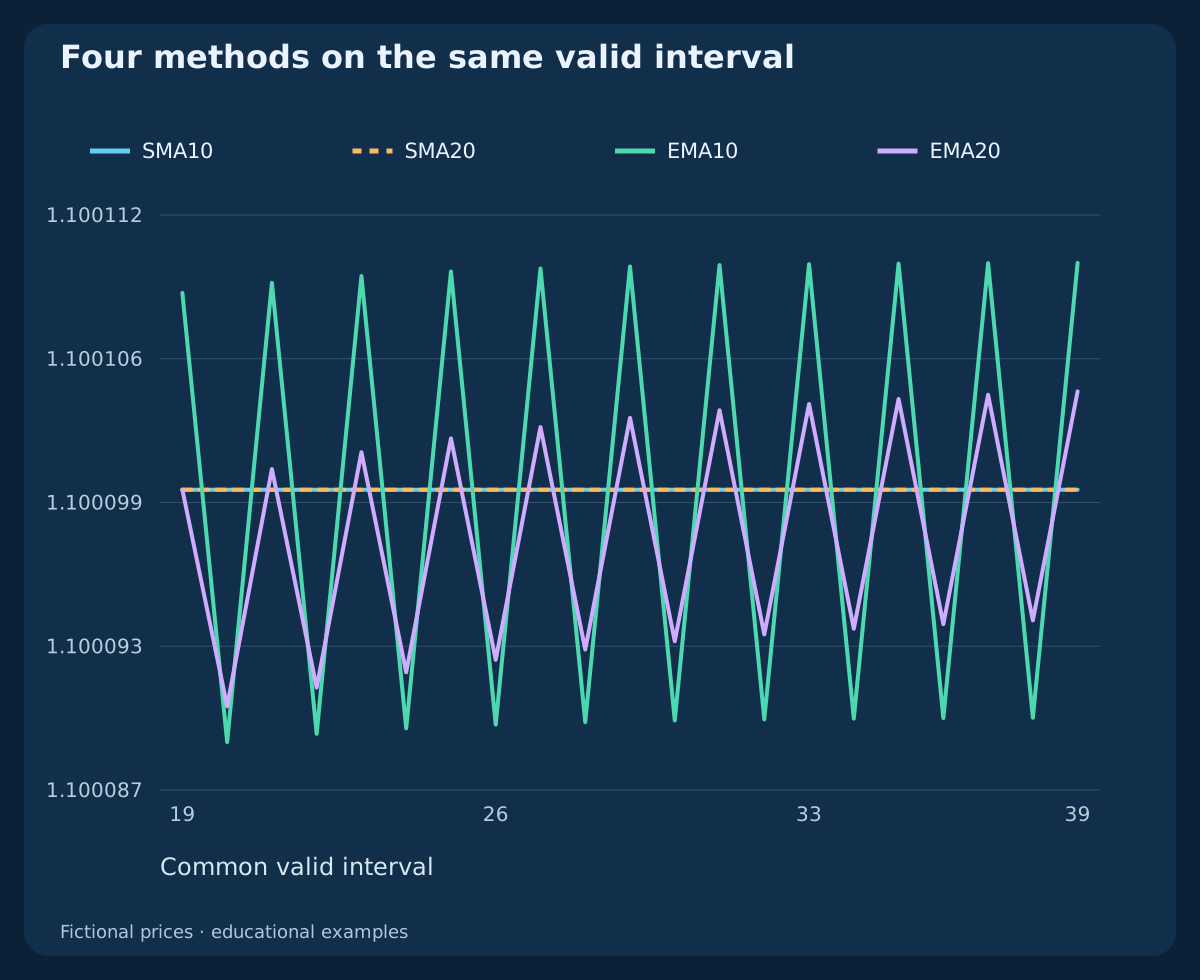
The alternating history has equal SMA10 and SMA20 throughout their common interval, while EMA events can alternate. Equality is not an upward or downward crossing. Several transformations of the same closes do not supply independent confirmation.
10. Use the same valid comparison interval
Periods 10 and 20 are fixed before examining the histories. Compare all four reference averages from k19 and slow-reference events from k20. Giving one method extra early bars changes the comparison.
Periods such as 20, 50 or 200 are observation horizons, not universally profitable settings. A longer average can smooth recent variation and respond late to a change. Selecting a favorable period from the same outcomes requires a separate evaluation.
11. Separate display shift from buffer index
In MQL4 iMA, ma_shift controls chart displacement and the final shift selects a historical buffer value. Our reference uses zero display displacement, Close prices and named SMA or EMA methods. Displacing a line does not reveal future closes.
Buffer indices 1 and 2 select the latest completed bar and its predecessor; 0 is forming. Verify actual bar identities and complete history. A scheduled UTC close boundary does not prove that a tick or completed buffer was observable at that exact instant.
12. Add context before defining a trade
A rising average, price above it and a fast line above a slow line can reflect the same recent movement. None independently establishes future profitability. Markets can reverse abruptly or oscillate around an average without treating it as a fixed barrier.
This guide defines observations, not a complete entry strategy. Sizing, invalidation, holding horizon, quote eligibility and order constraints need prior rules. A later favorable crossing cannot repair an earlier rejected entry under another model.
13. Account for both executable quote sides
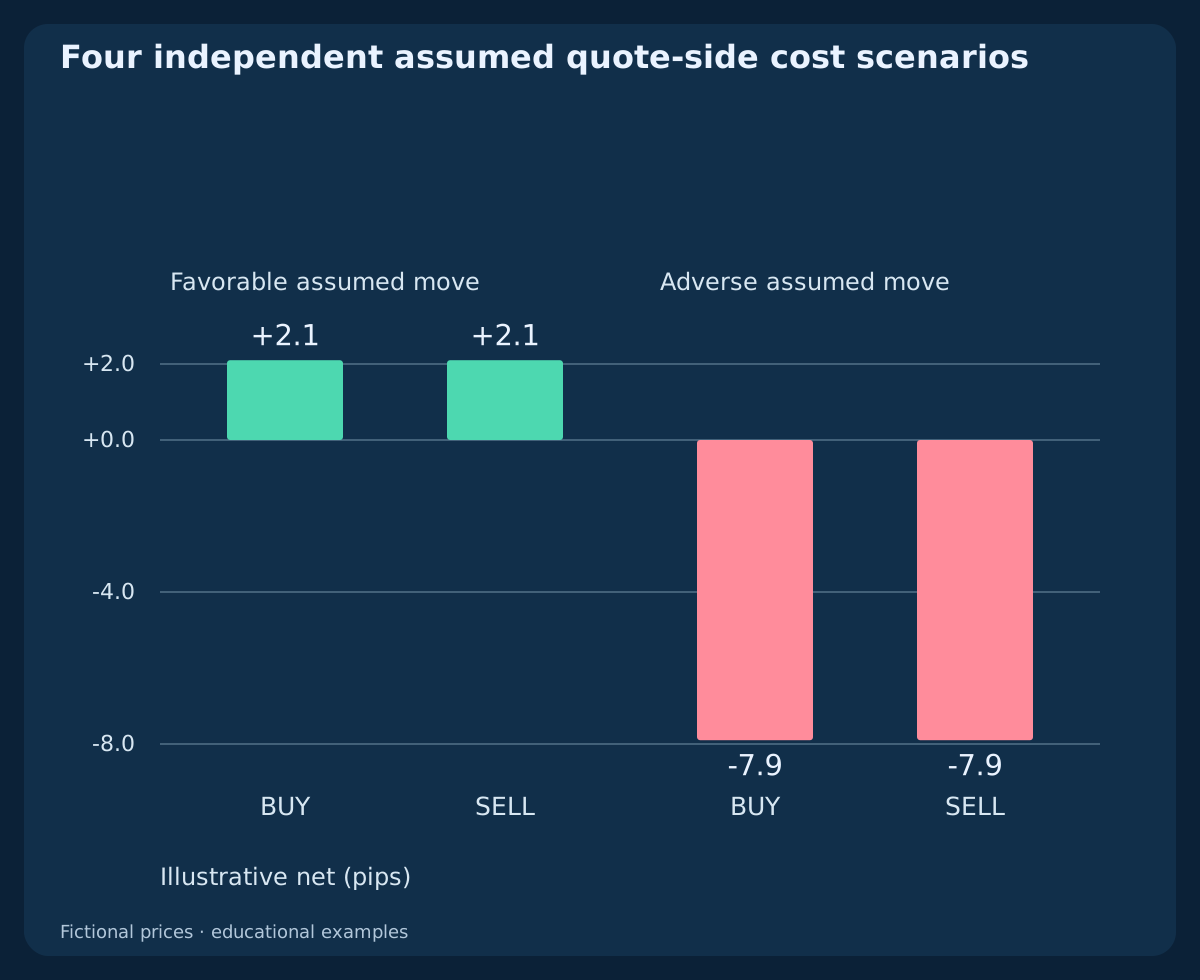
Four independent assumed scenarios use a 1.2 pip spread and initial Bid/Ask 1.10000/1.10012. A favorable directional Bid move of 5 pips gives 3.8 pips executable gross for BUY or SELL; an adverse five-pip move gives −6.2 pips.
BUY enters at Ask and exits at Bid; SELL enters at Bid and exits at Ask. The assumed quote times are 2026-10-20 07:00:05 UTC and 08:00:05 UTC. They are independent of the indicator histories, not observed fills or crossover outcomes.
14. Keep cost allowances distinct from results
Deduct round-trip commission 0.7 pip and slippage reserve 1 pip, with zero assumed financing. Illustrative net is +2.1 pips in each favorable case and −7.9 pips in each adverse case. The reserve is assumed, not measured slippage.
At 0.10 lot and assumed 10 USD per pip per lot in a USD account, this corresponds to +2.10 USD and −7.90 USD. Other instruments, currencies and holding periods require different accounting. A positive constructed case is not an expected return.
15. Reproduce the calculations from CSV
The first CSV contains 408 fictional candles, four reference averages, the alternate seed and event flags. Blank cells mean unavailable, including comparisons before both observations exist. The table isolates the unchanged-price example; displayed rounding does not determine crossings.
The second CSV separates twenty individual recent weights and one aggregate seed weight. The third contains only the four independent assumed quote scenarios. Recompute at full precision and keep histories separate. Flat prices must produce equal valid averages and no invented crossing.
Download six fictional H1 OHLC histories and all SMA/EMA calculations (CSV)
Download finite SMA/EMA weights, including the aggregate seed (CSV)
Download four independent assumed quote-side cost scenarios (CSV)
| Index | UTC close boundary | Bid close | EMA20 | SMA20 | Close−EMA (pips) |
|---|---|---|---|---|---|
| 19 | 2026-10-19 20:00:00 UTC | 1.10005 | 1.10010250 | 1.10010250 | -0.525000 |
| 20 | 2026-10-19 21:00:00 UTC | 1.10005 | 1.10009750 | 1.10010500 | -0.475000 |
| 21 | 2026-10-19 22:00:00 UTC | 1.10005 | 1.10009298 | 1.10000750 | -0.429762 |
| 22 | 2026-10-19 23:00:00 UTC | 1.10005 | 1.10008888 | 1.10001000 | -0.388832 |
| 23 | 2026-10-20 00:00:00 UTC | 1.10005 | 1.10008518 | 1.10001250 | -0.351801 |
16. Evaluate a complete strategy separately
Before testing execution, freeze the input, method, periods, seed, tolerance, event definition and gap treatment. Separate later evaluation from parameter selection, include realistic costs and examine rejected signals as carefully as accepted ones.
The existing moving-average trend-pullback strategy has its own price and risk rules; a fresh-crossover model needs another full specification. These six histories establish calculation examples and edge cases, without estimating win rate, drawdown or a tradable advantage.
Frequently asked questions
Is EMA better than SMA for Forex?
Neither formula establishes a profitable edge. EMA puts more weight on the latest close; SMA uses a finite equal-weight window. Assess the full strategy with independent evidence.
Can price cross SMA without moving?
Yes. An old close can leave the rolling window and move SMA across an unchanged current close. The roll-off example shows this.
Does EMA20 use only twenty closes?
No. After initialization it retains older information recursively. The weight chart explicitly includes the aggregate seed contribution.
How many warm-up bars are enough?
No universal number guarantees every tolerance. Specify the seed and starting history, then compare the remaining gap with a declared error limit.
Is every bar above an average a fresh event?
No. Above is a state. A fresh event needs two available observations and the stated inequalities.
Are the charts backtest results?
No. The histories are fictional, and the quote-side scenarios are separate assumptions. They report no observed trades or measured profitability.
Sources and research notes
The primary references describe moving-average definitions and iMA arguments. The six fictional histories, declared SMA initialization, finite weights and assumed quotes are original educational constructions. They do not establish terminal seed parity or profitability.
- MetaTrader 4: simple and exponential moving averages
- MQL4: iMA inputs, display displacement and buffer index
Educational guide. Fictional prices and independent assumed quotes; no observed orders, historical backtest, measured edge or guaranteed outcome.