

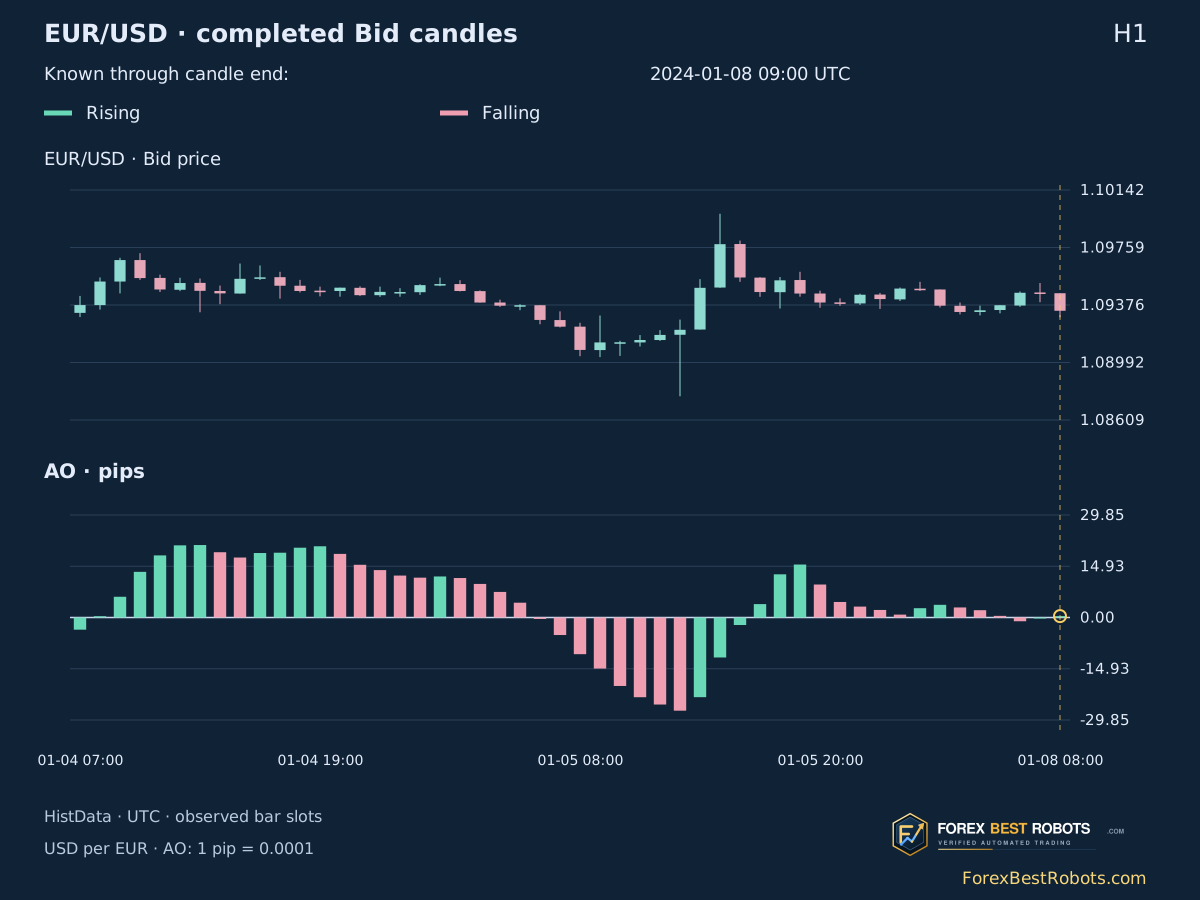
A green Awesome Oscillator bar can remain below zero. A red bar can stay above it. Separate the oscillator’s sign from its change, then check when a pattern becomes knowable. This guide uses real EUR/USD Bid candles and reveals only the history available at the selected close.
1. What Awesome Oscillator measures
AO subtracts a 34-candle simple average of median prices from a 5-candle simple average. Here median price means (High + Low) / 2 for each candle, not the statistical median of 34 observations. The result is a price difference; it is not a percentage or a bounded 0–100 scale.
The explorer displays AO in EUR/USD pips, where one pip is 0.0001 USD per EUR. This only changes the unit: it leaves the sign, slopes and exact pattern comparisons unchanged. A positive AO means the short average exceeds the long average; it does not guarantee that the next market price will rise.
2. Calculate 5/34 without filling missing history
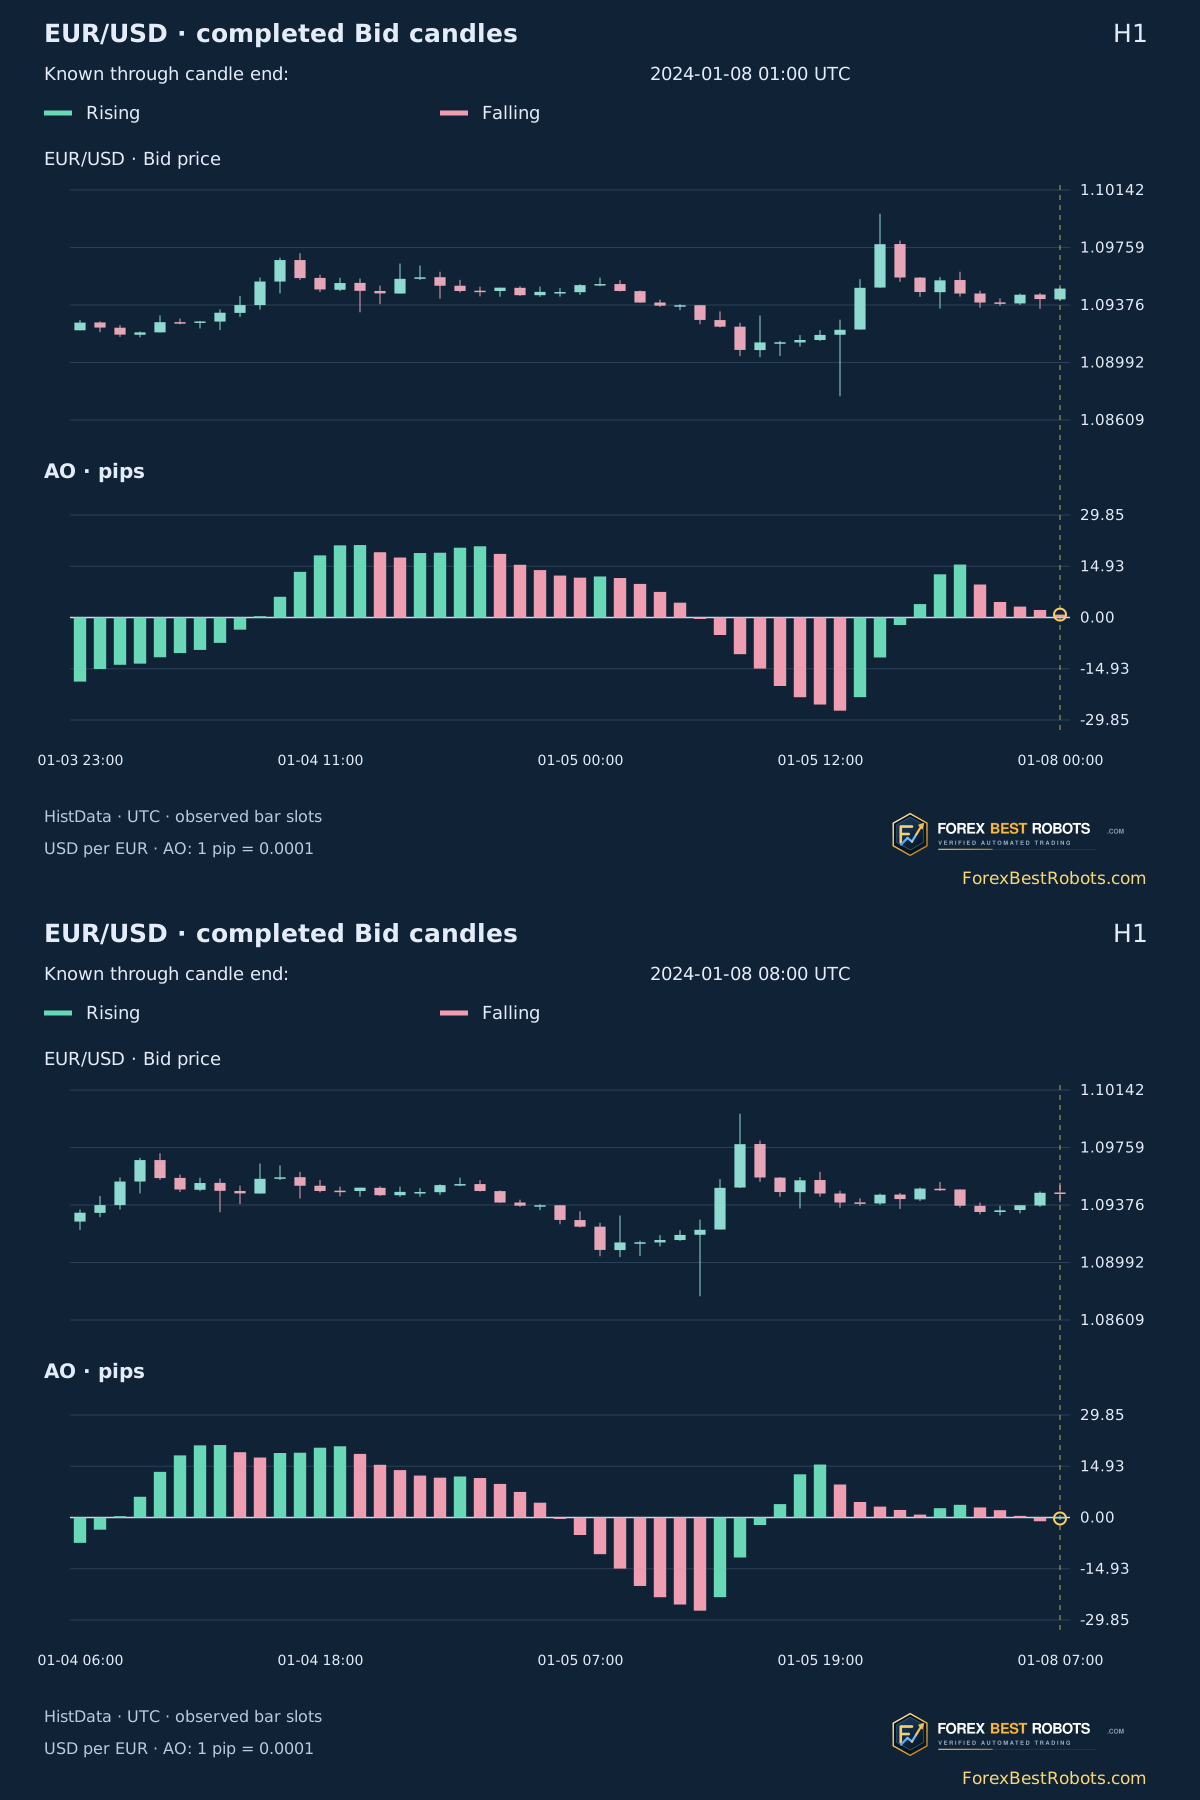
Use observed completed candles in chronological order. The first AO value needs 34 of them, so indices 0–32 are unavailable and index 33 is the first valid value. The 5-candle mean can exist earlier, but AO cannot. Do not replace missing AO with zero or treat the first valid value as a crossing.
For exact arithmetic, input prices are integer millionths of a dollar. Let S5 and S34 be rolling sums of High + Low. The integer numerator N = 34 × S5 − 5 × S34 gives AO in price units as N / 340000000 and in pips as N / 34000. Tables are rounded for reading; every condition uses N before rounding.
Median[t] = (High[t] + Low[t]) / 2
AO[t] = SMA5(Median)[t] − SMA34(Median)[t]
AO_pips = AO_price / 0.0001
3. Color and the zero line answer different questions
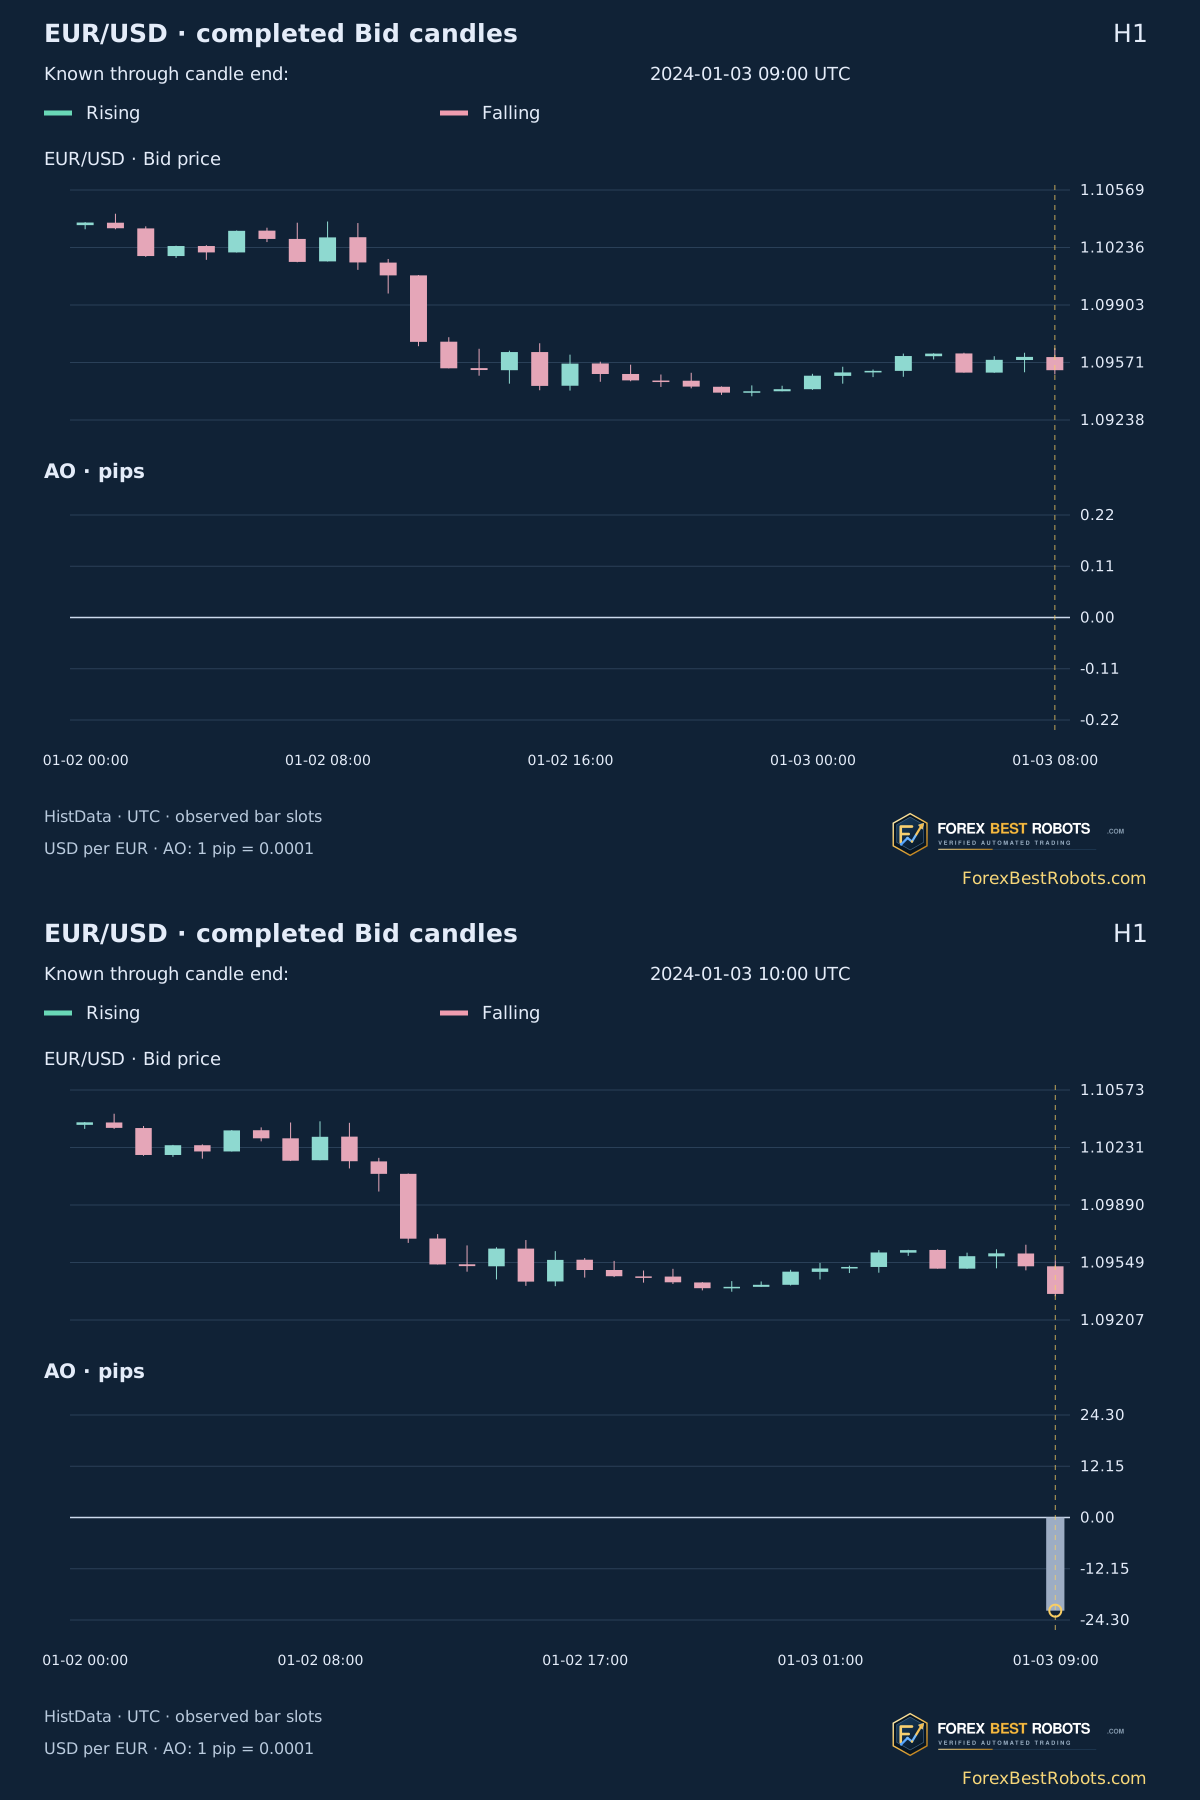
A rising bar has AO[t] > AO[t−1]; a falling bar has AO[t] < AO[t−1]. Both can occur on either side of zero. The real examples show a falling positive value and a rising negative value. They describe the short-versus-long average gap narrowing or widening, rather than a candle’s bullish or bearish body.
This educational display uses green for a strict rise, red for a strict fall and neutral gray for an exact tie or an unavailable previous value. The tie convention is stated explicitly and is not a claim that every MT4 version colors equal values identically. A price candle’s color is a separate comparison of its Open and Close.
Sign: AO[t] > 0 / < 0 / = 0
Change: AO[t] − AO[t−1]
Bullish saucer: a,b,c > 0; b < a; c > b
Twin pivot available: end_UTC[second_pivot + 1]
4. Recognize a strict zero crossing
The fixed two-bar rule here requires two adjacent valid AO values: a negative value followed by a positive value for an upward cross, or a positive value followed by a negative value for a downward cross. Both values must come from completed candles. Knowing the second close is necessary before labeling that observation.
An exact zero is a separate state in this guide. A touch of zero, or a move from zero into positive or negative territory, does not pass this strict adjacent-value rule. A sequence negative → zero → positive therefore has no strict two-bar upward cross. Other software may use a different zero policy; compare definitions before comparing counts.
5. Read a three-bar saucer in its zero-line context
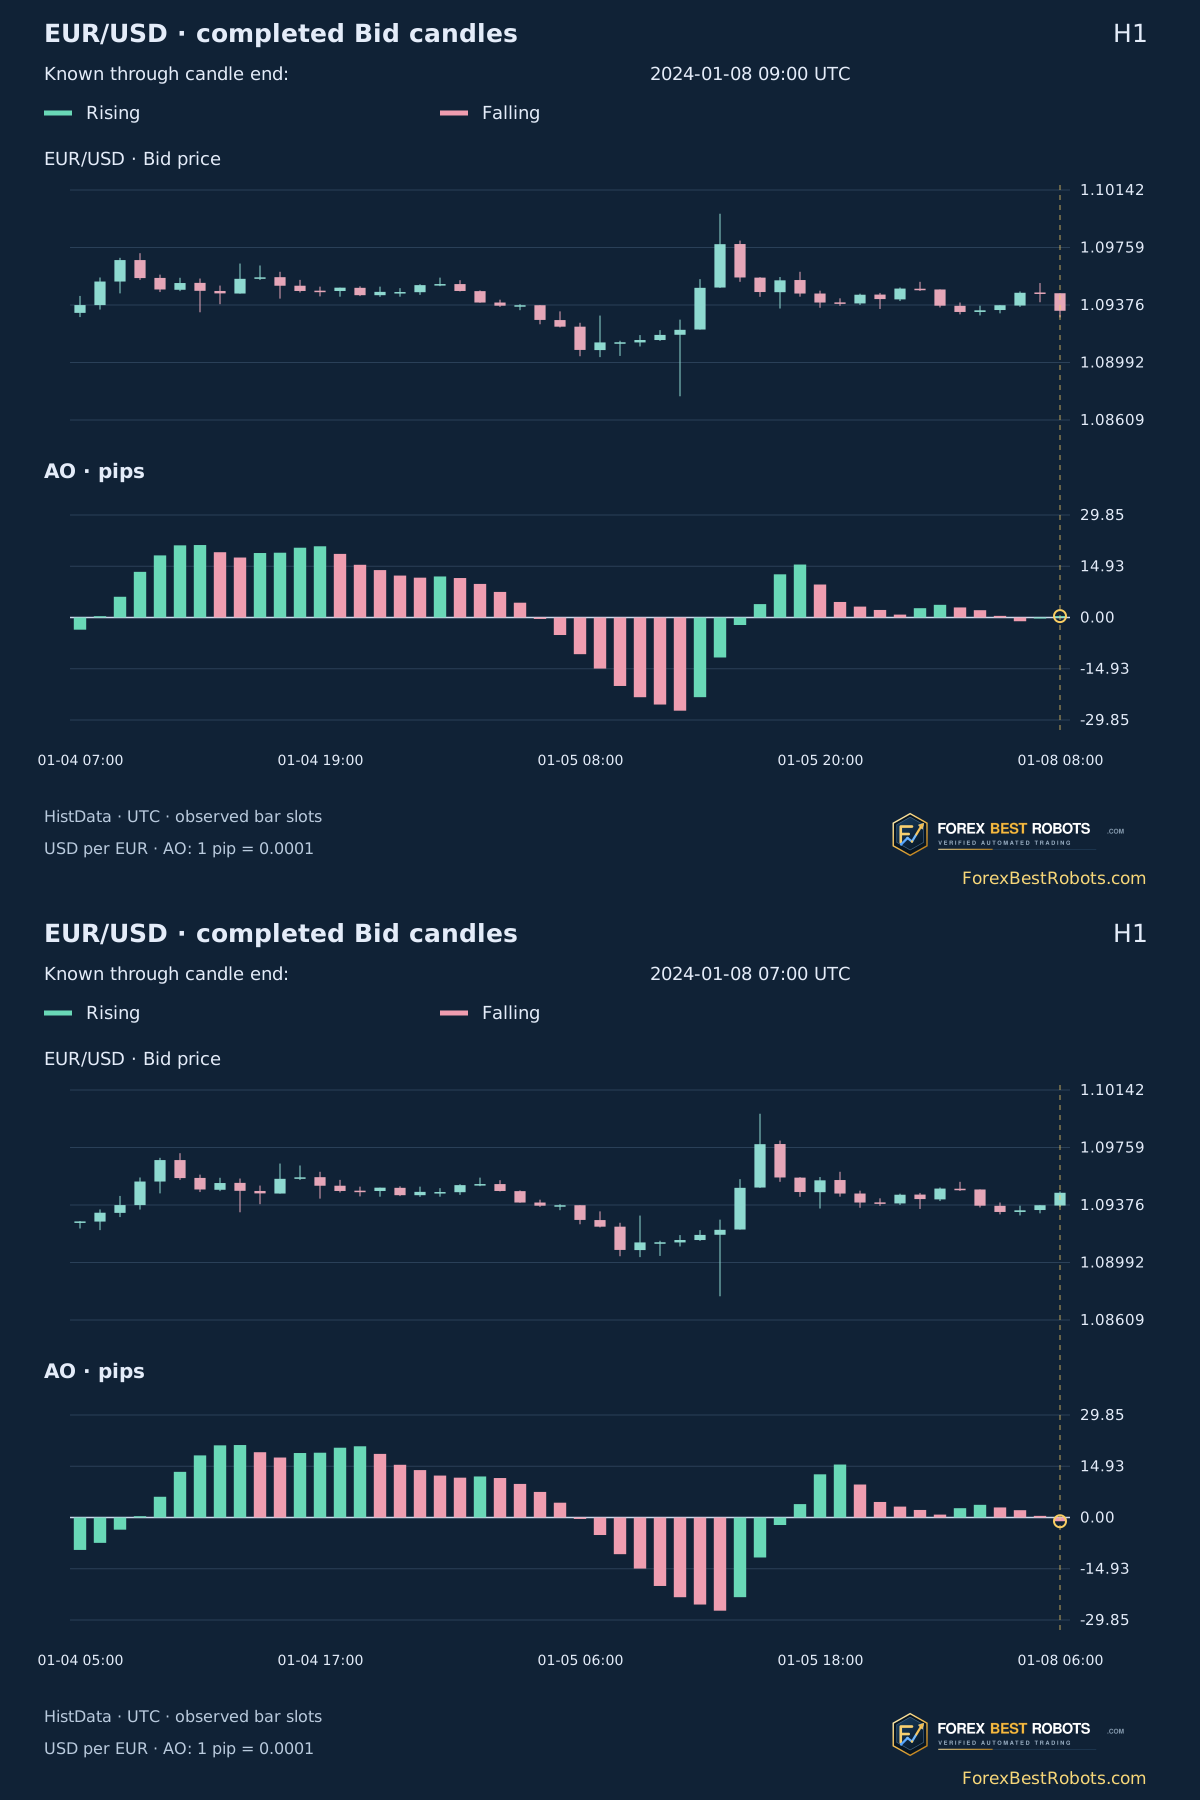
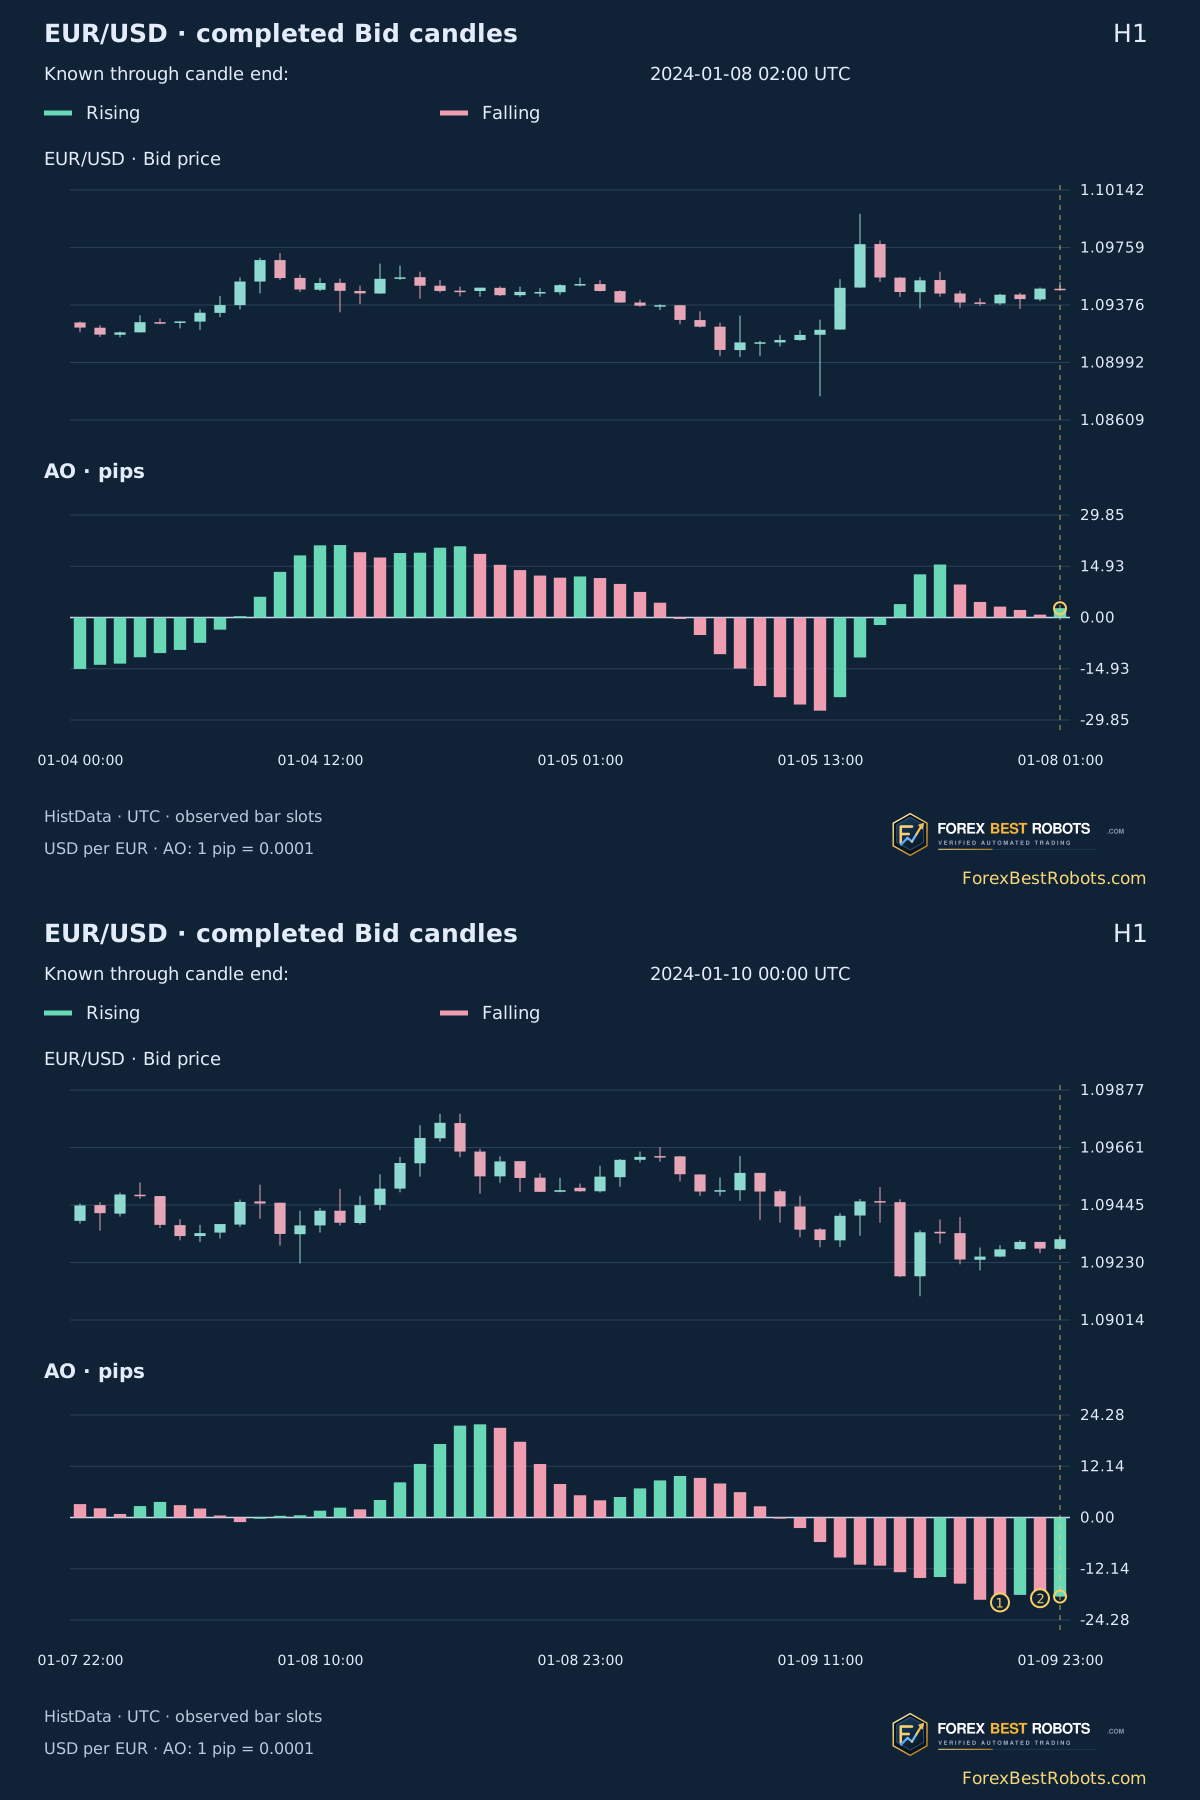
For the bullish saucer shown here, all three valid AO values a, b and c are strictly positive, b < a, and c > b. The bearish counterpart uses three strictly negative values, b > a, and c < b. The final bar completes the pattern; a single green or red bar alone is insufficient.
The examples apply those conditions to real data in chronological order. A saucer is an observation of the oscillator, not a complete trading strategy. The guide defines no entry order, stop, position size or exit. A recognized pattern therefore supplies no win rate or profit estimate.
6. Confirm twin peaks without using a future pivot
The broad twin-peaks idea compares two troughs below zero or two peaks above it. To make the explorer reproducible, this guide adds an explicit educational pivot rule: a strict local AO low or high needs one completed neighbor on each side. Compare consecutive confirmed lows or consecutive confirmed highs. This extra rule is not a signal returned by iAO.
A bullish pair has a higher second low and every AO value from the first low through the confirmation bar remains strictly negative; a bearish pair has a lower second high with the whole segment strictly positive. Equal neighbors or equal paired extrema fail. The second pivot becomes knowable one candle later, and markers appear only then. These AO extrema are not price-divergence signals.
7. Explore one completed candle at a time
Choose H1 or H4 and the last revealed candle. Previous/Next moves that cutoff by one observed candle. An example button opens a fixed historical observation; it does not run a trading simulation.
Open a real example
The gold line is the last revealed candle. Green/red AO bars show a strict rise/fall; gray means equal or no valid predecessor. Numbered twin pivots appear only at their confirmation close.
Scroll the chart horizontally on a small screen. Static figures can also be opened at full size.
Selected completed-candle observation
- AO value
- —
- Position relative to zero
- —
- Change from previous AO
- —
- Observation time · UTC end
- —
- Strict zero-cross observation
- —
- Three-bar saucer observation
- —
- Educational twin-pivot observation
- —
Check the last three revealed candles
| Interval start · UTC | Median price | SMA 5 | SMA 34 | AO · pips | Change from previous AO |
|---|
Display: 6 decimals for the table and AO summary; 5 for the price axis. All conditions use the exact integer AO numerator before display rounding.
8. Compare completed values with MT4
The MQL4 iAO function accepts symbol, timeframe and buffer shift. It returns an AO value, not a saucer or twin-peaks verdict, and has no fast/slow-period arguments. If bar 0 is still forming, use shift 1 for the latest completed bar and shift 2 for its completed predecessor when checking a two-bar change.
A current bar’s High and Low can still change, so its median price and AO can also change before the close. Platform comparisons need the same symbol feed, session boundaries, timezone and available history. This HistData reconstruction is not presented as identical to a broker’s chart or as an MT4 screenshot.
9. Separate the observation time from an order fill
The selected cutoff is the UTC end of the last revealed candle. That is the observation time used for a zero cross or saucer; a twin pair uses the end of the right-hand confirmation candle. Drawing a label over an earlier pivot does not make its pattern available at that earlier time.
These are Bid OHLC observations, not executable Bid/Ask quotations. An actual strategy would need entry timing, Ask-side purchases or short exits where relevant, spread, commission, slippage, stops and exits. Those rules and costs must be fixed before a performance test; they are not inferred from the indicator pictures.
10. Use this sample for explanation, not a forecast
The dataset contains 527 H1 and 137 H4 observed Bid candles from one historical EUR/USD month. Empty intervals are omitted, and the horizontal axis uses observed bar slots rather than inventing weekend candles. H1 and H4 are separate aggregations. A pattern’s frequency in this sample is not a probability of profit.
Alligator, Fractals and AO describe different features, but they still use related price information. Combining them does not create independent evidence automatically. Use the linked guides to understand their timing and overlap before turning a combination into a separately specified strategy.
Frequently asked questions
What is the Awesome Oscillator formula?
AO = SMA5((High + Low) / 2) − SMA34((High + Low) / 2). It is a price difference. This explorer rescales the difference into EUR/USD pips without changing its signal comparisons.
Can a green AO bar be below zero?
Yes. Green means a strict increase from the previous valid AO value in this display. A negative value can become less negative while remaining below zero.
Why are the first 33 AO values missing?
The 34-candle mean is not yet available. AO first becomes valid at the 34th observed candle. Missing history is not zero, and that first valid value is not treated as a cross.
When is the twin-peaks example confirmed?
Under this guide’s explicit one-left/one-right AO pivot rule, the second extremum becomes known after its right-hand candle closes. The same-side-of-zero check includes that confirmation candle. This operational rule is an educational addition, not an iAO signal buffer.
Does a touch of zero count as a cross?
Not under the strict adjacent-value rule used here. It requires opposite nonzero signs on two neighboring valid AO values. Exact zero is reported separately.
Do these examples demonstrate a profitable strategy?
No. They explain an indicator on real historical Bid candles. The guide specifies no executable orders, trade exits, costs or return calculation.
Data, timing and reproducibility
Source: HistData DAT_ASCII_EURUSD_T_202401.zip. The retained Bid inputs are the independently reaggregated candles used for Alligator and Fractals: 527 H1 and 137 H4 candles, based on 2,172,729 selected tick records. This guide reuses those verified inputs; it does not claim a new raw-tick reaggregation.
Coverage: 2024-01-02 00:00 UTC inclusive to 2024-02-01 04:00 UTC exclusive. The source uses fixed EST UTC−05:00. Empty intervals are omitted. Examples are the first eligible observations after 2024-01-08 00:00 UTC for each named condition; no selection by later returns. The method download records exact arithmetic, warmup, zero handling, saucer and educational twin-pivot rules.
- H1/H4 candles and AO values (ZIP)
- Signal observations and recognition times (CSV)
- Data, fixed method and reproducible script (ZIP)