

Alligator combines three smoothed averages of each candle’s midpoint. Its most easily missed feature is the horizontal displacement: a value calculated from one candle is drawn several bar slots to its right. This guide separates the calculation, the displayed position and the time when the input becomes available, using historical EUR/USD Bid quotes.
1. What Alligator measures
The blue Jaw is the slow line, the red Teeth the middle line and the green Lips the fast line. All three use SMMA, applied to (High+Low)/2. They describe smoothed price context; they do not measure transactions, order flow or the number of buyers and sellers.
Names such as sleeping, awakening and feeding are visual metaphors. A claim that a long quiet phase must produce a profitable trend needs a separate test. We use explicit line comparisons below instead of treating those names as measurable trading rules.
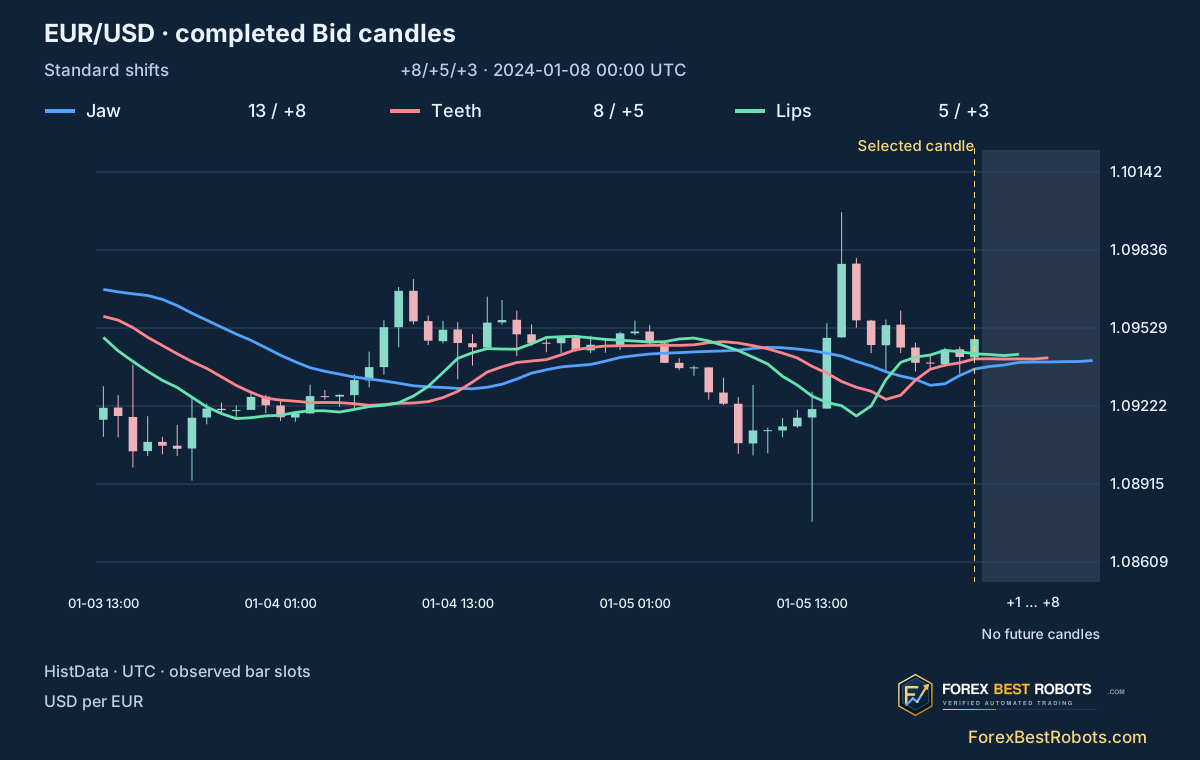
2. Separate the periods from the display shifts
The standard Jaw uses period 13 and shift +8; Teeth uses period 8 and shift +5; Lips uses period 5 and shift +3. A period counts input candles. A shift changes where a completed calculation is drawn. Neither setting means a price forecast for that many hours.
H1 and H4 apply the same settings to different candle sequences. The H4 lines in this guide are recalculated from H4 highs and lows; they are not sampled H1 lines. The zero-shift viewer option is an educational comparison, not the standard Alligator display.
Jaw: N=13, s=+8
Teeth: N=8, s=+5
Lips: N=5, s=+3
3. Calculate the midpoint, seed and SMMA update
For each observed candle, M=(High+Low)/2. For period N, initialize SMMA with the arithmetic mean of the first N midpoints. Each subsequent value is ((N−1)×previous SMMA+current M)/N. Before N inputs exist, that line is unavailable; it is never silently set to zero.
This reproduction starts its history at 2024-01-02 00:00 UTC. An MT4 terminal with more preceding history can have a different seed and therefore different early values. Seeding is part of the method, not an adjustable way to improve a chart. Prices are calculated before display rounding.
M[i] = (High[i] + Low[i]) / 2
SMMA[N−1] = Σ(M[0..N−1]) / N
SMMA[i] = ((N−1) × SMMA[i−1] + M[i]) / N
Displayed[i] = SMMA[i−s]
4. Trace a shifted line back to its source candle
Let i be the selected chart slot and s the line’s positive shift. The value displayed over candle i is SMMA[i−s]. The new calculation SMMA[i] is drawn at slot i+s. At i, all three raw calculations may exist while an older source needed for a displayed line is still unavailable.
For the Jaw, the first raw value exists at index 12, but its first displayed value is at index 20. The corresponding first displayed indices are 12 for Teeth and 7 for Lips, counting the first candle as index 0. These are observed bar slots: weekends and empty intervals are not filled with invented candles.
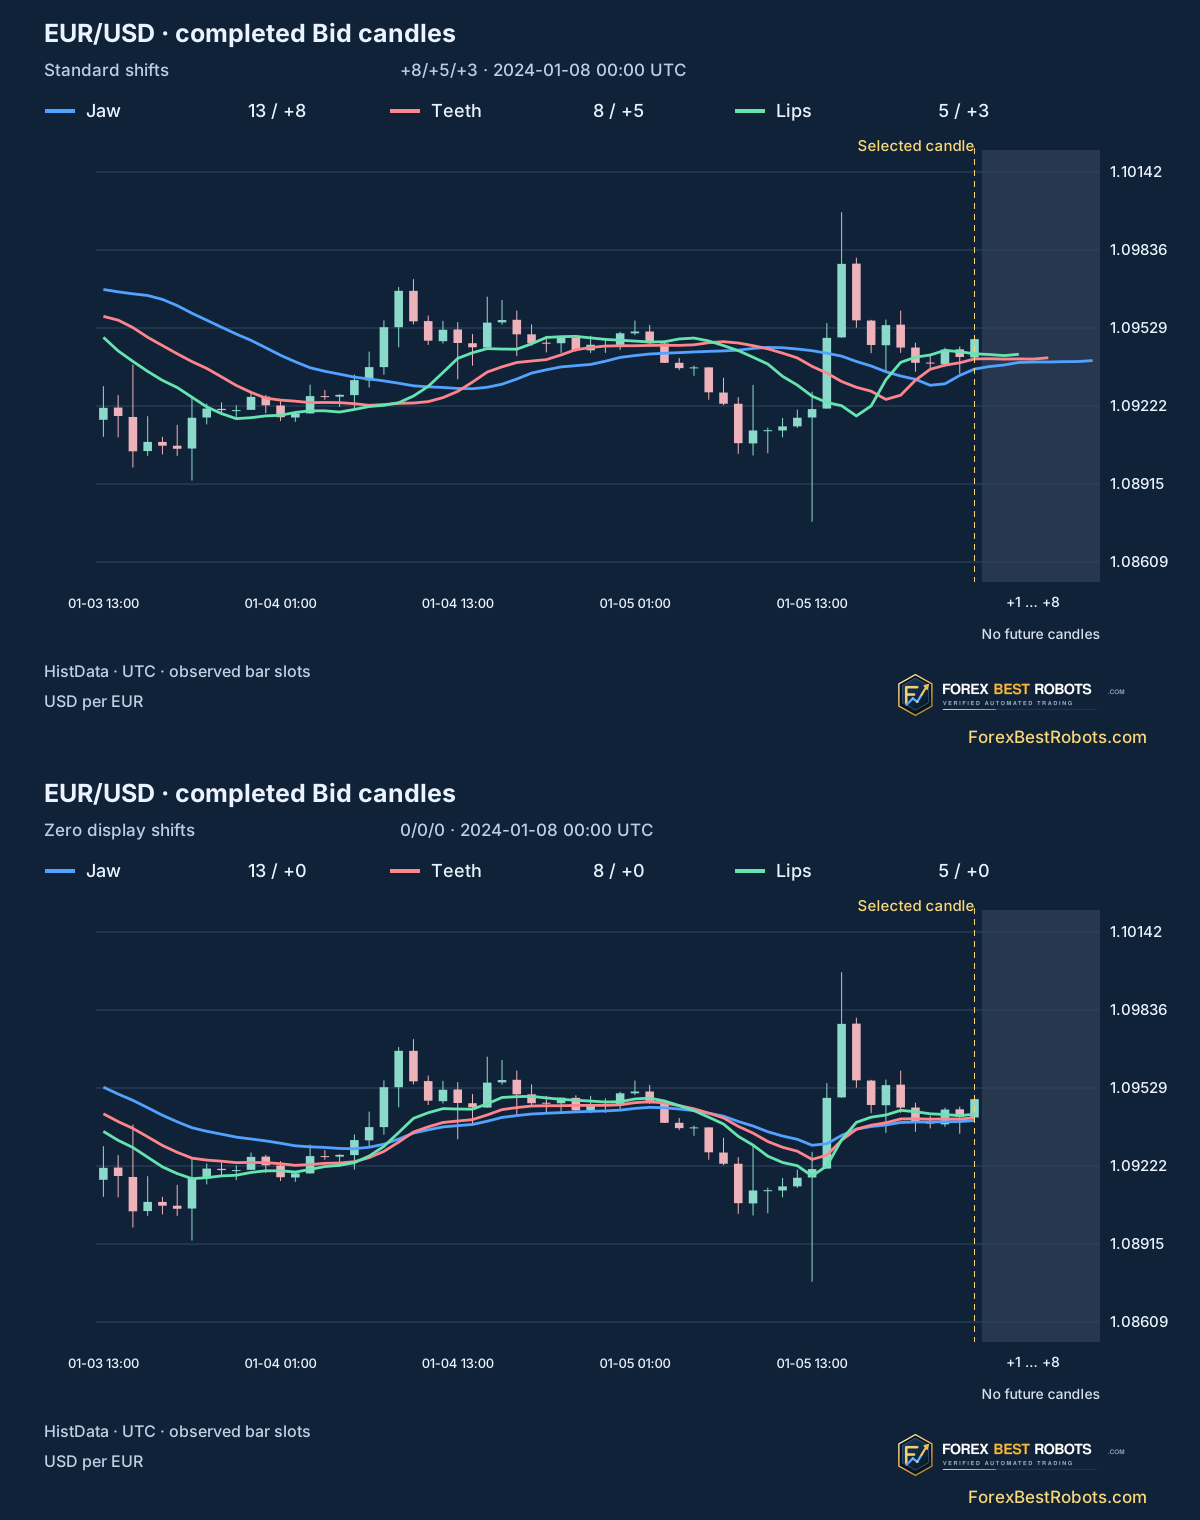
5. Read line order and spacing without inventing signals
Here a bullish ordering means Lips>Teeth>Jaw at the same displayed slot; a bearish ordering means Lips<Teeth<Jaw. Every other available arrangement is called mixed, including equality. Mixed does not prove a sideways market, and an ordered set does not prove that the next candle will continue.
The displayed envelope width is max(Jaw,Teeth,Lips)−min(Jaw,Teeth,Lips), expressed in pips. It measures the separation of three displaced averages, not ATR, spread or a target. A fresh ordering can arise as older source values advance; it need not coincide with a large new price move.
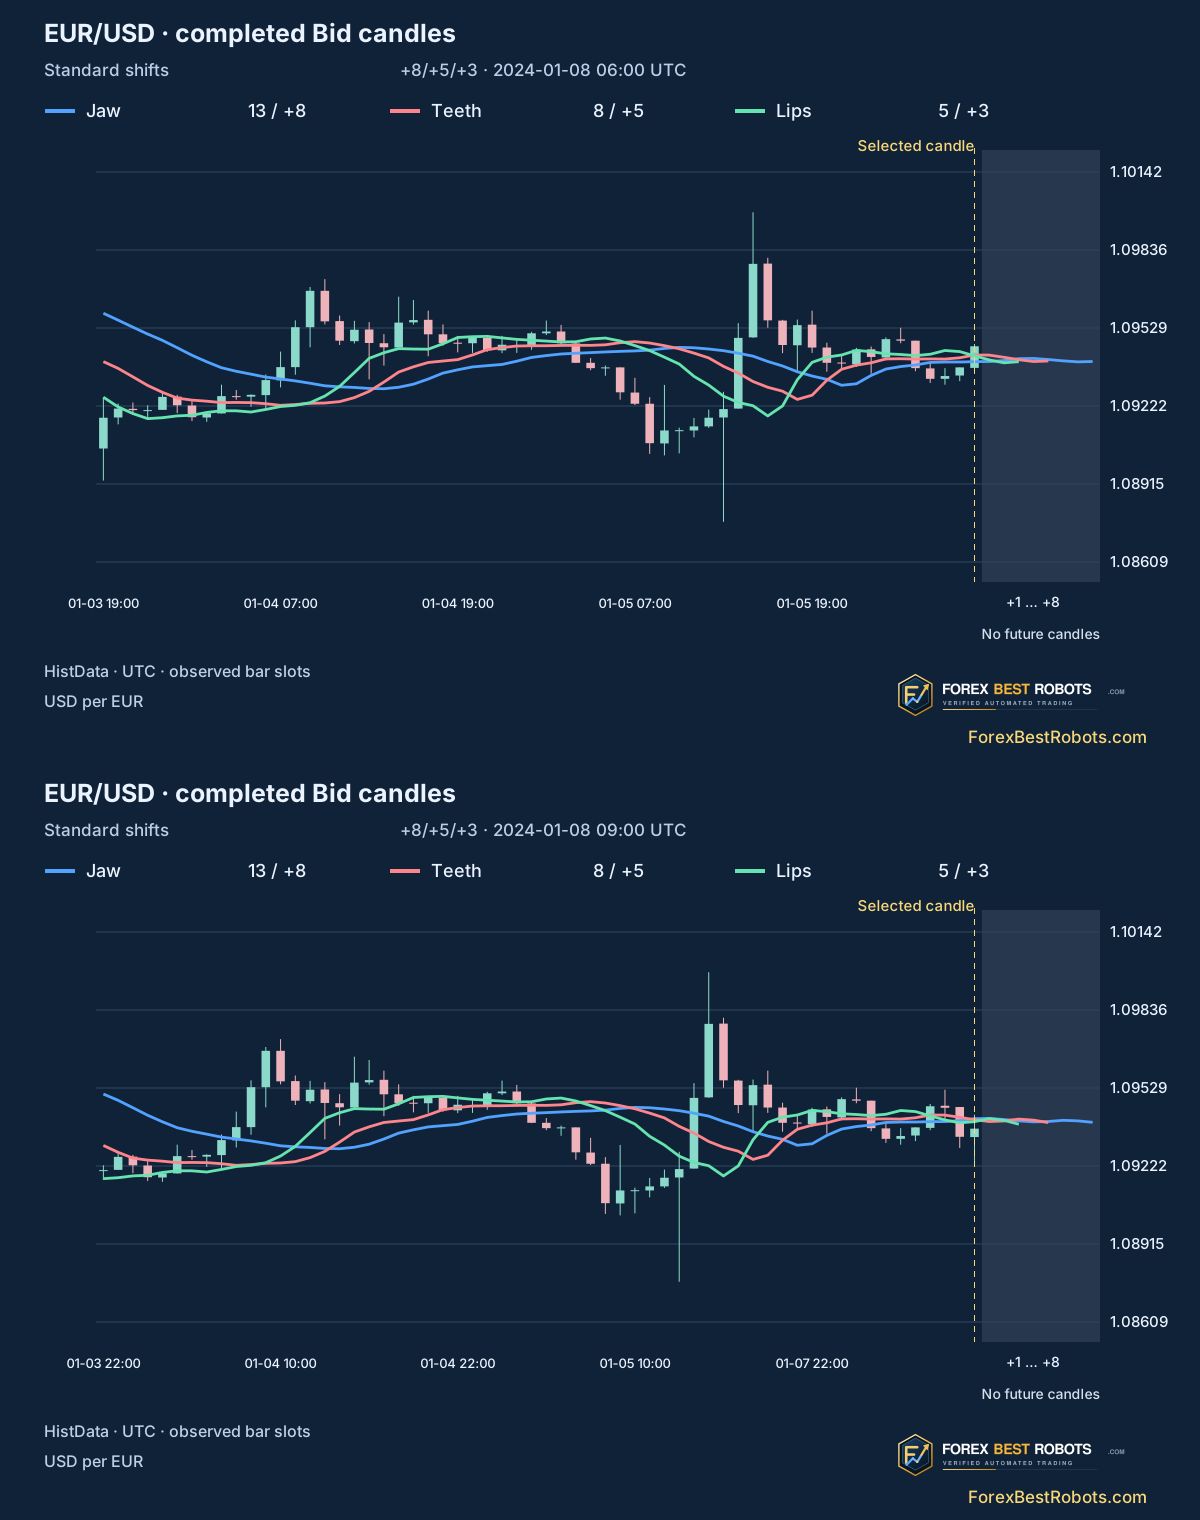
6. Use completed candles and compare H1 with H4
Candles are labelled by their UTC start and become complete at the end of their half-open interval. An H1 candle labelled 10:00 uses records from 10:00 up to, but not including, 11:00. Its completed High, Low and midpoint are unavailable at 10:00. The viewer exposes only candles up to the selected completed interval.
The archive clock is fixed EST, UTC−05:00, with no daylight-saving adjustment; we add five hours. H4 boundaries are 00:00, 04:00 and successive four-hour UTC boundaries. Broker charts can use different boundaries. Missing intervals are omitted, and a record count or observed minute count does not certify complete market coverage.
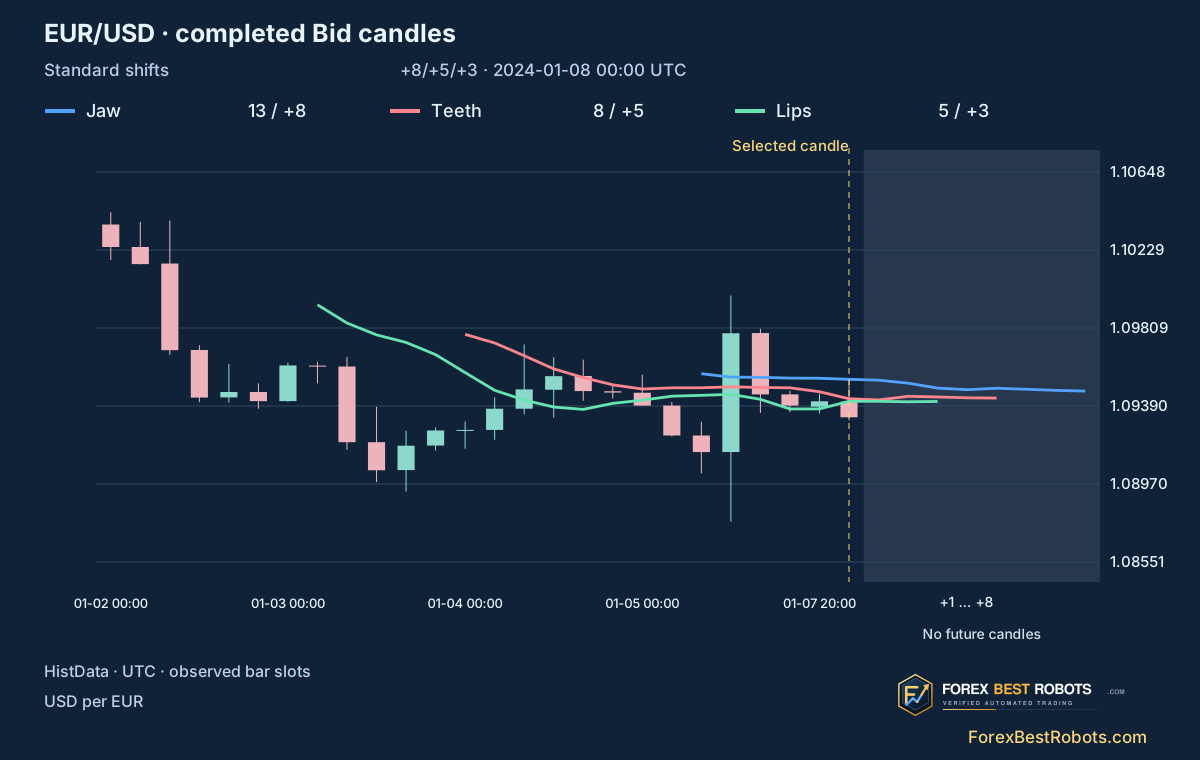
7. Inspect each candle and the source of every line
Choose a completed candle, then switch the display mode. The selected candle stays the same. The table separates the new SMMA calculated from that candle from the older value displayed over it.
Jump to a documented example:
Only completed historical candles up to the selection are shown. The area to their right has no observed future candles.
On a small screen, scroll the chart and table horizontally; use the buttons to move exactly one candle.
Selected candle and displayed context
- Input interval — UTC
- —
- Completed values available at
- —
- Bid Open / High / Low / Close
- —
- Midpoint (High+Low)/2
- —
- Order of the displayed lines
- —
- Displayed envelope width — pips
- —
- Quote records / observed minutes (interval minutes)
- —
Trace the calculation and drawing position
| Line | Period | Display shift — bars | New SMMA at selected candle | Value displayed at selected slot | Source candle of displayed value — UTC start |
|---|
Prices are shown to five decimal places; calculations and comparisons use unrounded values. The quote convention is USD for one EUR.
8. Check the Alligator settings in MT4
Open Alligator from the Bill Williams indicator group. Check all three periods and shifts, the Smoothed averaging method and Median Price (HL/2). Keep enough earlier chart history. Compare the same symbol, candle boundaries and input history before diagnosing a calculation difference.
The MQL4 iAlligator interface has separate parameters for each line’s display shift and a final shift parameter selecting a buffer position relative to the current bar. Those are different concepts. This guide does not claim a live MT4 execution test or an exact match with an unspecified broker feed; any EA must explicitly verify its own buffer-to-chart alignment.
9. Turn a reading into a fully specified trade plan
An ordering alone leaves the entry, expiry, stop and exit undefined. A later strategy must say whether it uses the displayed values or the undisplaced calculations, when a completed signal is accepted and which first eligible quote can be used. Those choices must be fixed before inspecting trade results.
These candles use Bid quotes. A long opens at Ask and closes at Bid; a short opens at Bid and closes at Ask. Spread, commission, slippage and any overnight financing belong in the test. A line touch on a Bid chart is not evidence of an executable fill or a profitable trade.
10. Understand what these examples establish
The examples are the first bullish, bearish and mixed displayed arrangements on H1 from 2024-01-08 00:00 UTC, plus the first available H4 arrangement from that time. They were selected by indicator conditions, not by later returns. The full retained input series is available for inspection.
One pair and one historical archive illustrate the arithmetic and timing. They do not estimate a win rate or validate a trading advantage. The guide contains no orders, simulated account performance or profitability claim. The strategy articles will need their own frozen rules and cost-inclusive evaluation.
Frequently asked questions
Does Alligator predict prices eight candles ahead?
No. The Jaw value calculated from a completed candle is drawn eight bar slots to its right. The displacement does not supply future quotes or validate a forecast.
Why can Alligator values differ between terminals?
Earlier history, initialization, Bid inputs, broker candle boundaries and settings can differ. Compare those inputs before comparing rounded values.
Are 13/8/5 the shifts?
No. They are the periods of Jaw, Teeth and Lips. Their standard positive display shifts are 8/5/3 bars respectively.
Can a completed line value repaint?
With fixed completed inputs, settings and initialization, the reproduction is deterministic. Values involving an unfinished candle can change, and revised or extended history can alter the reconstruction.
Does a bullish line ordering mean buy immediately?
No. Ordering describes three displayed values. It does not define an entry, risk, costs or evidence of positive expected returns.
Is Alligator better on H1 or H4?
This guide demonstrates both calculations without ranking their profitability. A comparison needs specified trading rules, consistent costs and separate evaluation periods.
Data, timing and reproducibility
Data: HistData EUR/USD Generic ASCII tick Bid/Ask archive for January 2024, converted from fixed EST to UTC. Retained intervals: 2024-01-02 00:00 ≤ time < 2024-02-01 04:00 UTC. H1 and H4 candles use observed Bid records; empty intervals are omitted. Price inputs in the downloadable CSV use integer millionths of USD per EUR; one EUR/USD pip equals 100 such units.
Download the complete derived inputs and a small reproducible calculation. The original archive is identified by its SHA-256 fingerprint and source page in the method file; it is not bundled into the public download. This is historical indicator research, with no executed or simulated trades.
- EUR/USD H1 inputs and Alligator values — CSV
- EUR/USD H4 inputs and Alligator values — CSV
- Inputs, calculation and method — ZIP