

An ordered Alligator is a trend description, not an entry by itself. This strategy waits for three completed H4 candles with the same line order, then considers only the first later touch of the Lips line. The historical result is close to zero after the base cost allowance, with only 17 trades.
1. Separate a trend description from a trading rule
The Lips, Teeth and Jaw must be strictly ordered in the same direction for three consecutive completed candles. Long: Lips > Teeth > Jaw; short: Lips < Teeth < Jaw. The third close arms the episode; it cannot itself be the pullback signal.
A mixed, equal or opposite order resets the episode. After arming, the first later candle touching Lips consumes the opportunity even if confirmation fails. This restriction prevents selecting a more attractive second or third pullback afterwards.
2. Use the displayed lines without future values
All three lines smooth the median price (High + Low) / 2. Jaw uses SMMA 13 shifted 8 bars, Teeth 8 shifted 5, and Lips 5 shifted 3. Each SMMA starts with its period-length simple average.
At candle t, use SMMA[t − shift]. A line drawn to the right is not future market information. The test converts the source fixed EST clock to UTC before constructing H4 intervals at 00, 04, 08, 12, 16 and 20 UTC.
Median[t] = (High[t] + Low[t]) / 2
SMMA[n−1] = SMA(first n medians)
SMMA[t] = (SMMA[t−1] × (n−1) + Median[t]) / n
Displayed[t] = SMMA[t−shift]
3. Confirm the first touch at the candle close
For a long signal, the previous close must be above previous Lips. The first touch candle has Low ≤ displayed Lips, closes above Lips and closes above its own Open. The bullish line order must still hold.
For a short signal, reverse the comparisons: previous close below previous Lips, High ≥ current Lips, and a bearish candle closing below Lips with bearish order intact. A doji or failed close ends that episode’s opportunity; no order is placed during the unfinished candle.
4. Enter on the next observed minute
After the signal interval ends, use the first recorded M1 Bid Open, provided its delay is no more than four hours. Skip an unavailable or later quote and an opening price already at or beyond the planned stop. Only one position can be open.
A signal known in or before the previous exit-minute interval is skipped. There is no queued entry, pyramiding, averaging or martingale. The quote record locates the observation within a minute; it does not establish an exact executable tick time.
5. Fix the stop, target and time exit
Stop: signal Low minus 1 pip for a long, or signal High plus 1 pip for a short. Target: twice the initial Bid-to-stop distance from entry. Both stay fixed. Exit at the first M1 Open of the 13th observed H4 candle from entry; the entry candle counts as number one.
Replay available M1 ranges. An adverse stop gap fills at the minute Open; a favorable target gap receives only the target price. If both levels occur within one minute with Open between them, assume stop first. At timeout, opening stop/target gaps take precedence; do not inspect that minute’s later range.
6. Distinguish an allowance from a measured spread
Base costs deduct 1.5 pips per completed trade plus 0.2 pips per crossed UTC midnight. Stress uses 3.0 and 0.5; zero costs use 0 and 0. These are explicit allowances, not observed spreads or broker swaps. No swap income or triple-rollover schedule is modelled.
One R is the initial Bid-to-stop distance. Net R subtracts the total pip allowance divided by risk in pips. A stopped trade can therefore lose more than 1R. Summed R is not a cash-account percentage return; lot size, leverage and margin are outside this model.
risk_pips = |entry_Bid − stop| / 0.0001
net_R = gross_R − (round_trip_pips + UTC_midnights × night_pips) / risk_pips
7. Keep the small overall result visible
The frozen rules produced 189 first-touch observations: 172 failed confirmation and 17 became trades. There were eight stop exits, four target exits and five time exits. No executed trade had both exit levels in the same recorded minute.
The base result is −0.06R, with 47.06% winning trades, a profit factor of 0.99 and maximum drawdown of 5.65R. With so few trades, a result near zero is weak evidence. The cost scenarios reuse exactly the same entries and exits.
| Cost scenario | Trades | Sum of net R | Mean net R | Maximum drawdown · R |
|---|---|---|---|---|
| Zero costs | 17 | +1.29R | +0.0761R | 5.00R |
| Base costs | 17 | -0.06R | -0.0038R | 5.65R |
| Stress costs | 17 | -1.48R | -0.0871R | 6.30R |
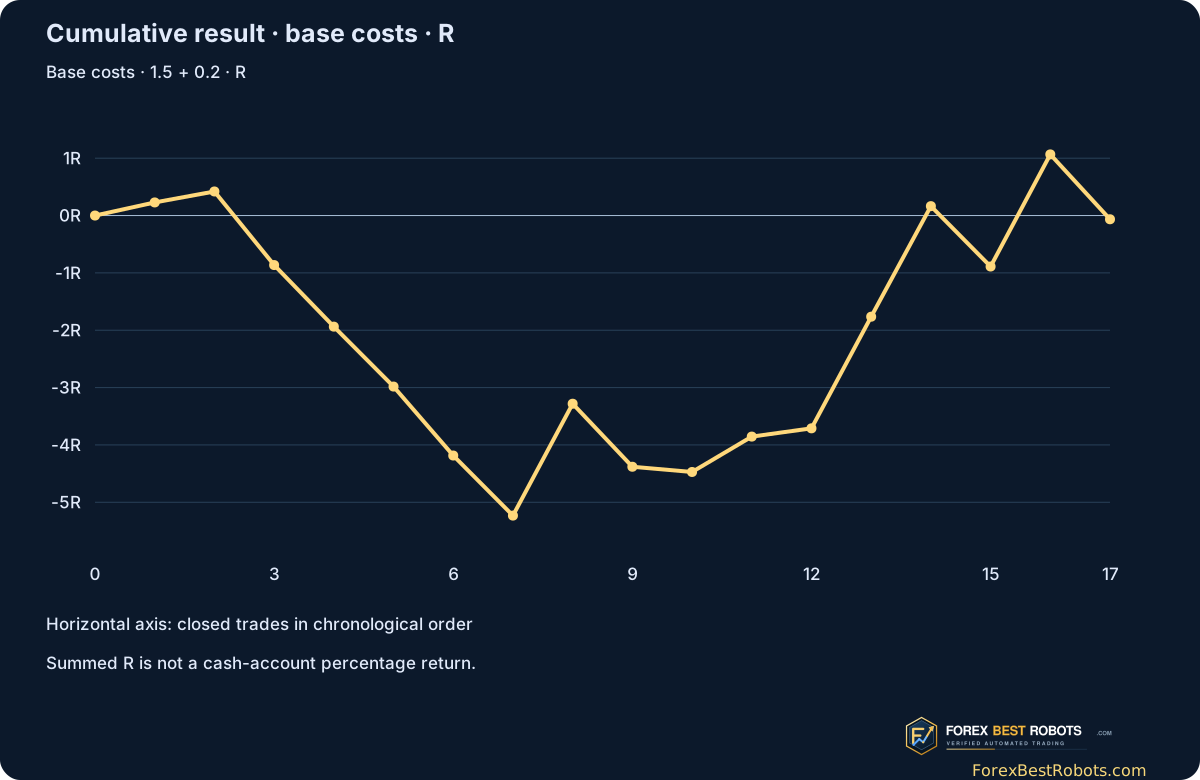
8. Compare entry years without calling them a forecast
At base costs, 2023 contributed −2.98R from five trades, 2024 −1.40R from four, and 2025 +4.32R from eight. The combined earlier period returned −4.38R. Years are assigned by entry time; any later exit remains with that entry year.
The 2025 segment is chronologically later, but this is a retrospective study rather than a blind out-of-sample or live forward test. The parameters were fixed before this calculation and were not tuned to make the later segment profitable.
| Entry year | Trades | Sum of net R | Maximum drawdown · R |
|---|---|---|---|
| 2023 | 5 | -2.98R | 3.40R |
| 2024 | 4 | -1.40R | 2.25R |
| 2025 | 8 | +4.32R | 1.13R |
9. Inspect the first long and first short
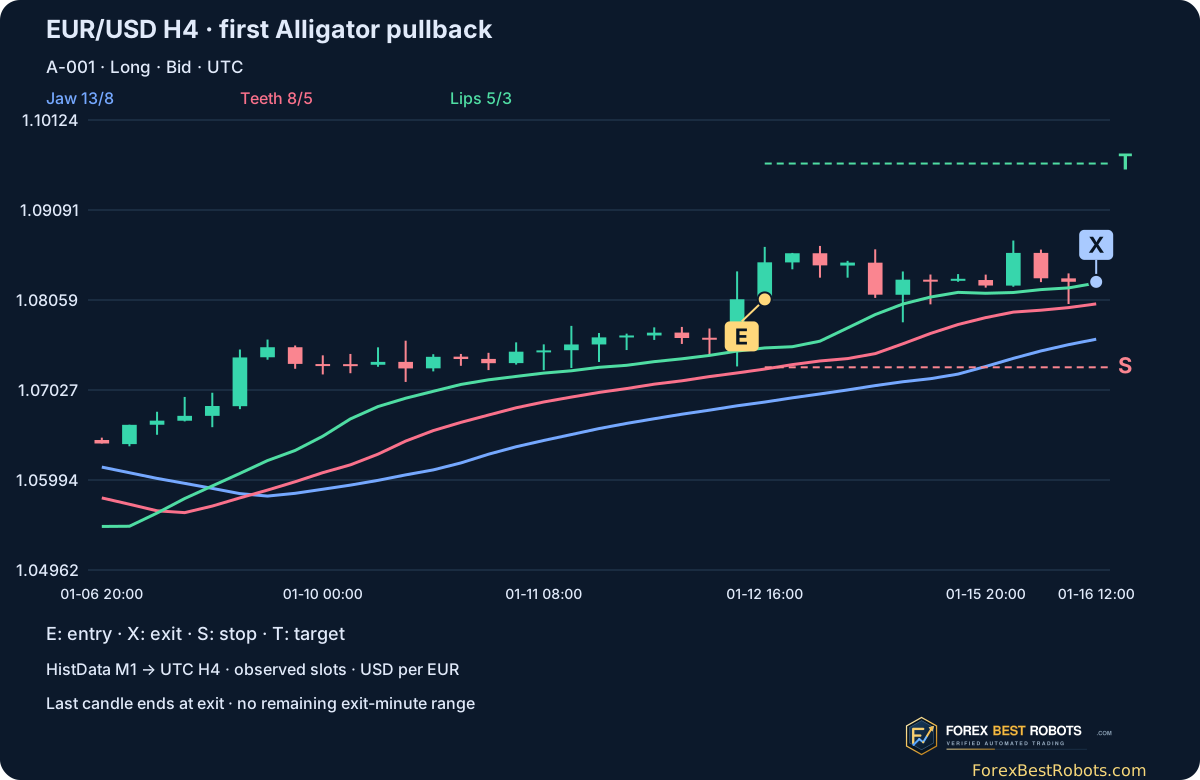
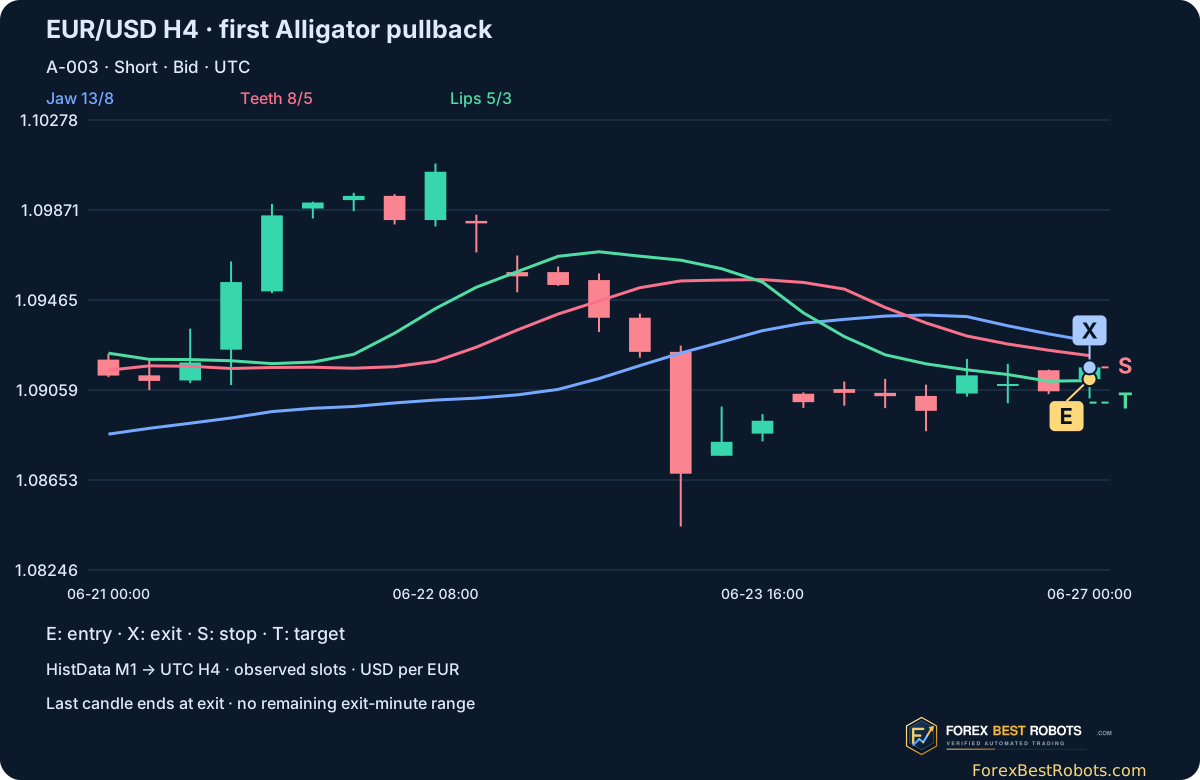
The figures use A-001 and A-003: the first executed long and short in chronological order, selected without reference to their eventual returns. E marks entry, X exit, S the fixed stop and T the fixed target.
The final plotted candle ends at the exit observation. Its range uses only earlier recorded minutes and the modelled exit price, excluding the remaining exit-minute range. Horizontal spacing counts observed H4 slots; weekends and missing intervals are not filled.
10. Choose a trade, then change its cost allowance
Choose any of the 17 trades. Previous/Next changes the selected trade; the first-long and first-short buttons return to the two published examples. The table gives signal availability, minute-labelled entry and exit, prices, initial risk and the largest observed source gap while holding.
Changing either cost input recalculates the selected net R and the whole-sample sum and drawdown. It does not move entries, exits, stops or targets. Use the presets to compare zero, base and stress costs; the full static trade log remains below.
Enable JavaScript to change trades and costs. Static charts, results and downloads remain available.
Scroll a wide chart horizontally on a small screen, or open a static figure at full size.
| Trade | Direction | Entry interval · UTC | Exit interval · UTC | Net R · base |
|---|---|---|---|---|
| A-001 | Long | 2023-01-12T16:00Z | 2023-01-16T12:00Z | +0.23R |
| A-002 | Long | 2023-03-29T12:00Z | 2023-03-31T13:00Z | +0.19R |
| A-003 | Short | 2023-06-27T00:00Z | 2023-06-27T02:40Z | -1.28R |
| A-004 | Short | 2023-09-18T08:00Z | 2023-09-18T16:08Z | -1.07R |
| A-005 | Short | 2023-09-22T12:00Z | 2023-09-22T15:31Z | -1.05R |
| A-006 | Long | 2024-03-14T12:00Z | 2024-03-14T12:24Z | -1.20R |
| A-007 | Long | 2024-09-30T12:00Z | 2024-09-30T15:25Z | -1.05R |
| A-008 | Short | 2024-12-18T16:00Z | 2024-12-18T19:10Z | +1.95R |
| A-009 | Short | 2024-12-24T16:00Z | 2024-12-26T15:27Z | -1.10R |
| A-010 | Long | 2025-01-21T16:00Z | 2025-01-23T16:00Z | -0.09R |
| A-011 | Long | 2025-02-13T20:00Z | 2025-02-17T16:00Z | +0.62R |
| A-012 | Long | 2025-03-17T12:00Z | 2025-03-19T12:00Z | +0.14R |
| A-013 | Long | 2025-06-25T16:00Z | 2025-06-26T00:56Z | +1.95R |
| A-014 | Long | 2025-07-23T16:00Z | 2025-07-24T15:02Z | +1.93R |
| A-015 | Long | 2025-08-14T12:00Z | 2025-08-14T13:30Z | -1.05R |
| A-016 | Short | 2025-10-09T08:00Z | 2025-10-09T16:41Z | +1.96R |
| A-017 | Short | 2025-10-22T20:00Z | 2025-10-24T08:31Z | -1.13R |
Minute labels identify source intervals, not exact execution ticks. Prices use USD per EUR; 1 pip = 0.0001.
11. Keep the source limitations beside the result
HistData M1 records are Bid OHLC, not a complete executable Bid/Ask feed. Missing quotes can conceal level crossings. The 2023 files contain notably fewer recorded minutes than 2024–2025; gaps remain unfilled. The largest gap shown for a trade can also include a weekend.
The raw files contained 60 identical duplicate minutes in each of 2022, 2023 and 2025; these were removed before aggregation. There are no volume inputs, interpolated quotes or claimed tick fills. A 17-trade study with these data limitations cannot demonstrate reliable profitability.
Frequently asked questions
Is this the standard Alligator trading system?
The indicator settings are standard; the three-candle formation, first-touch restriction, confirmation, exits and costs are explicit rules for this study, not a claim that the platform prescribes this complete strategy.
Does a right-shifted line use future prices?
No. The displayed value at t comes from an earlier SMMA value at t minus the shift. Signals are evaluated only after the signal candle closes.
Why are there only 17 trades?
The first-touch and close-confirmation conditions are restrictive. Failed first touches consume an episode, so later pullbacks are not substituted. This makes the statistical evidence particularly limited.
Is the positive 2025 result enough to trade live?
No. Eight later-period trades do not establish a stable edge, and the whole sample is slightly negative at base costs. A broker-specific forward test would be a separate study.
Are costs and exit timestamps exact broker measurements?
No. Costs are stated allowances. The source supplies minute OHLC observations without a full executable Bid/Ask path, so intraminute ordering and exact tick timing remain unknown.
Data, timing and reproducibility
Source: four unchanged HistData annual EUR/USD ASCII M1 archives for 2022–2025 plus January 2026 for exit completion only. After removing 180 identical duplicate minutes, the inputs contain 1,469,935 observed minutes and 6,568 H4 candles. The source fixed EST clock is shifted by +5 hours to UTC; no daylight-saving adjustment is applied.
Entries are restricted to 2023-01-01 00:00 UTC inclusive through 2026-01-01 00:00 UTC exclusive. January 2026 allows exits only; this sample’s last entry and exit both occur in 2025. The download records original-file hashes, the frozen protocol, duplicate handling, signal decisions, all trades, gap annotations and reproducible calculation scripts. A separate raw-file reaggregation and event-driven replay agreed with the published values; both use the same provider.
- H4 candles, indicators and all trades (ZIP)
- Source files, frozen protocol and calculation method (ZIP)