

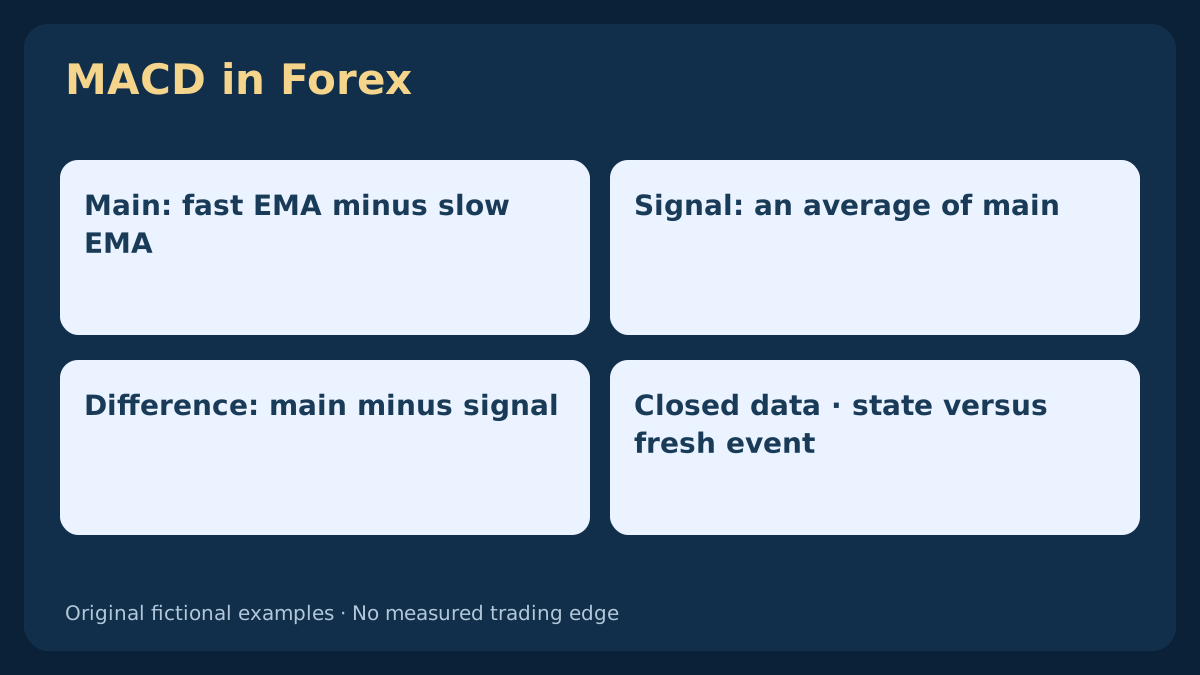
A MACD chart can show several different relationships with the same word or color. Start by naming the main series, the signal average and their difference. This guide rebuilds those values from a declared price history, then separates what is observable from what a trading rule would still need.
1. Name the three series before reading the chart
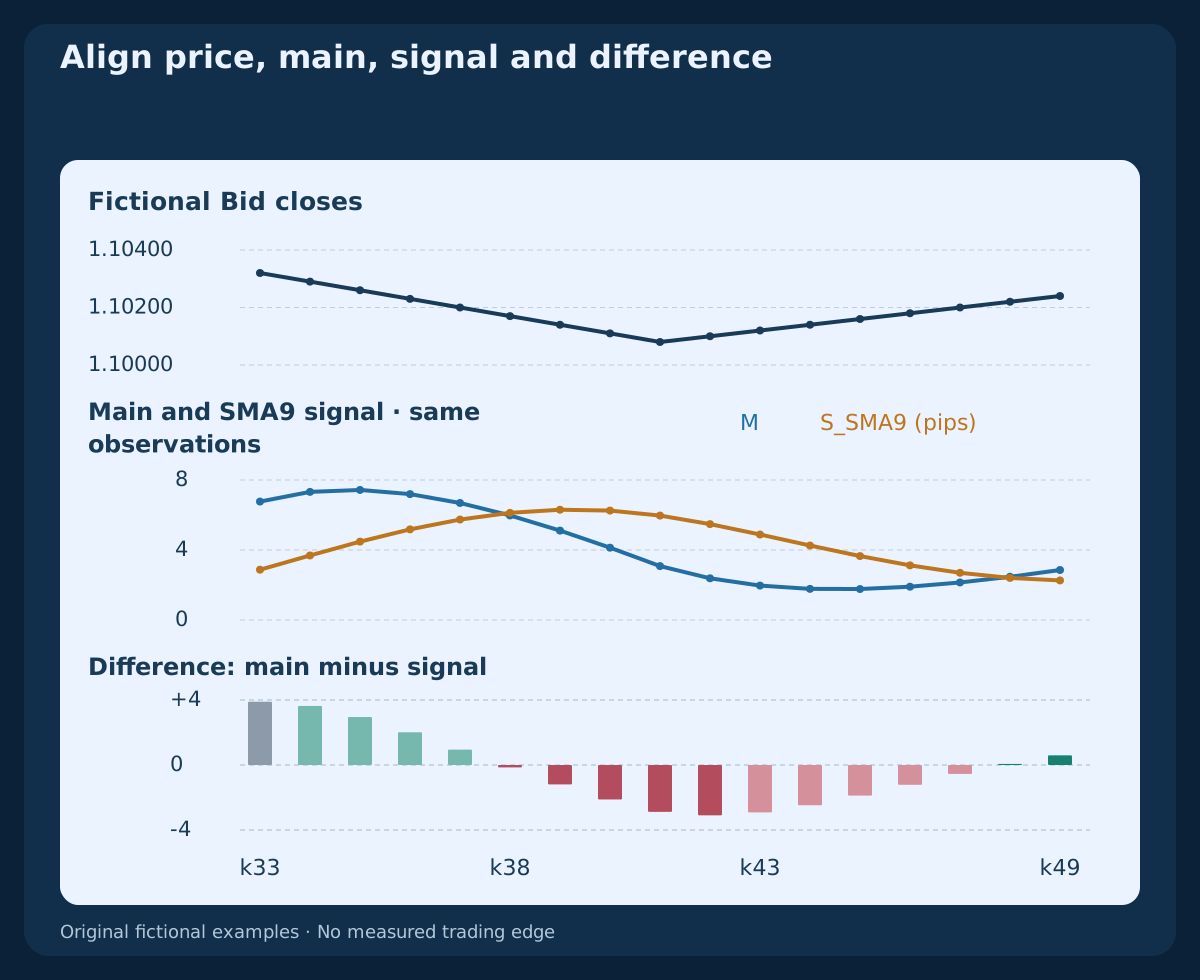
MACD starts with the difference between a faster and a slower moving average. Name that main series M, its averaged signal S, and the difference H=M−S. A main-line zero crossing, a main/signal crossing and a shrinking difference column answer different questions.
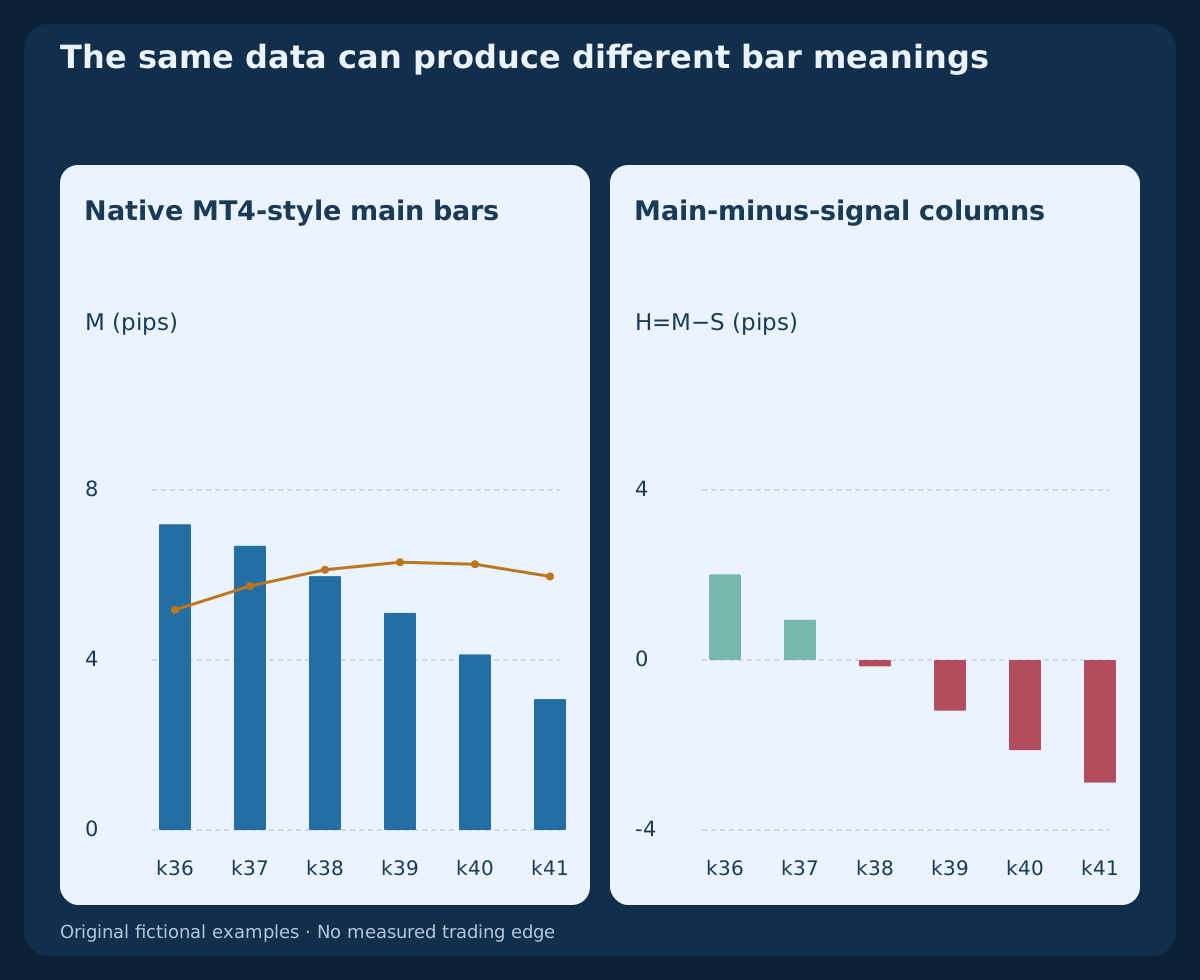
The word histogram does not identify a formula on its own. Standard MT4 draws its main series as bars, whereas a common two-line layout draws main minus signal as columns. Identify the displayed series before comparing colors or discussing an entry. This guide uses original fictional data and reports no trading performance.
2. Fix the inputs and the meaning of the periods
A familiar reference is 12 / 26 / 9 with Close. The first two periods belong to the price averages; the third averages the resulting main values. On H1, these are bar periods, not calendar days. Specify symbol, feed, timeframe, applied price and both average types.
The main series and its difference have price units and are not bounded like 0–100. Our EURUSD examples declare 1 pip=0.0001 and display M_pips=M/0.0001 for readability. Converting to pips does not normalize volatility or make different pairs directly comparable by strength. No fixed reading is a probability of profit.
3. Build the two price EMAs from declared seeds
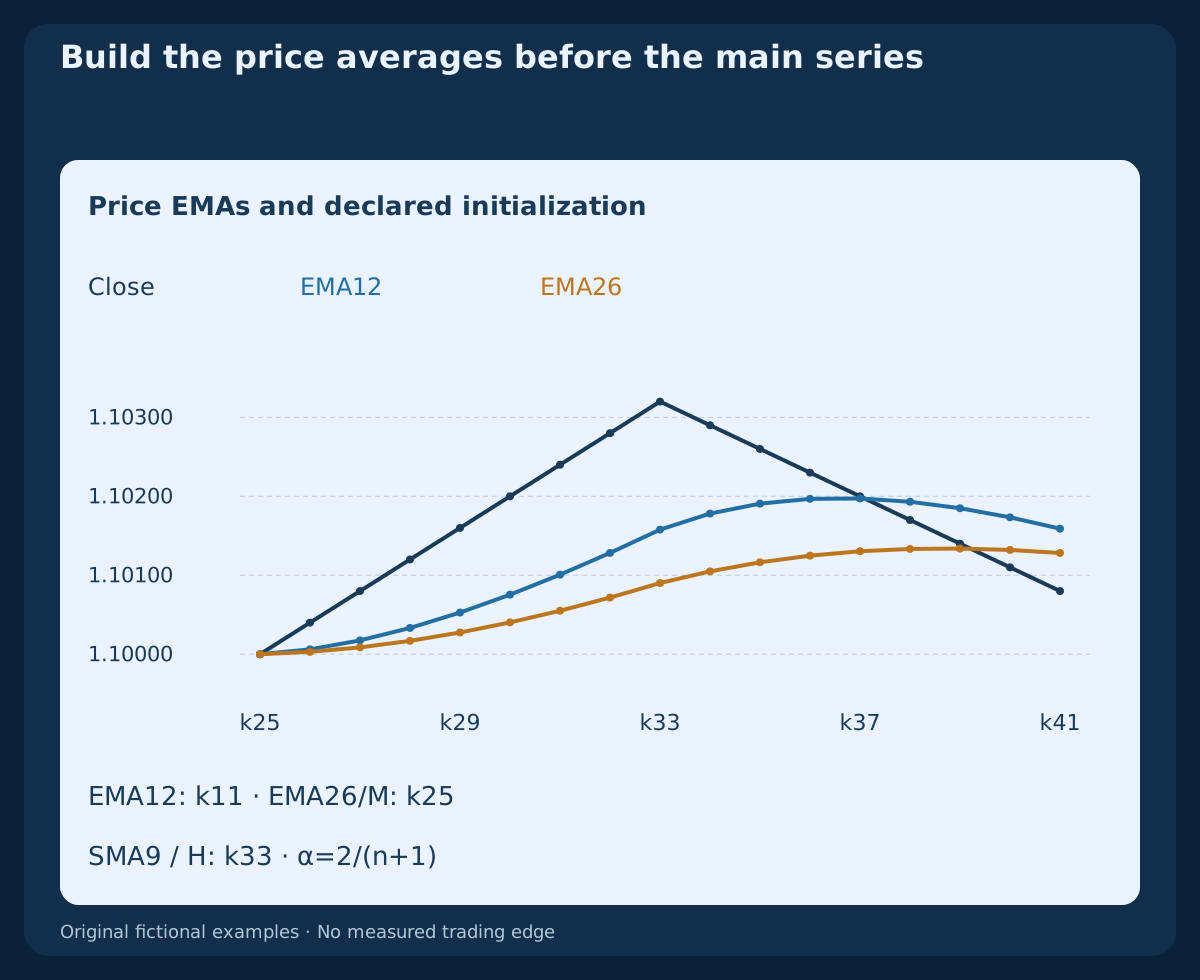
For period n use α=2/(n+1) and EMA_n(k)=αC(k)+(1−α)EMA_n(k−1). Our reference seeds each EMA with the simple mean of its first n closes. It then updates recursively; it does not repeatedly replace that history with a rolling simple average.
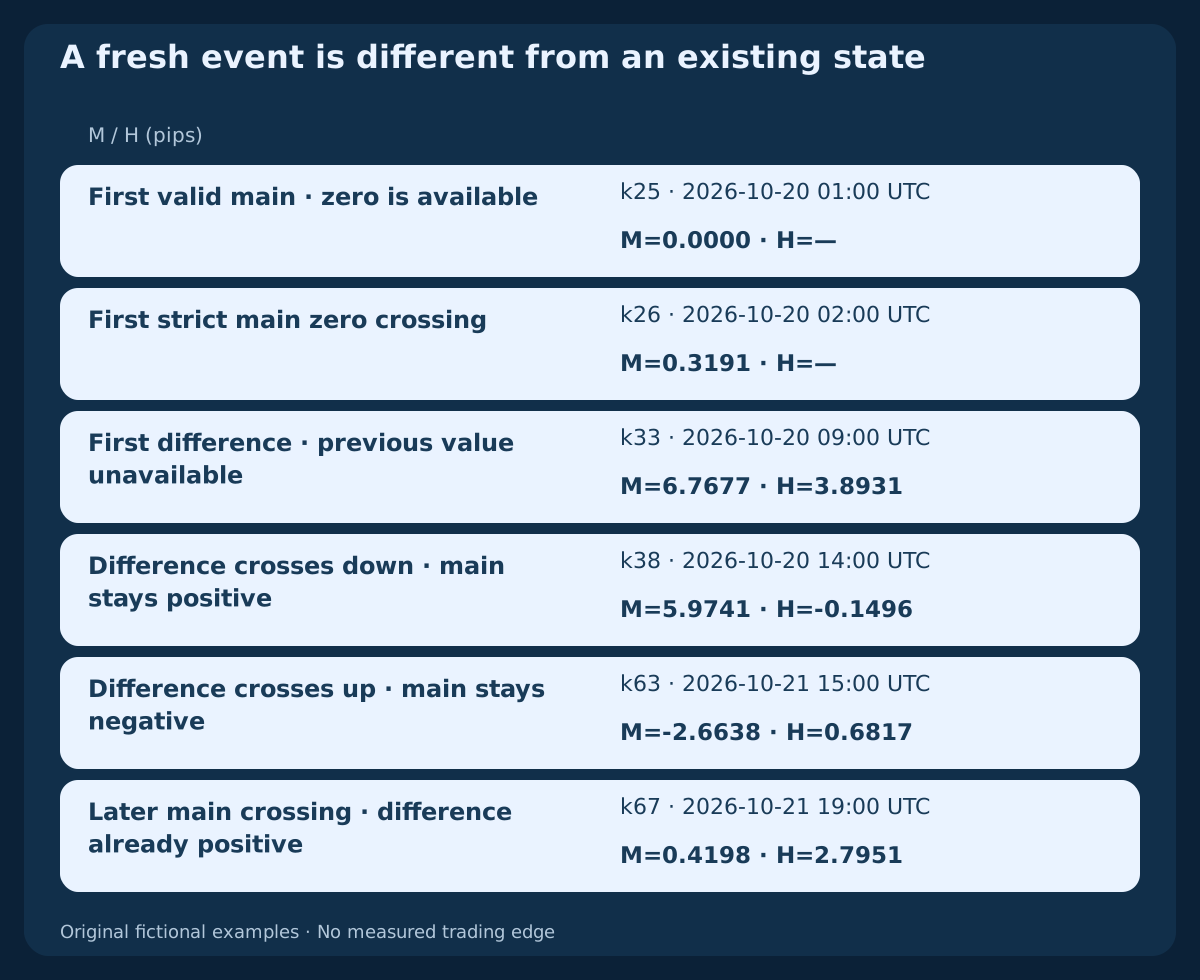
With zero-based indices, EMA12 is first valid at k11, EMA26 at k25, and M(k)=EMA12(k)−EMA26(k) begins at k25. The constructed first twenty-six closes are identical, so the first valid main value is exactly 0. That valid zero differs from unavailable earlier data. These declared seeds do not certify a terminal’s initialization.
4. Average main values to obtain the signal and difference
The MT4-style signal in this reference is S_SMA9(k)=(M(k−8)+…+M(k))/9, followed by H_SMA(k)=M(k)−S_SMA9(k). Its first valid point is k33, after nine valid main observations. A missing earlier signal is not zero and cannot retrospectively confirm a crossing.
For a separate comparison, seed a signal EMA with those same first nine main values, then use weight 2/(9+1)=0.2. Both signals agree at their common seed, then can differ. Record the actual signal method rather than assuming identical period labels produce identical readings.
5. Understand what the native MT4 bars show
The standard MT4 MACD bars represent M; the signal is its moving-average line. A difference display represents M−S, which is the OsMA relationship when inputs and signal method match. Holding the calculation fixed, the two displays can assign opposite signs to their bars at the same observation.
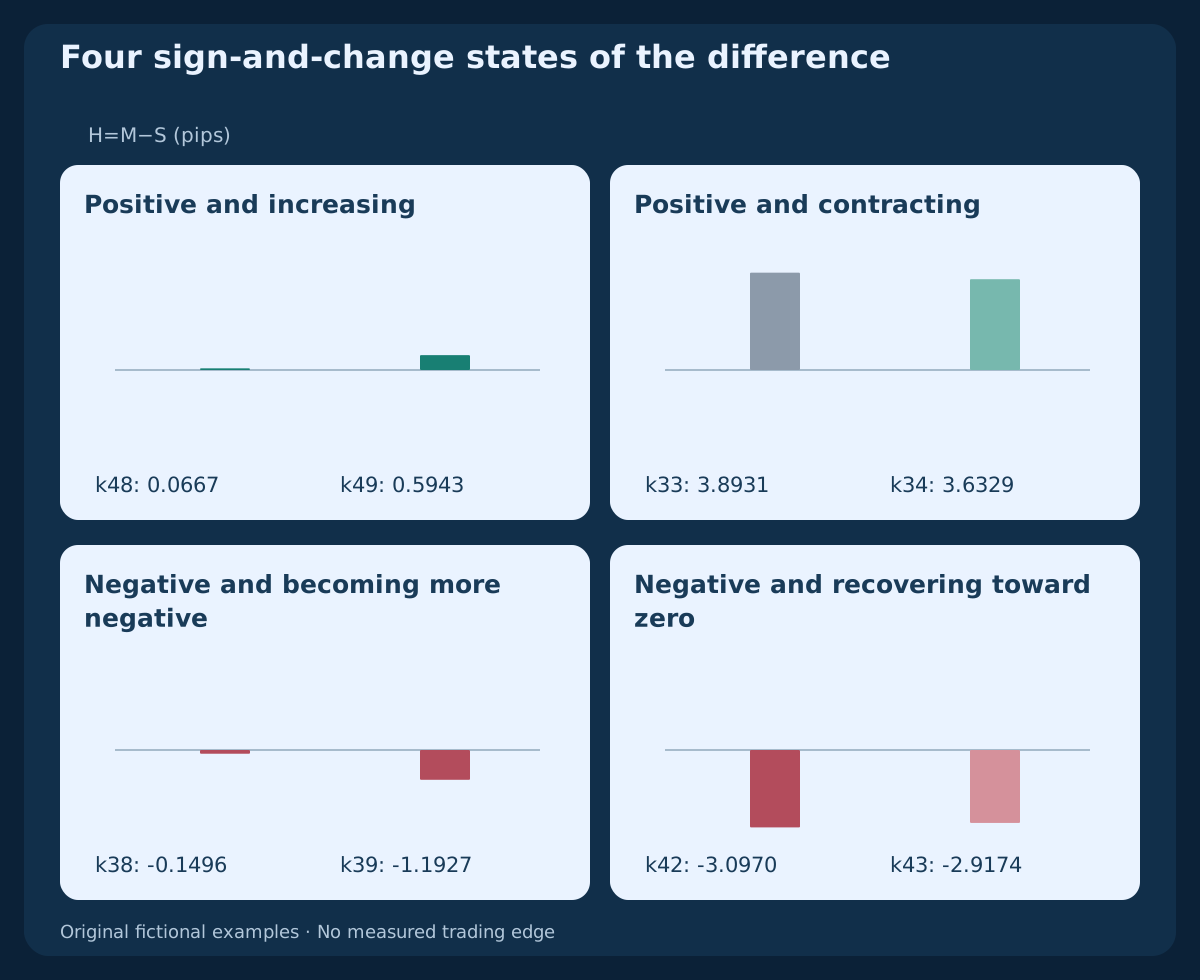
At k38, our main value is M≈5.9741 pips, the SMA signal is S≈6.1237 pips, and the difference is H≈−0.1496 pips. Main is positive while lying below signal. This does not prove that price must fall or that a short position is executable. Display values are rounded; event decisions use full precision.
6. Separate zero crossings from main/signal crossings
A fresh upward main event can be defined as M(k−1)≤0 AND M(k)>0. A fresh upward main/signal event uses H(k−1)≤0 AND H(k)>0. Current equality does not pass either strict rule. Remaining on one side is a state, not another crossing; the previous observation must be available.
In the fictional data, main first becomes positive at k26. The first available difference at k33 is positive, but has no available predecessor and is not a fresh crossing. Later the SMA difference crosses upward at k63 while main is negative; main crosses upward only at k67. No event alone supplies an order, protection or permission to retry.
7. Read column height and color as defined states
A positive difference can rise or shrink while remaining positive. A negative difference can become more negative or recover toward zero while remaining negative. For example, H(k)>0 AND H(k)<H(k−1) describes positive contraction, not a negative reading and not a completed main/signal crossing.
Column colors often encode these two comparisons, but platforms and custom scripts can assign colors differently. Name sign and change separately. An expanding gap under the chosen averaging rule is not a calibrated measure of price acceleration, and contraction cannot guarantee the next crossing. Equality or missing previous data needs an explicit treatment.
8. Compare SMA and EMA signals on the same main series
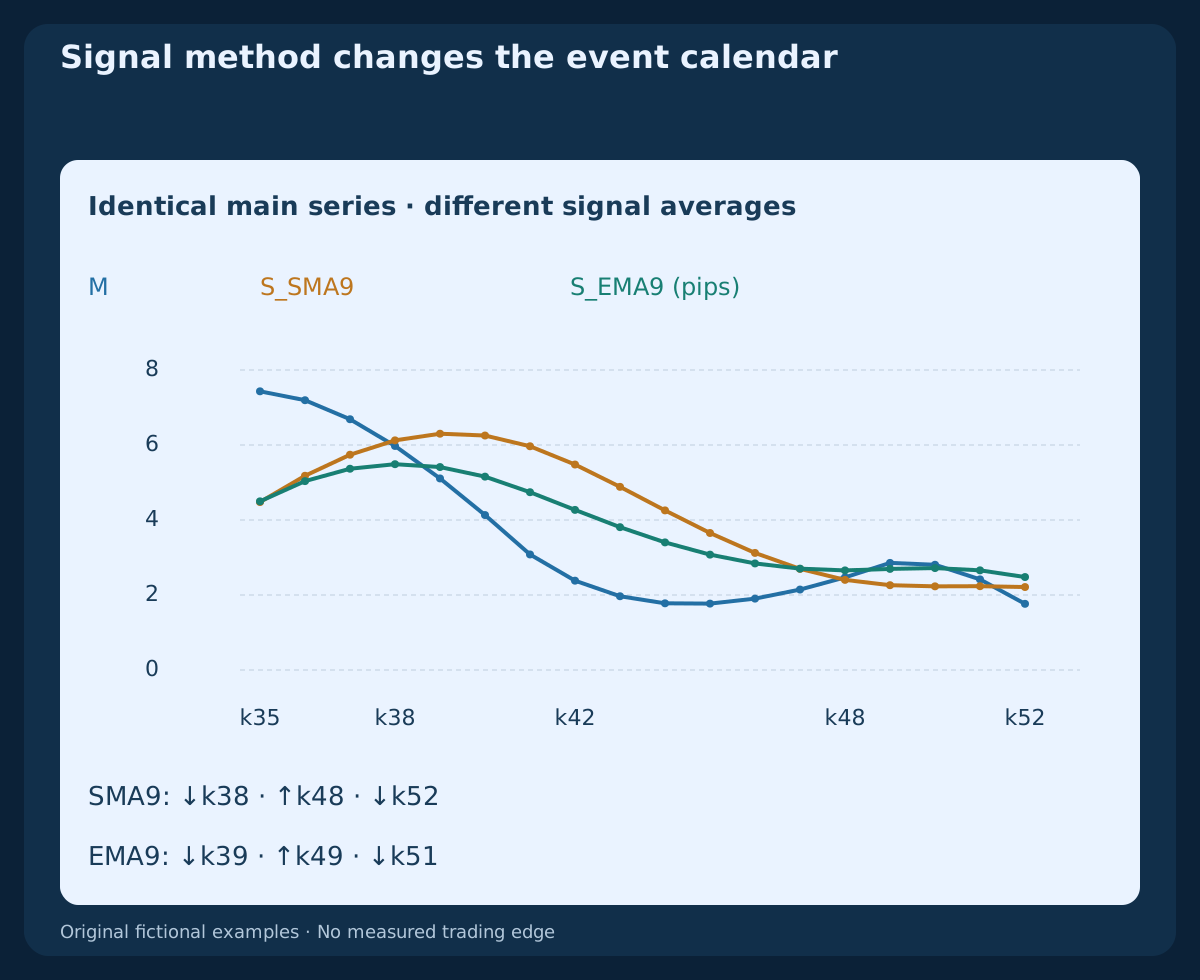
Our signal-method comparison keeps the price inputs and 12 / 26 main series unchanged. At k38, H_SMA≈−0.1496 pips while H_EMA≈+0.4858 pips. A difference in sign here comes from the signal average, not from two different price histories.
The first illustrated downward crossings occur at k38 / k39 for SMA/EMA; the next upward ones at k48 / k49. Later the EMA difference turns negative at k51, before the SMA version at k52. These observations do not establish that one method always signals earlier or performs better. Real platform parity also requires matching initialization and data.
9. Change settings through a fair comparison
The downloadable data also calculates an explicitly defined 8 / 21 / 5 alternative. Its main and SMA signal first appear at k20 / k24, versus k25 / k33 for the primary model. Compare complete readings on the common interval k33–k72; early blanks remain unavailable.
Changing price periods changes the main series, not just its appearance. Changing the signal method or length changes the main/signal event population. More frequent or earlier events do not by themselves improve results. Keep the evaluation sample and complete execution, protection and exit rules comparable when testing an alteration.
10. Use completed observations and identify the requested buffer
An illustrative MT4 call is iMACD("EURUSD",PERIOD_H1,12,26,9,PRICE_CLOSE,MODE_MAIN,1). Use MODE_SIGNAL with the same inputs for the signal. A matching difference request is iOsMA("EURUSD",PERIOD_H1,12,26,9,PRICE_CLOSE,1). Verify the broker’s actual symbol and available history.
Shift 0 is the forming bar; shift 1 is the last completed bar once the next bar and required data are available. Intrabar changes are not closed events. Record real UTC boundaries separately from broker labels, and match source, seeds, gaps and average methods. Closed-bar use does not guarantee that every custom indicator or revised history is immutable.
11. Choose the divergence series before choosing pivots
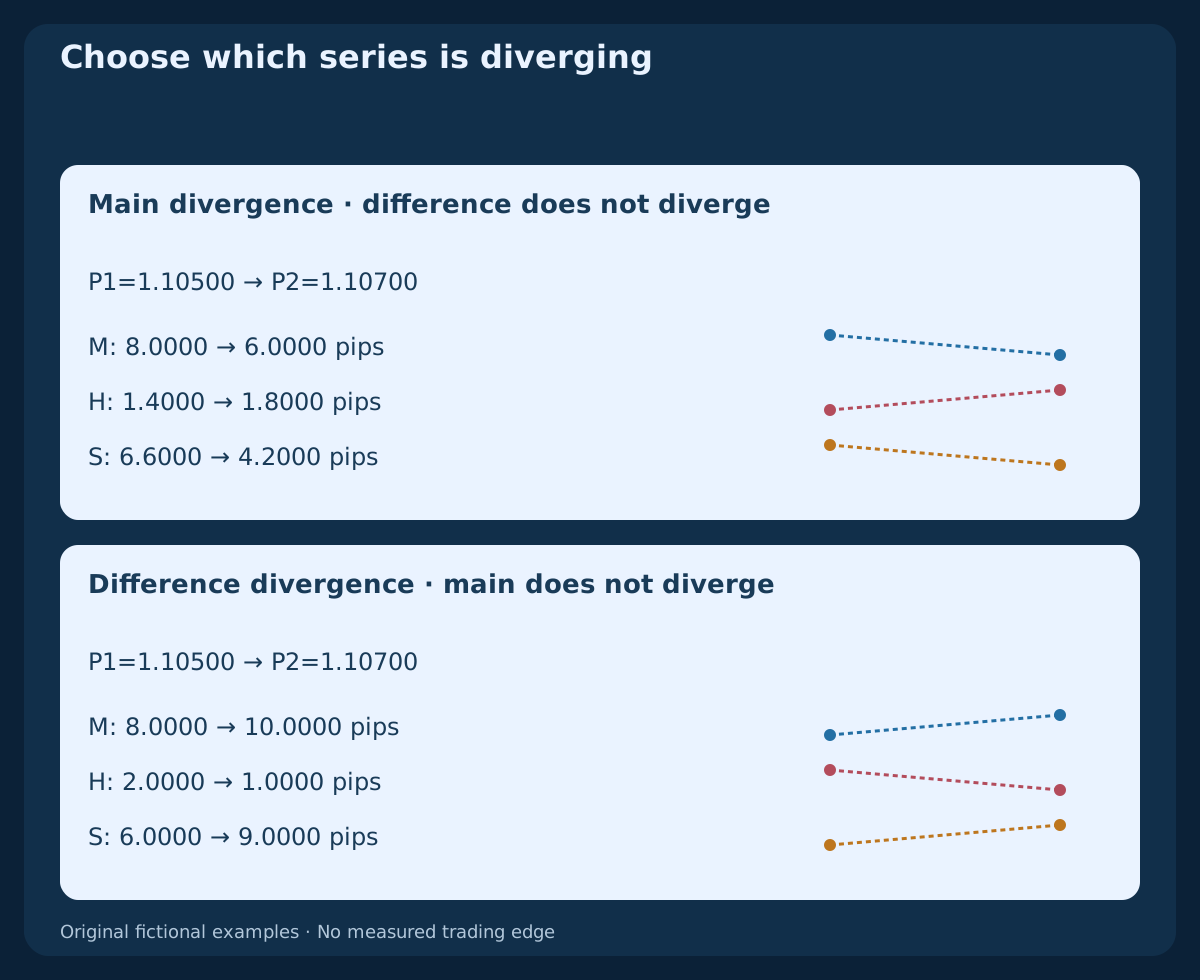
A higher price high with a lower selected indicator reading is a regular bearish divergence classification. Specify whether that reading is main or main minus signal. Comparing a main peak at one pivot with a difference peak at another mixes series. Read the selected series at the same chosen price pivots.
The second CSV supplies two independent assumed pairs: one has lower main but higher difference; the other higher main but lower difference. Their implied signals satisfy the difference identity. They are not recalculated from a complete price history. A declared strict pivot with 2 closed bars on each side is recognizable only at the close of P2+2; our close-only fixture lacks the high/low data to validate it. Divergence guarantees neither reversal nor continuation.
12. Compare MACD with RSI by the question it answers
MACD compares price averages and their separation; RSI compares smoothed gains with losses on a bounded scale. M=0 means the two selected price averages are equal. RSI=50, with positive total movement, means the smoothed gain and loss averages are equal. Those are different conditions, not interchangeable definitions of a trendless market.
Both transform overlapping price history. Their agreement does not establish independent confirmation, and disagreement need not be a platform fault. If one filters the other, define exactly which decision it changes and compare the complete rule with and without that condition. The standalone RSI guide explains its own seeds, levels and limits.
13. Separate an indicator event from executable SELL risk
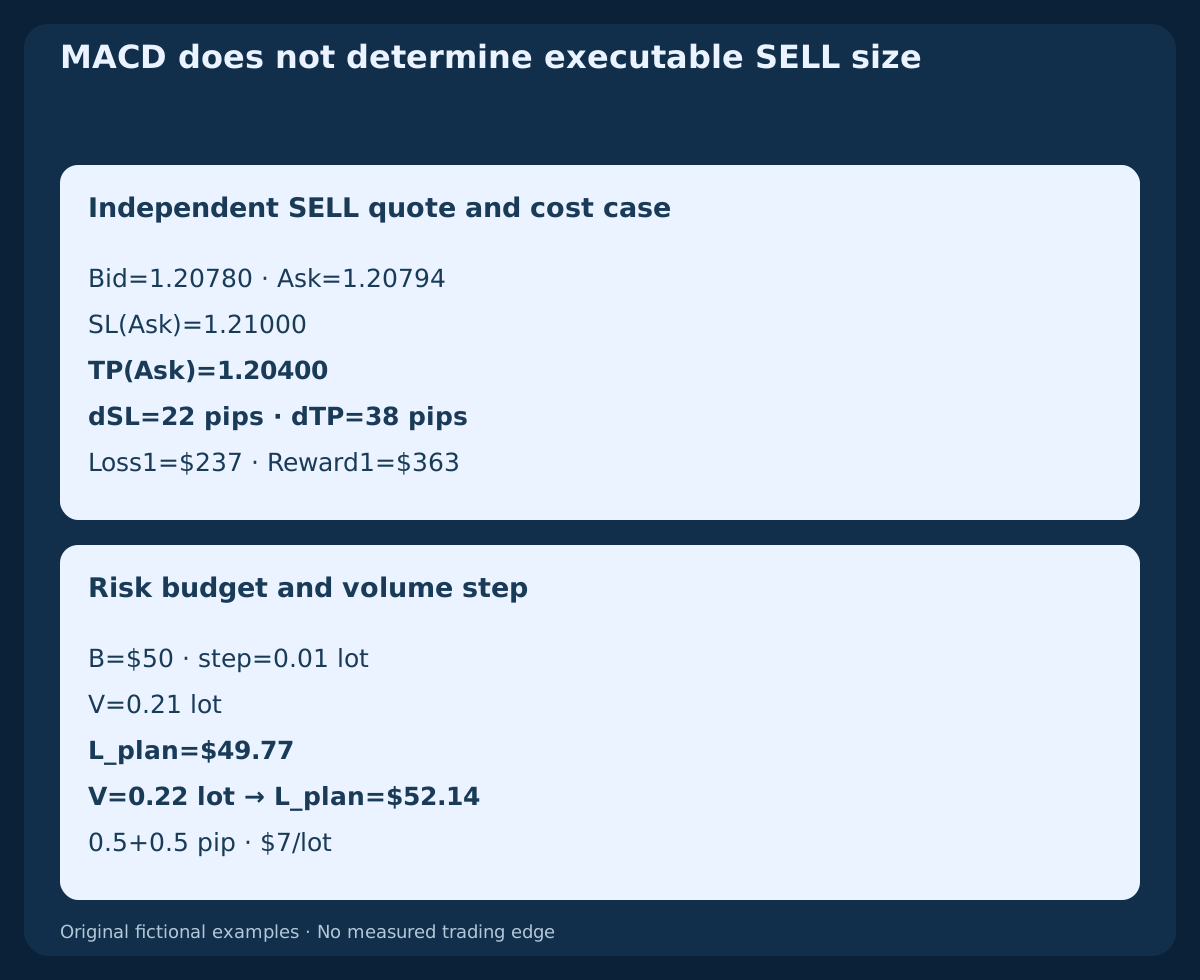
Consider an independent invented SELL accounting case: Bid=1.20780, Ask=1.20794, SL(Ask)=1.21000 and TP(Ask)=1.20400. A short enters at Bid and its protective levels are Ask-based. The distances are 22 pips to stop and 38 pips to target. This is not a trade generated by the close fixture, which contains no historical Ask path.
Assume $10/pip/lot, $7/lot round-trip commission, separate adverse allowances a_entry=0.5 pip; a_exit=0.5 pip and declared zero funding. Then Loss1=(22+1)×10+7=$237 and Reward1=(38−1)×10−7=$363. A $50 budget with 0.01-lot steps permits 0.21 lot and planned loss $49.77; 0.22 lot would risk $52.14. The price-side distances already include the quote-side effect; do not add spread again. Verify tariffs, margin, protection and actual fills. Planned allowances do not cap real losses.
14. Test a complete rule rather than an attractive display
Before testing, specify the exact series, average methods, fresh event, observation time and eligibility. Add entry timing, cancellation, stop, target, sizing, exits and uncertain-order handling. Include repeated states, rejected events, missing data and changing spreads in the record. A clean indicator plot is not a tested trading system.
Compare a baseline with and without each added condition under identical execution assumptions. Reserve evaluation data and record parameter trials. Report costs, sample size, drawdown and uncertainty. Choosing the best-looking history, settings or coloring after the outcome is known cannot establish a forward advantage.
15. Reproduce the original reference data
The main CSV contains 73 fictional EURUSD H1 Bid closes from 2026-10-19 00:00 UTC, starting at 1.10000. The first twenty-six closes are intentionally constant to make initialization visible. It includes both price EMAs, main, both signal methods and their differences, plus the alternative parameter model. No broker observations, intrabar path, Ask history or orders are supplied.
CSV indicator values use price units; the table and charts explicitly convert selected values to pips. Exports and display values are rounded, while authoring calculations use exact rational inputs. The second file contains only the two assumed divergence pairs. Neither file provides a historical backtest, measured accuracy or evidence of a profitable setting.
Download the 73 fictional H1 closes and MACD signal-method comparison (CSV)
Download the two independent assumed divergence-series pairs (CSV)
| Index | Close UTC | Bid close | M (pips) | S_SMA (pips) | H_SMA (pips) | H_EMA (pips) |
|---|---|---|---|---|---|---|
| 38 | 2026-10-20 14:00 UTC | 1.10170 | 5.9741 | 6.1237 | -0.1496 | 0.4858 |
| 39 | 2026-10-20 15:00 UTC | 1.10140 | 5.1082 | 6.3009 | -1.1927 | -0.3041 |
| 48 | 2026-10-21 00:00 UTC | 1.10220 | 2.4700 | 2.4033 | 0.0667 | -0.1859 |
| 49 | 2026-10-21 01:00 UTC | 1.10240 | 2.8558 | 2.2614 | 0.5943 | 0.1599 |
| 63 | 2026-10-21 15:00 UTC | 1.10100 | -2.6638 | -3.3455 | 0.6817 | 0.0992 |
| 67 | 2026-10-21 19:00 UTC | 1.10170 | 0.4198 | -2.3753 | 2.7951 | 1.8102 |
16. Keep a practical reading checklist
Before accepting a MACD observation, identify symbol, feed, timeframe, applied price, history origin, seed, both average methods and the actual series being drawn. Then distinguish a current state from a new strict event. For divergence, add pivot selection and the later recognition time. A missing required value remains a limitation, not an invented zero.
Only a separate complete trading specification can connect those observations to entry, protection, volume and exits. The linked combination and strategy articles define other questions and rules. Preserve an unchanged baseline so that added confirmation, delay and execution costs can be evaluated rather than assumed beneficial.
Frequently asked questions
What do the usual MACD 12/26/9 settings mean?
The first two periods define the price averages;the third defines the signal average of main. State the average types and applied price too. Familiar settings are not a universally profitable choice.
Are native MT4 MACD bars the difference between main and signal?
No. Standard MT4 plots main as bars. A matching main-minus-signal calculation is the OsMA relationship. A two-line MACD display may use difference columns, so identify the formula before comparing signs or colors.
Can main be positive while its histogram difference is negative?
Yes. Main can be above zero but below its signal. The fictional k38 observation demonstrates that combination. It is not itself a short order or proof of future price direction.
Why do SMA and EMA signals cross on different bars?
They weight the same main observations differently. Our declared seeds agree at initialization, then diverge. Neither method is guaranteed to signal earlier at every turn. Actual platform comparisons also require matching data and initialization.
Does a MACD crossing guarantee a profitable trade?
No. A crossing is an observation under a chosen definition. Entry, protection, position size, exits, costs and execution must be specified and evaluated separately. These fixtures report no trading performance.
Do MACD and RSI provide independent confirmation?
Not automatically. Both transform overlapping price history. Give each condition a defined role and compare the full method with and without the added filter under identical execution assumptions.
Sources and research notes
Primary platform references support formulas, buffer inputs and display distinctions. The close history, seeds, event comparisons, assumed divergence pairs and SELL accounting are original educational constructions. They do not certify broker/platform initialization parity or establish trading profitability.
Educational MACD guide. Fictional closes, declared reference seeds, independent assumed pairs and quote accounting;no actual orders, historical backtest or measured profitability.