

CCI measures how far the current typical price lies from its rolling average, scaled by the window’s mean absolute deviation. A high reading describes relative price strength; it does not schedule a reversal. Real EUR/USD examples below separate an individual candle’s direction, a return through −100 and a zero crossing. This is an indicator guide with reproducible historical calculations.
1. What CCI measures
For each completed group, typical price TP = (High + Low + Close)/3. CCI compares the current TP with the simple average of the latest N typical prices. Its sign locates TP relative to that average. CCI has no fixed upper or lower bound and is neither a percentage return nor a number of pips.
2. The real prices and declared H4 clock
These are original Forexite EUR/USD minute quote records for January–February 2024. Winter CET is converted to UTC by subtracting one hour. We group published record timestamps in (end − 4 hours, end], ending at 00:00, 04:00, 08:00, 12:00, 16:00 and 20:00 UTC. The label is the group end. Short market-opening and closing groups remain; missing prices are not filled. This convention can differ from a broker’s native H4 candles.
3. Calculate TP, its average and CCI(20)
With N = 20, include the current completed group and the previous 19 observed groups. Calculate their 20 typical prices, then their arithmetic mean SMA(TP,20). For this same window, average the absolute distance of every TP from that one current mean. Divide the current TP minus the mean by 0.015 times that mean absolute deviation.
Twenty observations are sufficient for the first CCI(20), at zero-based index 19. No EMA seed or extra smoothing stage is used here. Retain the original four-decimal quotes and full calculation precision; rounded intermediate values are for reading, not replay.
TP[t] = (High[t] + Low[t] + Close[t]) / 3
SMA[t] = Σ TP[j] / N
MD[t] = Σ |TP[j] − SMA[t]| / N
j = t−N+1, …, t
CCI[t] = (TP[t] − SMA[t]) / (0.015 × MD[t])
MD[t] = 0 → CCI[t] = 0
4. Mean absolute deviation is not standard deviation
Each distance in the denominator uses the current window’s common mean. Do not subtract a different historical rolling mean from each old TP and then average those residuals. Do not substitute standard deviation, which squares deviations and takes a square root. Both changes produce a different indicator.
If all N typical prices are identical, the denominator is zero. This viewer explicitly returns CCI = 0 by convention. That is a handling rule, not evidence of a directional signal. Identical typical prices do not require identical OHLC candles.
5. A worked calculation from the actual quotes
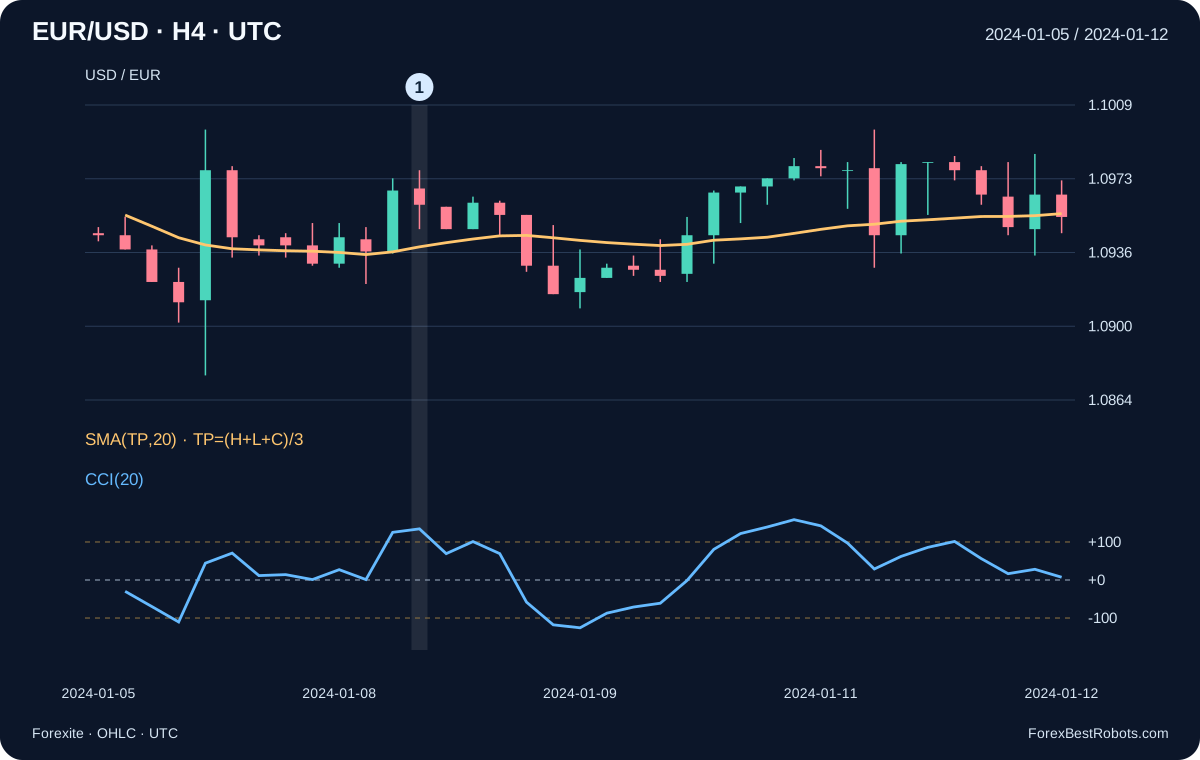
At 2024-01-08 20:00 UTC, high is 1.0977, low 1.0948 and close 1.0960. TP is 1.096166667; the 20-group mean is 1.093928333 and mean absolute deviation is 0.001109333. Using unrounded inputs, CCI(20) = 134.515224. The source quotes still have four decimal places; extra displayed decimals describe derived averages, not more precise market prices.
6. Read zero and ±100 in the right units
For a nonzero denominator, CCI = +100 places TP 1.5 mean absolute deviations above the current mean; −100 places it equally far below. Zero means TP equals the mean, apart from the stated zero-deviation convention. The constant 0.015 scales the ratio. It does not make CCI bounded by ±100, establish a guaranteed coverage percentage or measure a probability of reversal.
7. Above +100 can coexist with a falling candle
The highlighted group on 2024-01-08 20:00 UTC opens at 1.0968 and closes at 1.0960, while CCI(20) is +134.515224. The candle closes below its own open, yet its typical price remains well above the 20-group mean. This is the first January group matching those two conditions after CCI becomes available. The marker illustrates two different comparisons; it is not an instruction to sell.
8. Require two valid values for a fresh crossing
A fresh move above +100 requires previous CCI ≤ +100 and current CCI > +100. A fresh return above −100 uses previous CCI ≤ −100 and current CCI > −100. A fresh zero crossing uses previous CCI ≤ 0 and current CCI > 0. Reverse the inequalities for downward crossings. Equality on the current value does not complete these strictly defined crosses. A persistent reading above a level is a state, not a new event every group.
+100 ↑: CCI[t−1] ≤ +100; CCI[t] > +100
−100 ↑: CCI[t−1] ≤ −100; CCI[t] > −100
   0 ↑: CCI[t−1] ≤    0; CCI[t] >    0
9. Returning above −100 is not crossing zero
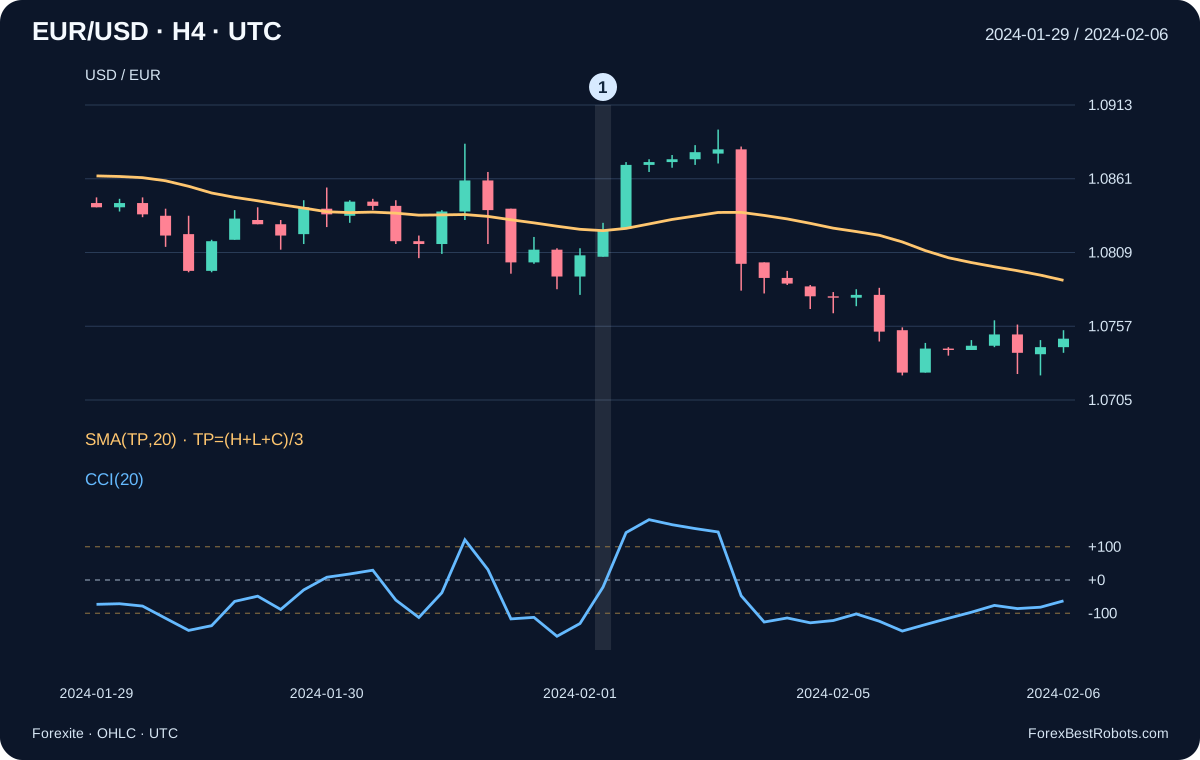
At 2024-02-01 16:00 UTC, CCI(20) changes from −130.989747 to −21.438451. It freshly returns above −100 but remains below zero. The close is 1.0825 and TP is 1.082033333, below its 20-group mean of 1.082446667. This is the first February group meeting that return-and-still-negative condition. The observation alone supplies no executable entry or profitable outcome.
10. Compare periods 14, 20 and 50 on the same date
The viewer offers N = 14, 20 and 50. At 2024-02-01 16:00 UTC, their CCI readings are −24.838710, −21.438451 and −80.681241 respectively. Changing N changes both the center and the scale, so a longer period need not produce a smaller absolute reading on every candle. Compare common dates with enough data: first valid zero-based indices are 13, 19 and 49. Earlier history outside an unchanged N-group window does not affect this rolling calculation.
11. Inspect one completed group and its calculation
Choose a period and a UTC group end. Use Previous / Next to move one observed group. The chart ends at the selected group, and the values below identify its exact calculation window. Changing N keeps the same date when enough history exists; otherwise it moves to the first valid group.
Browse by observed group number
Use the date and the Open/High/Low/Close values to identify the candle. The chart scrolls horizontally on narrow screens so its labels remain readable.
- Completed H4 group end (UTC)
- —
- Open price
- —
- High price
- —
- Low price
- —
- Close price
- —
- Current typical price TP
- —
- Window mean SMA(TP,N)
- —
- Mean absolute deviation
- —
- TP minus the window mean
- —
- CCI — dimensionless
- —
- Observed groups in the window
- —
- First group end in the window (UTC)
- —
- Last group end in the window (UTC)
- —
- Minute records in the selected group
- —
Show the calculation
12. Match MT4 inputs before comparing values
Match symbol feed, timeframe, completed-group boundaries, period and applied price. Here the applied price is typical price, not Close alone. In MQL4, iCCI accepts a period, applied_price and shift; shift 1 refers to the preceding bar in that chart’s series. A live chart’s shift 0 can change before its candle closes. Agreement with this guide also requires the same source OHLC and grouping convention.
iCCI(NULL, PERIOD_H4, 20, PRICE_TYPICAL, 1)
13. What an indicator reading still leaves undefined
A complete strategy needs entry timing, rejection and expiry rules, stop and target levels, position sizing, overlap handling and trading costs. A high CCI can accompany continuation as well as a later reversal. Divergence also needs explicit pivot and recognition rules; none are retroactively added to these examples.
The supplied records do not contain an observed Ask series, historical spread, commission, slippage or tick order. OHLC alone does not establish executable fills or which intrabar extreme occurred first. This guide reports indicator calculations, not trades, win rates or account returns. Trading rules require a separate evaluation with appropriate execution evidence.
Frequently asked questions
Does CCI above +100 mean I should sell?
It says the current typical price is relatively far above its rolling mean. It does not identify the time of a reversal, an entry or a stop. A trading rule needs separate evidence.
Is CCI = 100 a 100% return?
No. CCI is a dimensionless ratio. For a nonzero denominator, +100 corresponds to TP being 1.5 mean absolute deviations above its current mean.
Why does my MT4 CCI differ?
Check the source quotes, completed-bar clock, period and applied price. This guide uses typical price and a declared UTC grouping of Forexite minute timestamps, which can differ from broker H4 bars.
Is a move back above −100 also a zero crossing?
No. In the February example, CCI returns from −130.989747 to −21.438451. It has crossed −100 upward but is still below zero.
Data, timing and reproducibility
The source is 60 original daily Forexite MetaStock archives for January–February 2024. Their SHA-256 and ZIP CRC were checked before extraction. The included minute CSV preserves each source filename, its original CET timestamp, converted UTC and unchanged four-decimal EUR/USD OHLC.
The extraction contains 61,972 minute records and 266 H4 groups. Each group uses its first observed open, highest high, lowest low and last observed close. The final group cut off by the source-data boundary is omitted; 17 short or sparse groups are retained with their source counts. No missing prices or weekend candles are inserted. CCI(20) has 247 valid values.
The download includes the used minute records, aggregate prices and CCI values, source URLs and hashes, the declared calculation and offline replay checks. Reproducing these values is separate from establishing a profitable trading strategy.
- H4 prices, typical price, mean deviation and CCI (CSV)
- Minute records, provenance and offline calculation (ZIP)