

Williams %R locates the latest close inside a rolling high–low range. A reading near zero means a close near the range high; it does not mean that the next candle must fall. This guide follows actual GBP/USD quotes through the formula, changing extremes and two different threshold events. The interactive viewer shows which completed groups produce each value.
1. What Williams %R measures
For a chosen N, HH is the highest High and LL the lowest Low among the latest N completed groups. Williams %R compares the distance from HH to the current Close with the whole HH−LL range. For valid OHLC and a positive range, its value lies between −100 and 0. It is a scaled position inside that range, not an investment return or a probability.
2. Real GBP/USD prices and the H4 clock
The source is Forexite minute quote records for January–February 2024. We subtract one hour from winter CET to obtain UTC, then group record timestamps in (end − 4 hours, end], ending at 00:00, 04:00, 08:00, 12:00, 16:00 and 20:00 UTC. A label identifies the group end. Short opening and closing groups remain; missing prices are not filled. These groups can differ from a broker’s native H4 candles.
3. Calculate %R(14) from one complete window
With N = 14, include the current completed group and the previous 13 observed groups. Find the highest High and lowest Low of that same window. Subtract the current Close from HH, divide by HH−LL and multiply by −100. Do not average the highs or lows, use only the current candle’s range, or add smoothing to this raw calculation.
The first result requires 14 observations, at zero-based index 13. The calculation uses the original four-decimal quotes without rounding intermediate values. Earlier history outside the unchanged N-group window cannot affect this raw %R.
HH[t] = max(High[j]); LL[t] = min(Low[j])
j = t−N+1, …, t
%R[t] = −100 × (HH[t] − Close[t]) / (HH[t] − LL[t])
HH[t] = LL[t] → %R[t] = —
4. Handle a zero range without inventing a reading
If HH = LL, the denominator is zero and the ratio is undefined. This viewer displays a dash and an explanation, not 0 or −100. It draws no oscillator point and accepts no crossing from that unavailable value. A platform may use another convention; match that convention explicitly before comparing outputs.
The downloaded historical sample has no zero-range window for periods 7, 14 or 28. Flat-window cases are checked separately in the calculation tests; they are not inserted into the market charts.
5. A complete calculation from actual quotes
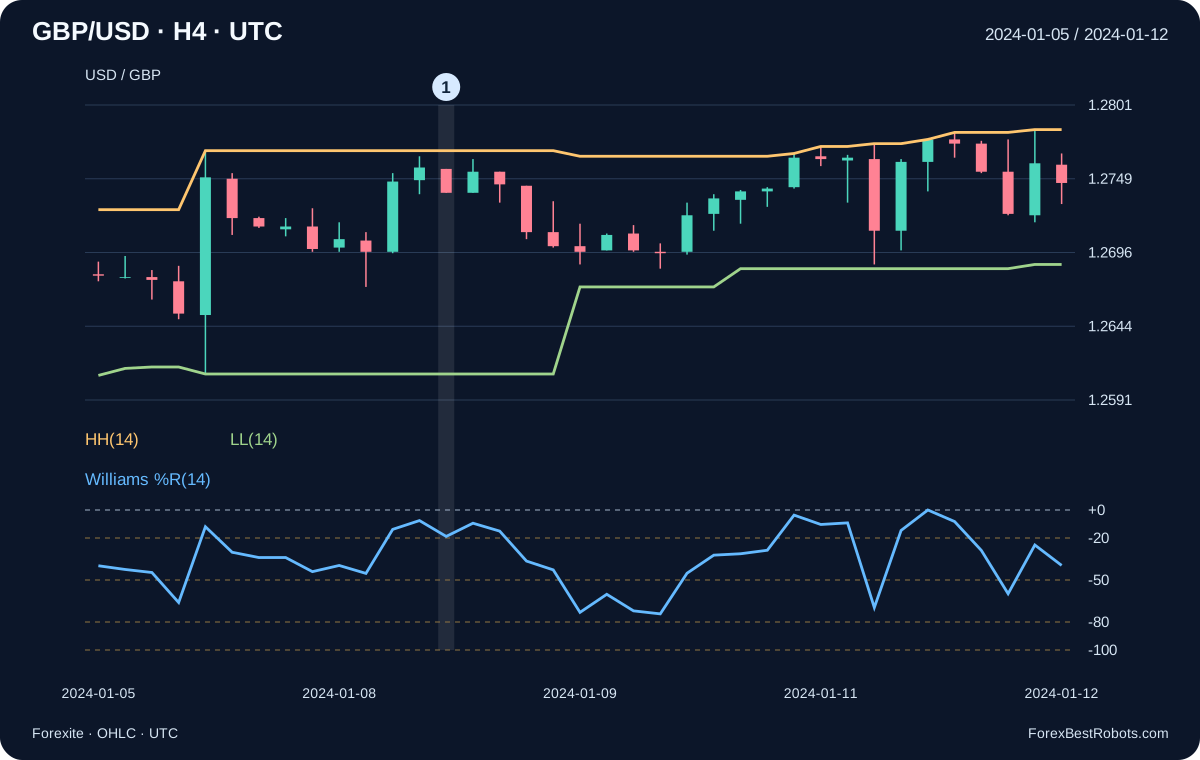
For the group ending 2024-01-09 00:00 UTC, the 14-group window starts at 2024-01-05 00:00 UTC. HH is 1.2769, LL is 1.2610 and Close is 1.2739. The numerator is 0.0030 and the range is 0.0159, giving %R(14) = −18.867925. More displayed decimals describe the calculated ratio; they do not add precision to the four-decimal source quotes.
6. Read −20, −50 and −80 in the correct units
With a positive range, −20 places the close one fifth of the range below HH; −80 places it four fifths below HH. At −50, the close equals (HH+LL)/2, the range midpoint—not a moving average. A close at HH produces 0; a close at LL produces −100. The familiar overbought and oversold labels describe location, not the timing of a reversal.
7. Separate candle direction from changing range position
The marked January group opens at 1.2756 and closes lower at 1.2739, yet %R(14) remains above −20 at −18.867925. The preceding reading was −7.547170. Both closes occupy the upper fifth of their respective rolling ranges; the current candle’s downward direction is a different comparison. This is the first January group with a valid %R(14) above −20 and Close below Open.
The range itself also moves. At 2024-02-07 12:00 and 16:00 UTC, Close is unchanged at 1.2629, but HH rises from 1.2636 to 1.2640 while LL stays at 1.2517. %R(14) changes from −5.882353 to −8.943089. More generally, a new extreme or an old extreme leaving the window can change %R without an equivalent change in Close.
8. Define a fresh threshold crossing
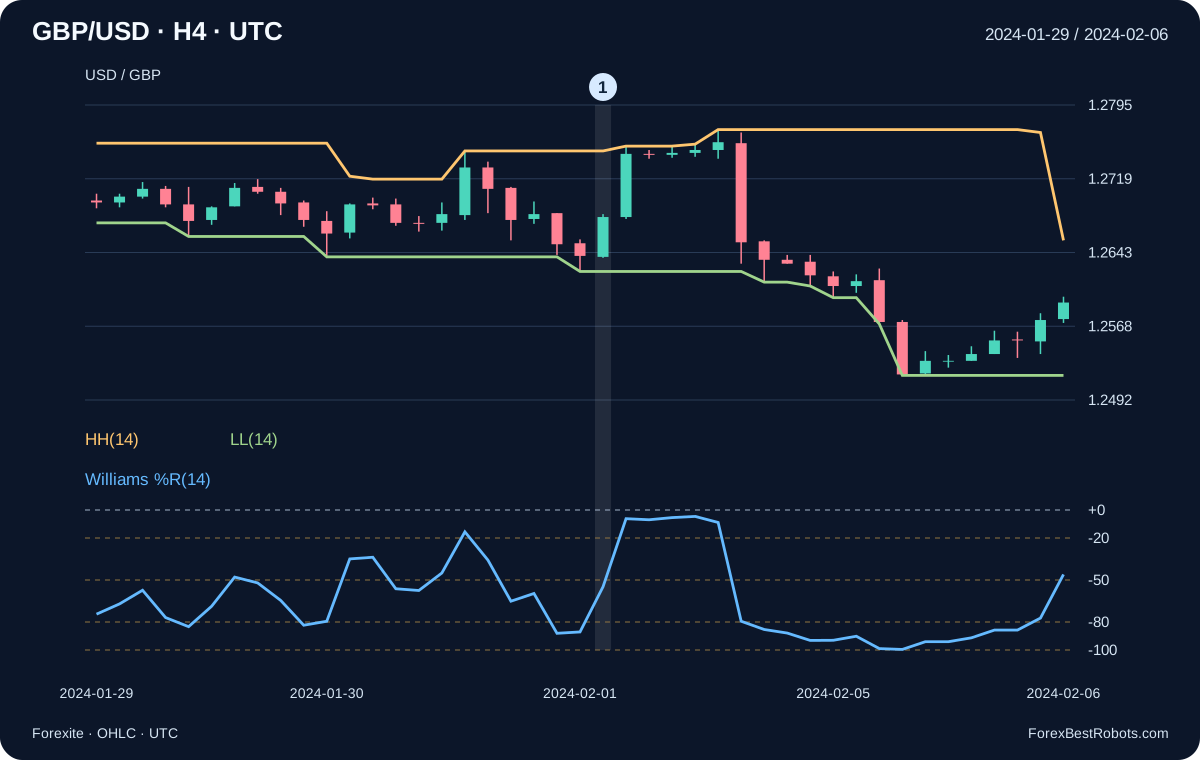
For a fresh return above −80, require previous %R ≤ −80 and current %R > −80. A fresh move above −50 instead requires previous %R ≤ −50 and current %R > −50. A fresh exit below −20 requires previous %R ≥ −20 and current %R < −20. Both readings must exist. Equality on the current reading does not complete these strictly defined crossings, and remaining beyond a level is not a new crossing every group.
−80 ↑: %R[t−1] ≤ −80; %R[t] > −80
−50 ↑: %R[t−1] ≤ −50; %R[t] > −50
−20 ↓: %R[t−1] ≥ −20; %R[t] < −20
9. A return above −80 can remain below the midpoint
At 2024-02-01 16:00 UTC, %R(14) rises from −87.096774 to −54.838710. It crosses −80 upward but stays below −50. HH is 1.2748, LL is 1.2624 and Close is 1.2680; the midpoint is 1.2686. This is the first February group with that fresh return while still below −50. A trading system would still need its own entry timing, rejection and risk rules.
10. Compare periods 7, 14 and 28 on the same date
At 2024-01-09 00:00 UTC, %R(7) is −27.956989, %R(14) is −18.867925 and %R(28) is −18.750000. The close is identical; each period chooses its own range. A longer lookback need not move the reading closer to −50 on every candle. First valid zero-based indices are 6, 13 and 27. The viewer preserves the selected date when sufficient history exists and otherwise moves to the first valid group.
11. Inspect the selected candle and its rolling range
Choose a period and a UTC group end. Use Previous / Next to move one observed group. The chart ends at the selected group. The values identify its exact N-group window, range extremes and raw %R calculation.
Browse by observed group number
Identify the candle by its UTC end and Open/High/Low/Close values. HH and LL are rolling window extremes, not just the selected candle’s high and low. On narrow screens, scroll the chart horizontally to read its labels.
- Completed H4 group end (UTC)
- —
- Open price
- —
- High price
- —
- Low price
- —
- Close price
- —
- Highest High in the window: HH
- —
- Lowest Low in the window: LL
- —
- Window range: HH−LL
- —
- HH minus the current Close
- —
- Williams %R: −100 to 0
- —
- Unsmoothed Fast %K: 0 to 100
- —
- Observed groups in the window
- —
- First group end in the window (UTC)
- —
- Last group end in the window (UTC)
- —
- Minute records in the selected group
- —
Show the calculation
12. Compare raw Fast %K and MT4 settings carefully
On the same OHLC window, unsmoothed Fast %K = 100 × (Close−LL)/(HH−LL), so Williams %R = Fast %K − 100. The worked January value corresponds to Fast %K = 81.132075. This identity does not apply unchanged to a smoothed %K or %D line. Matching two transformed versions of the same range position is not independent confirmation.
In MQL4, iWPR takes symbol, timeframe, period and shift; it has no applied-price parameter. The example requests period 14 on H4 at shift 1, the preceding bar in that chart’s series. Shift 0 can change while a live candle forms. Match source OHLC, clock, completed-bar status and zero-range handling before comparing with this guide.
Fast %K = 100 × (Close − LL) / (HH − LL)
Williams %R = Fast %K − 100
iWPR(NULL, PERIOD_H4, 14, 1)
13. What remains to be tested in a trading strategy
These are indicator calculations, not simulated trades or a claim of profitability. The source supplies no observed Ask series, historical spread, commission, slippage or tick order. Candle extremes alone cannot establish executable fills or the sequence of an intrabar stop and target. A complete strategy needs frozen entry, exit, sizing and overlap rules, explicit costs and a separate evaluation.
Frequently asked questions
Does Williams %R above −20 mean I should sell?
It means Close is in the upper fifth of the selected high–low range. The January example has a falling candle while %R remains above −20. The indicator alone does not set an entry or the time of a reversal.
Is a return above −80 the same as a −50 crossing?
No. In the February example, %R moves from −87.096774 to −54.838710. It crosses −80 upward while remaining below the range midpoint at −50.
Why can %R change when Close stays the same?
HH and LL belong to a moving window. A new extreme or an old extreme leaving it changes the denominator and may change the numerator. On 7 February, the close stays at 1.2629 while HH increases and %R changes.
Is Williams %R identical to MT4’s Stochastic lines?
Only the raw, unsmoothed Fast %K on the same OHLC window has the identity %R = Fast %K − 100. Smoothing, %D, source prices, bar clocks and flat-range conventions can break a direct comparison.
Data, timing and reproducibility
The source comprises 60 original daily Forexite MetaStock archives for January–February 2024. Their SHA-256 hashes and ZIP CRC were checked when this guide was first prepared. The minute CSV preserves each source filename, original CET timestamp, converted UTC and unchanged four-decimal GBP/USD OHLC.
The extraction contains 61,972 minute records and 266 H4 groups. Each group uses its first observed Open, highest High, lowest Low and last observed Close. The final group cut off by the source-data boundary is omitted; 17 short or sparse groups are retained with their counts. There are 253 valid %R(14) values. No missing quotes or weekend candles are inserted.
The download includes the used minute records, H4 quotes, rolling extremes, %R for 7/14/28, source URLs and hashes, plus an offline calculation and verification script. Its purpose is to reproduce the indicator values; it does not establish trading performance.
- H4 prices, rolling extremes and Williams %R (CSV)
- Minute records, source provenance and offline calculation (ZIP)