

A rising ADX does not tell you to buy. ADX summarizes the recent separation of two directional indicators, while +DI and −DI show which side dominates that comparison. This guide follows real USD/JPY prices through raw directional movement, Wilder smoothing and the first available ADX. The interactive viewer keeps the original calculation history when you choose another candle.
1. What +DI, −DI and ADX represent
DMI combines positive and negative directional movement with a true-range scale. +DI above −DI means the smoothed positive component is larger; the reverse means the negative component is larger. DX measures their relative separation, and ADX smooths DX. These are scaled indicator values, not probabilities or account returns. ADX can rise during either upward or downward price movement.
2. Actual USD/JPY prices and the H4 clock
The source is Forexite minute quote records for January–February 2024, with original two-decimal USD/JPY OHLC. Winter CET is converted to UTC by subtracting one hour. We group record timestamps in (end − 4 hours, end], ending at 00:00, 04:00, 08:00, 12:00, 16:00 and 20:00 UTC. Labels identify the group end. Short opening and closing groups remain; missing quotes are not filled. A broker’s native H4 candles can use another clock.
3. Calculate raw directional movement and true range
Let Up = current High − previous High and Down = previous Low − current Low. +DM equals Up only when Up > 0 and Up > Down; otherwise it is zero. −DM equals Down only when Down > 0 and Down > Up; otherwise it is zero. Equal positive extensions set both to zero. Inside groups also contribute zero directional movement. This compares consecutive ranges, not the candle’s Close with its Open.
TR is the greatest of High−Low, |High−previous Close| and |Low−previous Close|. It includes a gap from the previous close even if that price lies outside the current group’s range. With no previous group, this guide leaves the first TR and DM unavailable rather than inventing a transition.
Up = High[t] − High[t−1]; Down = Low[t−1] − Low[t]
+DM = Up if Up > 0 and Up > Down; otherwise 0
−DM = Down if Down > 0 and Down > Up; otherwise 0
TR = max(High − Low, |High − previous Close|, |Low − previous Close|)
4. Apply Wilder smoothing, then calculate DI and DX
For period N, seed each smoothed sum with the first N actual transitions. Thereafter, update S = previous S − previous S/N + current raw value. Apply the same procedure to TR, +DM and −DM. Then +DI = 100 × S_+DM/S_TR and −DI = 100 × S_−DM/S_TR. DX is 100 times their absolute difference divided by their sum.
A smoothed sum is not the raw sum of only the latest N transitions. Its equivalent smoothed average is S/N. If S_TR is zero, this implementation explicitly sets both DI values to zero; if their sum is zero, it sets DX to zero. ADX then continues smoothing those DX values. These are declared zero-denominator conventions.
S[t] = S[t−1] − S[t−1]/N + raw[t]
+DI = 100 × S_+DM / S_TR; −DI = 100 × S_−DM / S_TR
DX = 100 × |+DI − (−DI)| / (+DI + (−DI))
5. Identify the first ADX and its recursive history
The first price group is index 0 and the first transition is index 1. For N = 14, seed TR and DM from transitions 1 through 14. The first DI and DX therefore appear at index 14, requiring 15 price groups. Average the 14 DX values at indices 14 through 27 to seed the first ADX at index 27. Later ADX = (previous ADX × 13 + current DX)/14.
This is Wilder smoothing with weight 1/N, not the ordinary EMA weight 2/(N+1). Different initial bars or seeds can leave differences long after the first output. The viewer always calculates from the first included group, 2024-01-02 00:00 UTC; moving the chart’s visible edge does not restart it. A first available value is not a claim that every platform has converged to it.
S[N] = sum(raw[1] … raw[N])
ADX[2N−1] = mean(DX[N] … DX[2N−1])
ADX[t] = (ADX[t−1] × (N−1) + DX[t]) / N
6. Follow one actual Wilder update
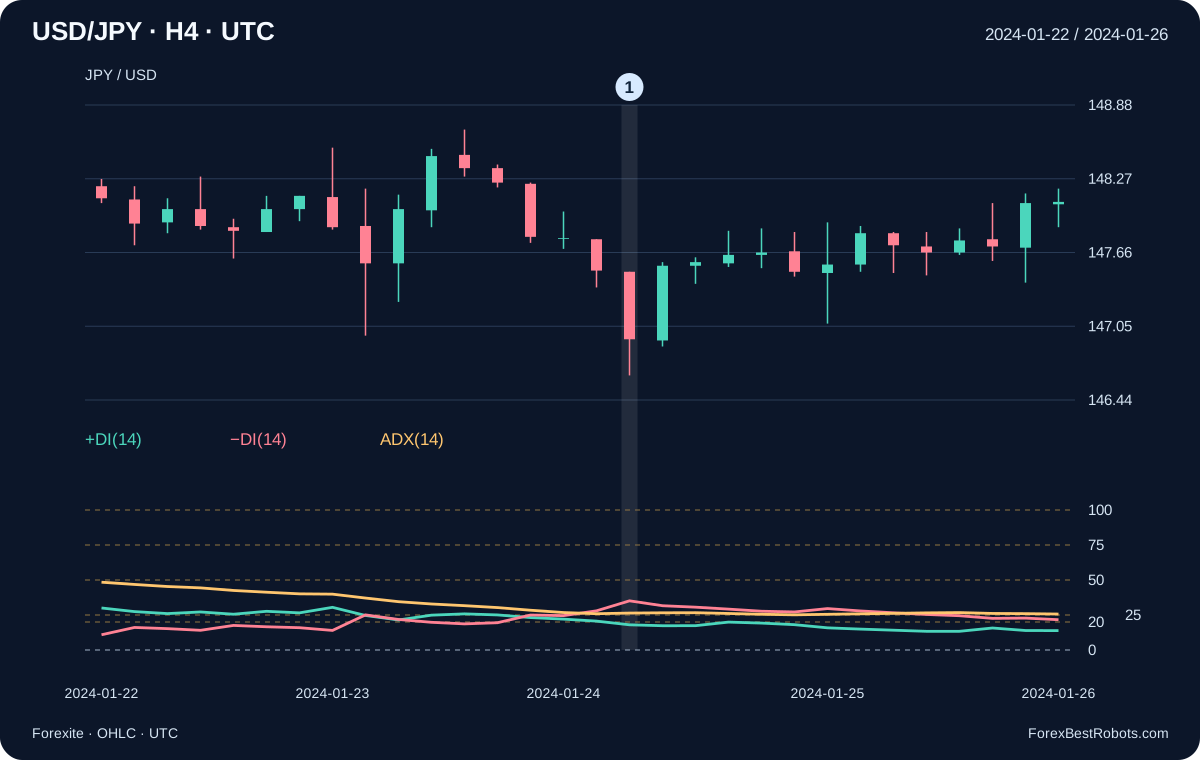
At 2024-01-24 16:00 UTC, High is 147.50, Low 146.64 and Close 146.94; the preceding High, Low and Close are 147.77, 147.37 and 147.51. Up is −0.27 and Down is 0.73, so +DM = 0.00 and −DM = 0.73. TR is 0.87, slightly greater than the current High−Low range of 0.86.
Using the complete declared history, smoothed TR is 6.809863, smoothed +DM 1.225661 and smoothed −DM 2.391871. These are sums in JPY per USD. +DI(14) is 17.998323, −DI(14) is 35.123631 and DX is 32.237723. ADX rises from 25.924206 to 26.375171. Displayed intermediate values are rounded; the update uses full precision.
7. Rising ADX can accompany falling prices
The marked January group opens at 147.50 and closes at 146.94. −DI(14) exceeds +DI(14), while ADX increases to 26.375171. This is the first January group after index 55 with a falling candle, negative DI dominance and rising ADX. The rising ADX describes strengthening separation, not an upward price direction or a buy instruction. A falling ADX likewise does not by itself mean that price is falling.
8. Separate a fresh DI cross from an ADX event
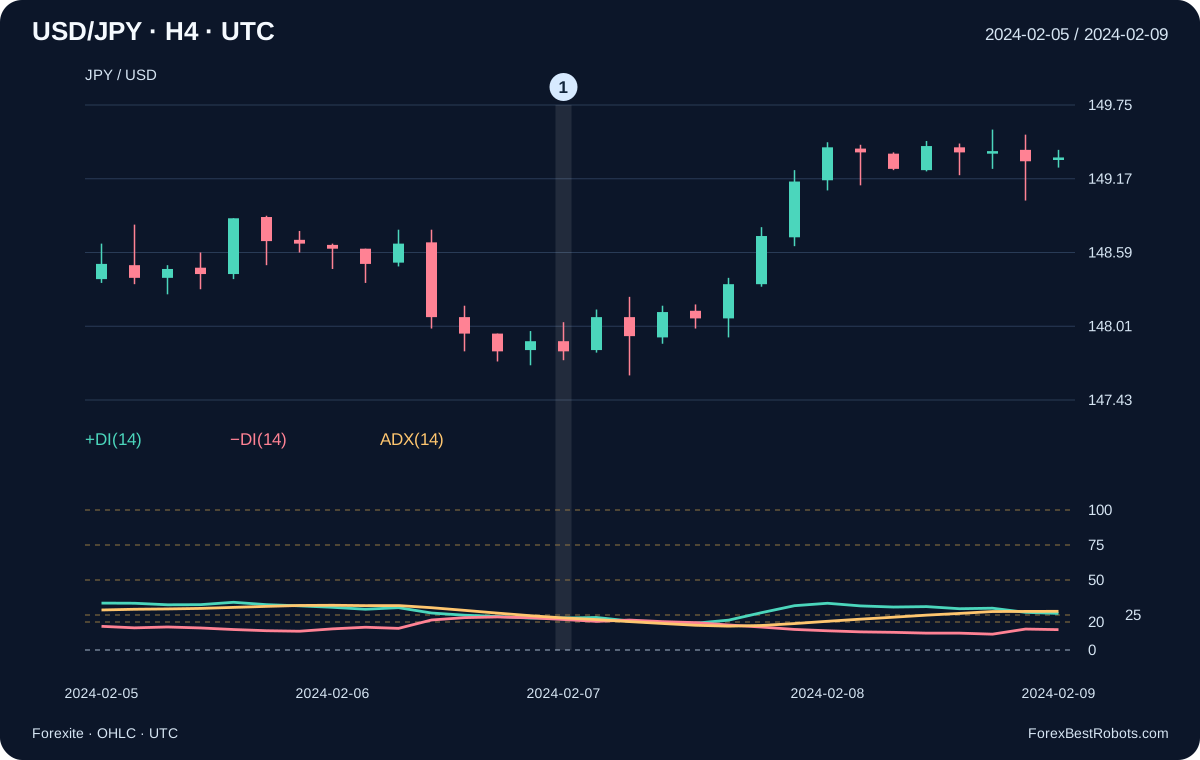
At 2024-02-07 08:00 UTC, +DI(14) moves from 22.801744 to 22.830116 while −DI(14) moves from 23.022586 to 21.793831. +DI crosses above −DI, but ADX falls from 24.494596 to 22.910858 and remains below 25. This is the first February upward DI cross with ADX below 25 in the declared sample. The candle itself closes at 147.81 below its 147.89 open.
Define a fresh upward DI cross as previous +DI ≤ previous −DI and current +DI > current −DI. An ADX crossing above 25 separately requires previous ADX ≤ 25 and current ADX > 25. Both previous and current values must exist. Equality on the current value does not complete these strict crossings; remaining on one side is not a new event every group.
9. Use 20 and 25 as declared reference levels
The chart marks 20 and 25 as commonly used strength references, not universal dividing lines between profitable and unprofitable trades. ADX can be below a threshold during an early move, and can remain high after the directional balance changes. A higher cutoff reduces eligible observations under that rule; it does not establish that the remaining entries are better after costs. Threshold selection needs separate evidence.
10. Compare 7, 14 and 28 periods without resetting the seed
At 2024-02-07 08:00 UTC, ADX(7) is 33.504088, ADX(14) is 22.910858 and ADX(28) is 15.297700. For N = 7, −DI is above +DI; for N = 14 and 28, +DI is above −DI. The same candle can therefore have a different directional balance and smoothed strength at different periods. First ADX indices are 13, 27 and 55.
Unlike a finite-window oscillator, this recursive calculation retains seed history. Restarting N = 14 at original index 50 produces ADX 22.959196 on that same February date, instead of 22.910858 from the full included history. The viewer does not silently truncate that history. Changing N preserves the selected date if ADX is available; otherwise it moves to the first valid ADX group.
11. Inspect a candle, directional balance and Wilder update
Choose N and a completed UTC group. Use Previous / Next to move one observed group. The chart ends at the selection. Values show direction and strength separately; the calculation disclosure reveals raw movement, smoothed sums and the fixed history origin.
Browse by observed group number
Use the date and OHLC to identify the candle. Changing N recalculates from the same first source group. On narrow screens, scroll the chart horizontally to read the labels. The optional group-number slider changes the selected group, not a trade entry.
- Completed H4 group end (UTC)
- —
- Open price
- —
- High price
- —
- Low price
- —
- Close price
- —
- Positive directional indicator: +DI
- —
- Negative directional indicator: −DI
- —
- Smoothed strength: ADX
- —
- Current directional separation: DX
- —
- Previous ADX
- —
- Change in ADX
- —
Show raw movement and the Wilder calculation
- High minus previous High: Up
- —
- Previous Low minus Low: Down
- —
- Current true range: TR
- —
- Current positive movement: +DM
- —
- Current negative movement: −DM
- —
- Smoothed TR sum: S_TR
- —
- Smoothed +DM sum: S_+DM
- —
- Smoothed −DM sum: S_−DM
- —
- First included price group end (UTC)
- —
- Included price groups through the selection
- —
- First DI / DX group end for this N (UTC)
- —
- First ADX group end for this N (UTC)
- —
- Minute records in the selected group
- —
12. Match the indicator variant and MetaTrader inputs
Match source OHLC, timeframe boundaries, completed-bar status, smoothing and seed before comparing values. An indicator name and period 14 alone are insufficient. This guide defines its Wilder calculation explicitly and does not promise identical values from every indicator labelled ADX.
In MQL4, iADX takes symbol, timeframe, period, applied_price, mode and shift. MODE_MAIN, MODE_PLUSDI and MODE_MINUSDI select the three lines. The example requests H4, period 14, PRICE_CLOSE and shift 1, the preceding bar in that chart’s series. Shift 0 can change while a live candle forms. The call demonstrates line selection; it does not prove matching internal initialization.
iADX(NULL, PERIOD_H4, 14, PRICE_CLOSE, MODE_MAIN, 1)
iADX(NULL, PERIOD_H4, 14, PRICE_CLOSE, MODE_PLUSDI, 1)
iADX(NULL, PERIOD_H4, 14, PRICE_CLOSE, MODE_MINUSDI, 1)
13. What remains undefined for an actual trading system
This is an indicator guide, not a trading backtest or a profitability claim. The quote records contain no observed Ask series, historical spread, commission, slippage or tick sequence. Candle extremes cannot establish executable fills or the intrabar order of a stop and target. A complete system still needs fixed entry, exit, sizing, overlap and rejection rules, explicit costs and an independent evaluation.
Frequently asked questions
Does a rising ADX mean prices are rising?
No. In the January example the candle falls, −DI is above +DI and ADX rises to 26.375171. ADX measures smoothed directional separation, not an upward price direction.
Is a +DI/−DI cross the same as ADX crossing 25?
No. In the February example +DI crosses above −DI while ADX falls to 22.910858, below 25. These events have separate definitions and timing.
Why does my ADX differ with the same period 14?
Check source prices, bar boundaries, indicator variant, smoothing and seed history. Restarting the calculation can change later readings. The viewer declares its first source group and first valid indices.
How are a zero denominator and the first ADX handled?
This implementation sets both DI values to 0 when smoothed TR is 0, and DX to 0 when the DI sum is 0. The first ADX averages N valid DX observations; for N=14 it appears at zero-based index 27.
Data, timing and reproducibility
The source comprises 60 original daily Forexite MetaStock archives for January–February 2024. Their SHA-256 hashes and ZIP CRC were rechecked when this guide was first prepared. The minute CSV preserves source filename, original CET timestamp, converted UTC and unchanged two-decimal USD/JPY OHLC.
The extraction contains 61,972 minute records and 266 H4 groups. Groups use the first observed Open, highest High, lowest Low and last observed Close. The final group cut off by the source-data boundary is omitted; 17 short or sparse groups are retained with their counts. The declared initialization produces 239 ADX(14) values. No missing quotes or weekend candles are inserted.
The download includes the used minute records, grouped OHLC, raw TR/DM, smoothed sums, DI, DX and ADX for 7/14/28, source URLs and hashes, plus offline reproduction and independent numerical checks. Its purpose is to reproduce indicator values, not establish trading performance.
- H4 quotes, directional movement, DI, DX and ADX (CSV)
- Minute records, provenance and offline Wilder calculation (ZIP)