

A Donchian channel turns recent highs and lows into a visible reference. The key question is which candles were already available when you compared price with that reference. Follow real EUR/USD H1 Bid candles, inspect the exact calculation window and distinguish an outside wick from a completed close beyond the channel.
1. Map the highest high and lowest low
For a selected candle t and lookback N, take the highest High and lowest Low among the N preceding recorded H1 candles. Their average is the middle line. Unlike a moving average, that midpoint uses only two extremes; it does not average every Close in the window.
The baseline uses N = 20. It means 20 recorded candles on this H1 chart, not 20 days or necessarily 20 elapsed hours. The explorer also offers 10 and 55. Empty hours are not drawn as invented flat candles; a window can span a market closure.
U(t) = max(H[t−N], …, H[t−1])
L(t) = min(L[t−N], …, L[t−1])
M(t) = (U(t) + L(t)) / 2
N ∈ {10, 20, 55}
2. Keep the selected candle out of its breakout reference
In prior-bar mode, the reference ends at t−1. Candle t can therefore close above the old upper boundary or below the old lower one. This is a comparison with information that existed before t started.
In including-selected mode, the same N-bar window ends at t. Its upper boundary includes that candle’s own High and its lower boundary includes its Low. A valid OHLC candle cannot close above its own High or below its own Low, so a closed breakout of those same updated boundaries is impossible. This mode explains a plotting convention; it is not a second entry model.
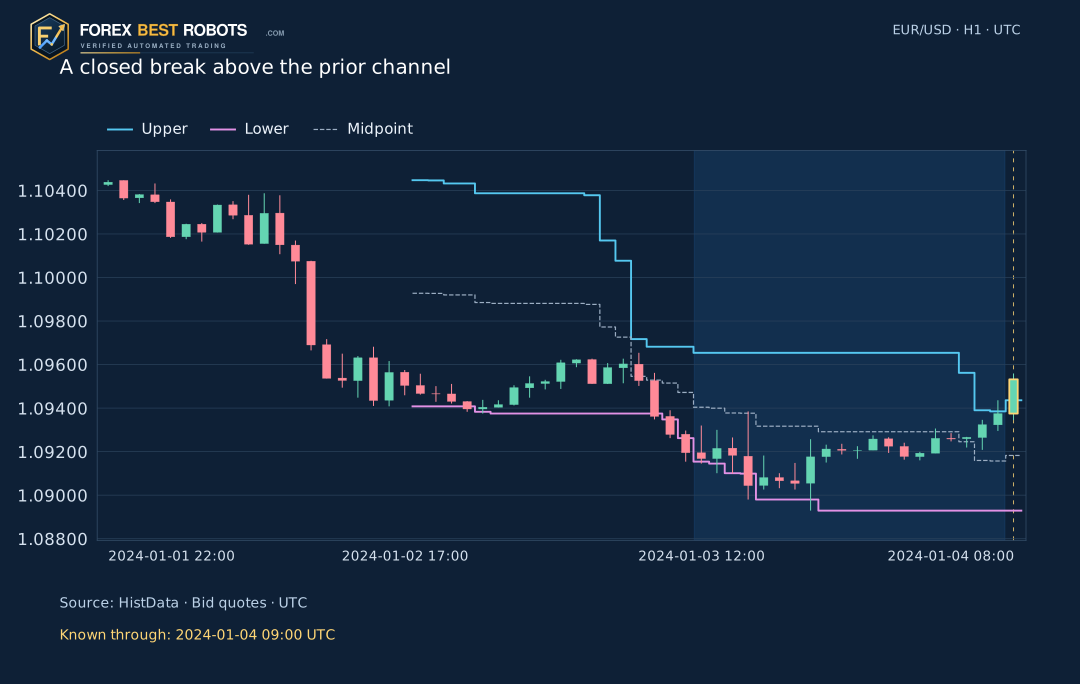
3. Separate a wick, an equal close and an outside close
Use strict comparisons: Close > prior upper boundary is an upper closed break, and Close < prior lower boundary is a lower closed break. A Close exactly on a boundary is equality, not a break. An outside High with an inside Close is a wick excursion; the lower-side case is symmetric.
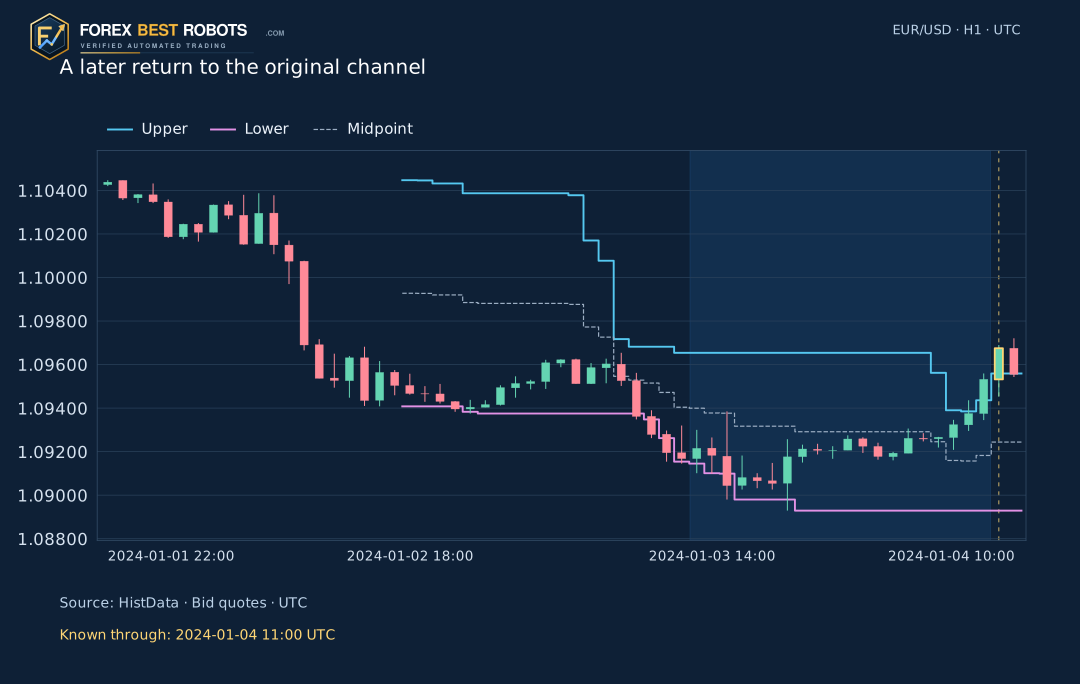
The numeric example table preserves the original prices. On 4 January, the 07:00 UTC candle reaches above its old upper boundary but closes back inside; the 08:00 candle closes above its own prior-20 boundary. Those observations become known at 08:00 and 09:00 UTC respectively. A boundary changes as the window rolls, so compare each candle with its own earlier reference.
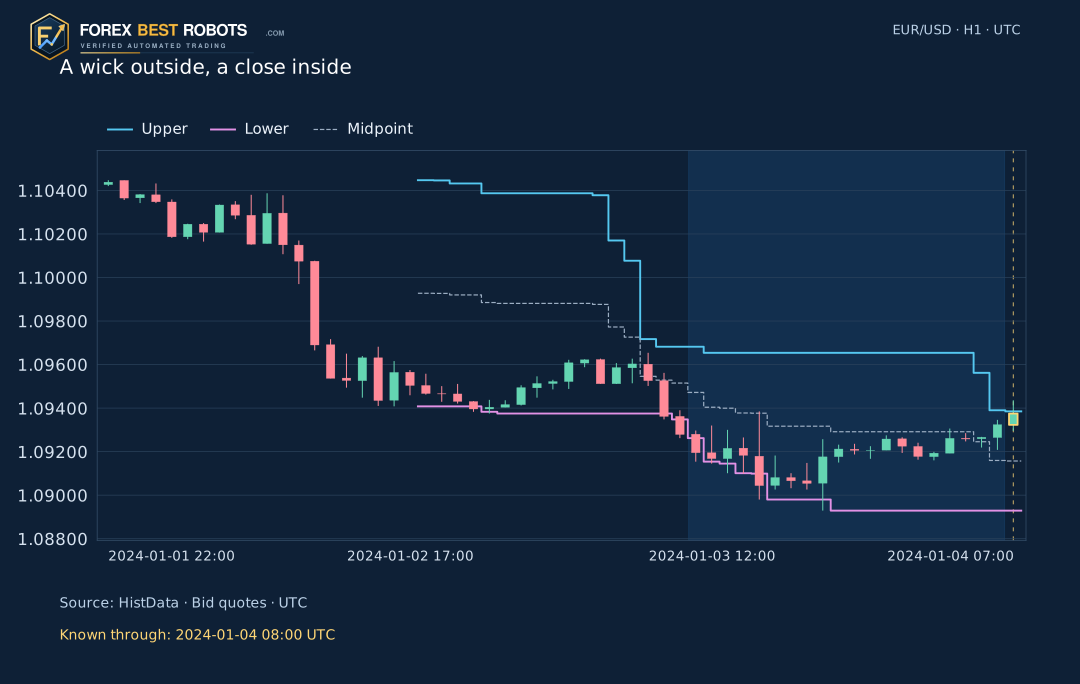
| Observation | Candle start UTC | Known at UTC | Prior upper | Prior lower | High | Close | Classification |
|---|---|---|---|---|---|---|---|
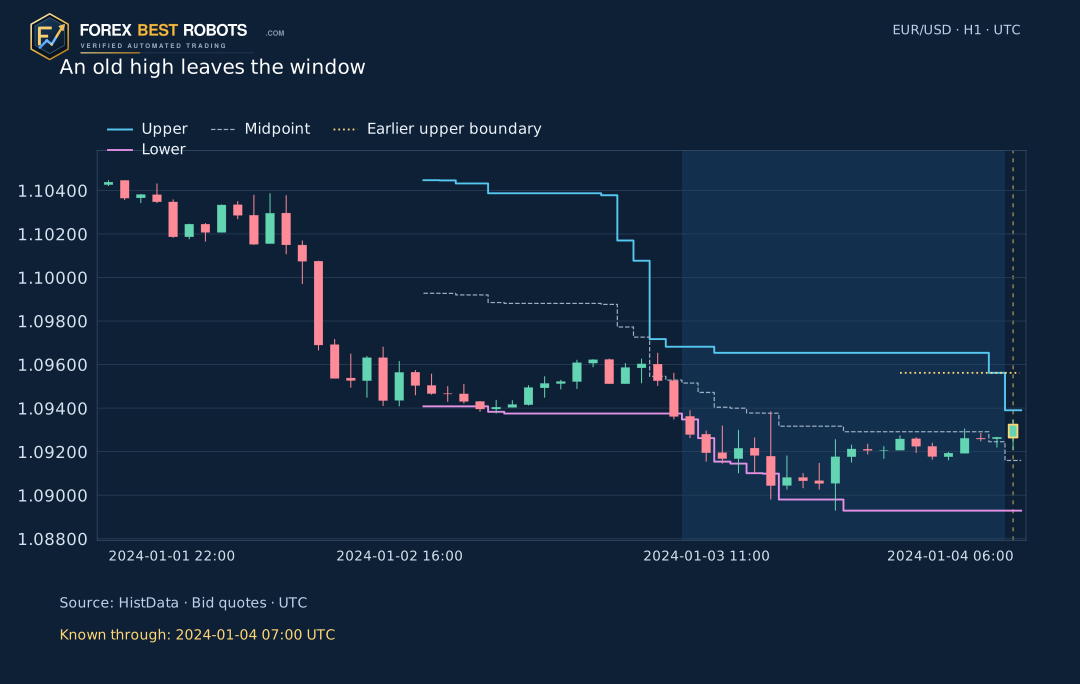
| Old high expires | 2024-01-04 06:00 | 2024-01-04 07:00 | 1.093900 | 1.089290 | 1.093460 | 1.093240 | Close and wicks inside the channel |
| Wick only | 2024-01-04 07:00 | 2024-01-04 08:00 | 1.093850 | 1.089290 | 1.094360 | 1.093750 | Upper wick outside; close inside |
| Closed break | 2024-01-04 08:00 | 2024-01-04 09:00 | 1.094360 | 1.089290 | 1.095590 | 1.095320 | Close above the earlier upper boundary |
| Break before return | 2024-01-04 09:00 | 2024-01-04 10:00 | 1.095590 | 1.089290 | 1.096900 | 1.096750 | Close above the earlier upper boundary |
4. Change the lookback without changing the price history
For the same endpoint and convention, the 10-bar window sits inside the 20-bar window, which sits inside the 55-bar window. Consequently U10 ≤ U20 ≤ U55 and L10 ≥ L20 ≥ L55. The windows can share a boundary when they contain the same extreme; the inequalities need not be strict.
A shorter lookback can react sooner because an old extreme leaves its window sooner. A longer one can keep a distant extreme in view. Neither statement establishes better trades. The comparison chart uses the same candles and the same observation time for all three lengths; it does not select a length by its later result.
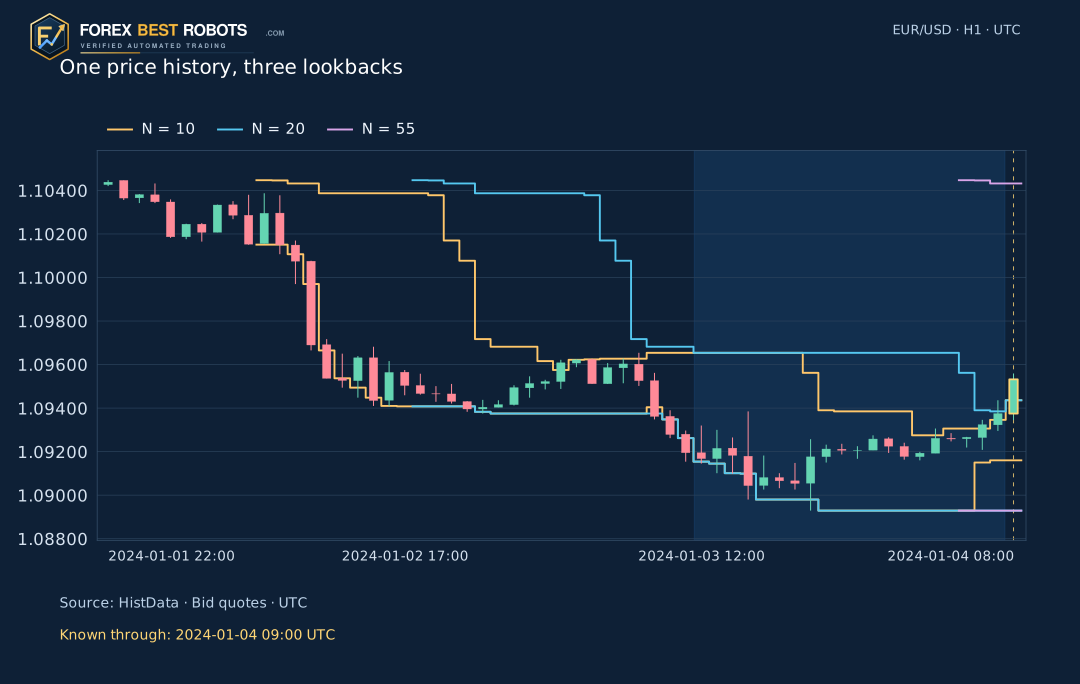
5. Notice when an old extreme leaves the window
A channel can narrow because a historical extreme drops out, even without a new price move in the opposite direction. In the expiry example, the prior-20 upper boundary falls as the oldest high leaves the window. The lower boundary may stay unchanged if its defining low remains inside.
This is a mechanical change in the reference set. It does not prove selling pressure, a reversal or lower future risk. The selected window and its first/last timestamps let you check which observations caused the step.
6. A completed break can still return inside
An outside Close describes a completed event, not a promise of continuation. In the return example, the 09:00 UTC candle closes above its earlier upper boundary; the following 10:00 candle closes inside that original frozen channel. That later return is known only at 11:00 UTC.
The return chart deliberately shows both completed candles and keeps the earlier boundary fixed for this comparison. The explorer’s return shortcut stops at the breakout candle; move forward once to reveal the next one. This example was selected retrospectively to explain a return, so it cannot estimate a failure rate, win rate or trading return. When you advance, the explorer recalculates its rolling channel; the static return chart alone keeps the breakout reference fixed.
7. Read the candle clock and the source correctly
An H1 candle labelled 08:00 UTC covers [08:00, 09:00). Its final High, Low and Close are known at 09:00, not at its opening. The explorer shows both the candle’s start and the time through which information is complete. At every position, later candles remain hidden.
The source is the HistData January 2024 Generic ASCII EUR/USD tick archive, checked against its retained SHA-256. Its fixed EST clock is converted to UTC by adding five hours. The 525 retained H1 bars run from 1 January 22:00 through 31 January 23:00 UTC. They are aggregated from observed Bid quotes. Broker-server candles or a different quote feed can have different OHLC values and windows.
8. Explore one completed H1 candle at a time
Choose a lookback and a window convention, then move through the recorded candles. The shaded region identifies the observations used for the selected reference. The selected candle has a separate gold marker. Beside the chart, the exact window, boundaries, midpoint, width and close classification update together.
The four shortcuts load the declared teaching examples and reset to the 20-bar prior-window baseline. Changing the convention preserves the selected candle and prices. The chart draws only data available through that candle’s end. On a small screen, scroll the chart horizontally; the values and controls remain readable without scrolling the whole page.
Inspect the exact calculation window
These controls change the reference window or the observation time. They do not place orders or calculate a trading return. For EUR/USD, one pip is 0.0001 USD per EUR; channel distances in the panel use that unit.
The interactive example could not load. Use the static charts and CSV below.
Load a teaching example · resets to prior 20 bars
Gold marks the selected candle. Blue shading marks only the candles used for its channel. Later candles are hidden.
- Information complete through UTC
- —
- Reference window: first → last candle start UTC
- —
- Upper boundary
- —
- Lower boundary
- —
- Channel midpoint
- —
- Channel width · pips
- —
- Selected Bid close
- —
- Close minus upper boundary · pips
- —
- What does this candle show?
- —
- Calculation convention
- —
On narrow screens, scroll the chart horizontally or open a static chart at full size.
Show the numerical comparison
Show the exact candles used for this reference
| Candle start UTC | Open | High | Low | Close |
|---|
9. Turn the indicator idea into a separately defined strategy
A channel does not decide whether to enter immediately, wait for acceptance or require a retest. A test must also define an executable next quote, the initial stop, the exit, expiry, repeat signals, exposure limits and trading costs before reviewing outcomes. Closing a candle outside the channel supplies only one possible condition.
The existing Donchian strategy introduces those trading choices. This guide supplies the calculation and timing foundation. No trades are simulated here. The Bid candles are observations, not guaranteed fills; an actual BUY uses Ask to enter and Bid to exit, while SELL reverses the quote sides. Any later strategy test must keep that distinction and include its stated costs.
Frequently asked questions
Does Donchian use the current candle?
Implementations differ. This guide’s breakout reference uses the N preceding recorded candles. The alternative viewer mode includes the selected candle to show how that changes the same price comparison. Match the convention before comparing charts.
Is a 20-period Donchian channel always 20 days?
Only on a D1 chart with that convention. Here it means 20 recorded H1 candles. Market closures can make their calendar span longer than 20 hours.
Is the middle line a moving average?
No. It is half the sum of the highest High and lowest Low in the declared window. It does not average all closes and can stay flat while many candles change.
Does an upper-channel break mean I should sell an overbought market?
The channel alone does not choose the trade direction. A break can accompany continuation or a later return. A directional rule and all execution conditions require their own specified test.
Do the 10/20/55 controls compare strategy performance?
They compare indicator geometry on identical observed candles. No entry, stop, target, costs or account returns are simulated in this guide.
Why can my MT4 chart look different?
Check the quote source, UTC versus broker time, timeframe, included/excluded candle, missing observations and indicator offset. A plotting shift changes where a line appears; it must not supply information from future candles.
Data, method and scope
The H1 CSV contains Bid OHLC, observed tick counts, minutes with observations and the prior-10/20/55 boundaries. A minute without a recorded quote is not evidence of a constant price. The raw source has more than two million retained ticks; reconstructed bars are historical observations, not a broker execution record. The archive also has five unrecorded weekday hours on 15–16 January. The calculation uses recorded bars without filling those gaps; this is not a continuous full-month strategy test.
Example selection is explicit: after 55 recorded bars, take the first upper closed break, the first upper wick with an inside close, and the first upper break followed by a return inside its original channel. The expiry example is the first upper-boundary drop after 56 bars. The downloadable method records the exact indices, source hash and independent calculation check.