

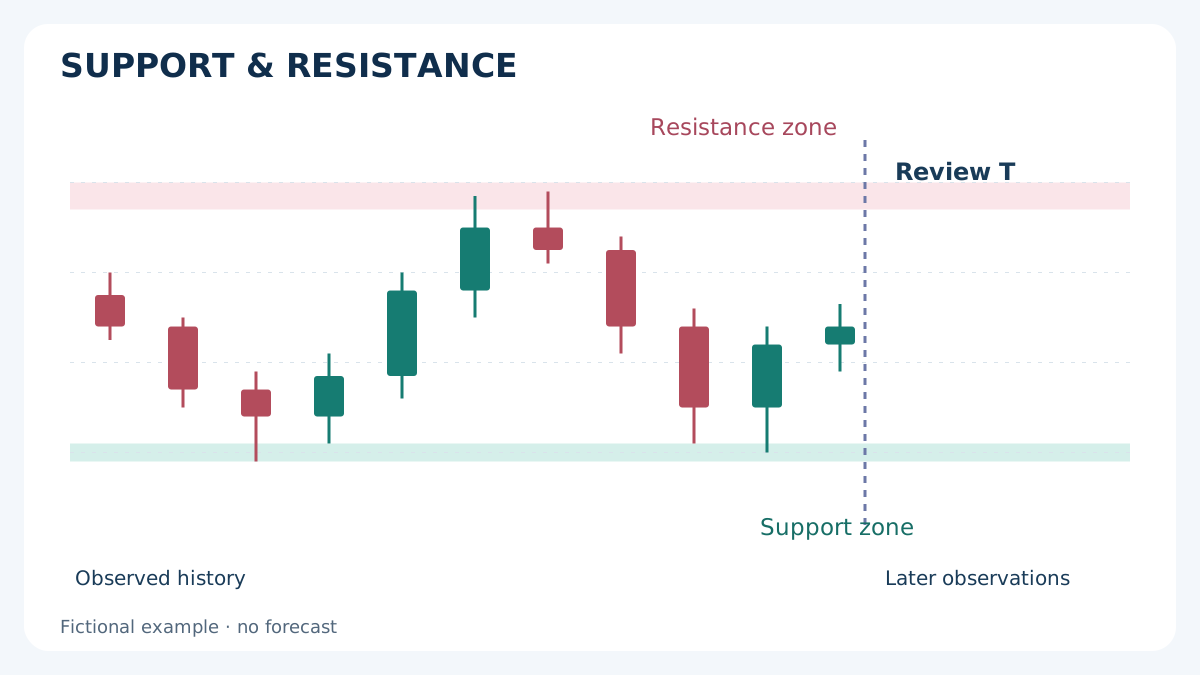
Support and resistance become useful only when you can explain why a reference was selected, when it became available and what would invalidate it. A clean historical chart can hide all three decisions. This guide builds a repeatable drawing process, then follows two fictional EUR/USD examples from a fixed zone to executable prices and risk. It teaches chart preparation and verification; it does not present a tested profitable strategy.
1. What support and resistance actually describe
Support is a price reference below the current market where an earlier decline paused or reversed. Resistance is a reference above it where an earlier advance paused or reversed. These are descriptions of observed price behaviour. A horizontal line is not a visible inventory of resting orders, and a reaction does not identify which institutions traded there.
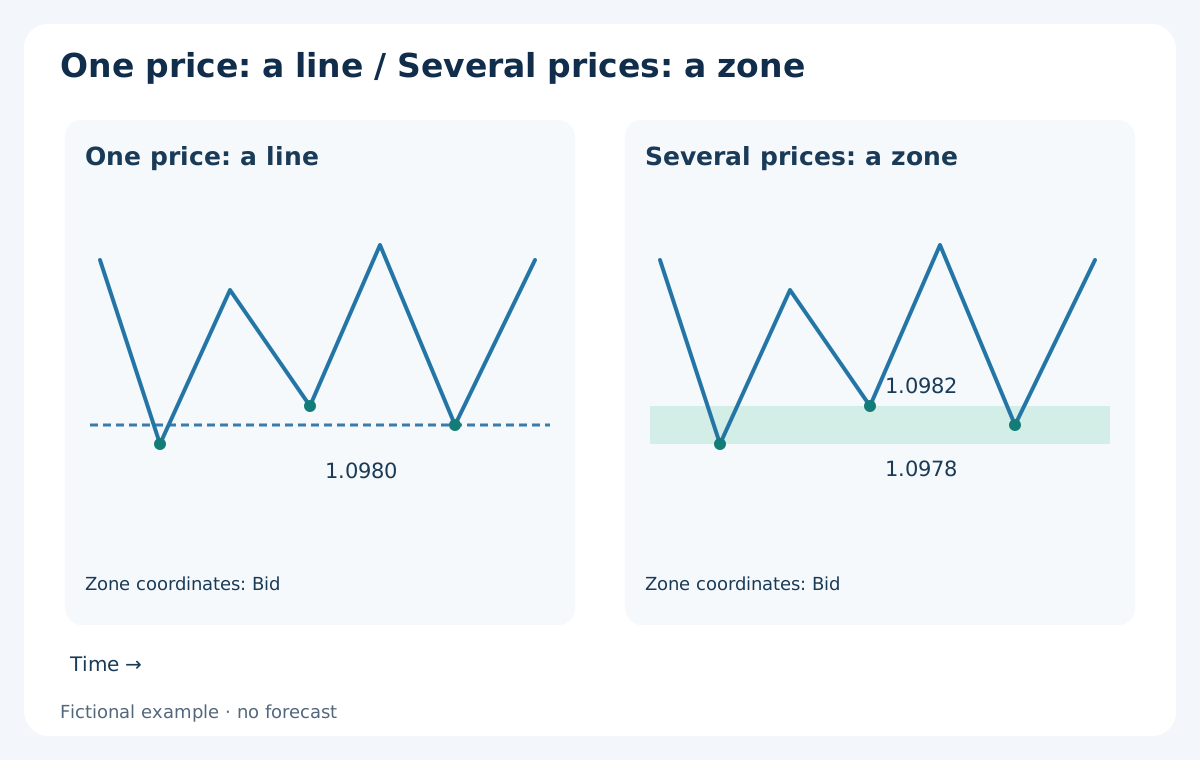
A level marks one price; a zone marks an explicitly bounded interval. A line is convenient for a single reference such as a previous daily high. A zone can describe several nearby swing prices without pretending that all reactions occurred at one exact quote. Neither representation makes a future reaction certain.
Historical research by Carol Osler, published by the New York Fed in 2000, found that intraday reactions around supplied support and resistance levels varied across currencies and firms. A separate study examined clustering of stop-loss and take-profit orders at round numbers. These findings give context, not evidence that the drawing convention or trade examples below earn a profit today.
For calculated daily references, compare the pivot point formulas and broker time zone guide.
For fixed round-number grids and timed reaction labels, see the guide to psychological Forex levels and false breakouts.
2. Fix the chart, timeframe and information set first
Record the symbol, broker feed, chart price side, timezone and decision time. Two brokers can show different extremes or daily candles. An ordinary MT4 Forex chart uses Bid prices; the current Ask line does not supply a complete historical Ask chart. Keep this distinction when you compare drawings with order records.
Start with a higher timeframe for context, then use one declared working timeframe. For example, inspect completed D1 and H4 candles for nearby obstacles and construct the detailed zone on H1. A lower-timeframe pattern inside a higher-timeframe obstacle does not remove that obstacle. There is no universally best timeframe: the holding period, spread and rule being tested matter.
For the worked drawing exercise, use the last 120 completed H1 bars at a review time T. The current unfinished candle is excluded. H1 timestamps in our example denote bar opening times; all times are UTC. Calculate ATR(14) from completed H1 bars at T if using the tolerance in section 4. The 120-bar window and the ATR multiplier are teaching choices, not recommended optimal settings.
3. Confirm a swing before using it
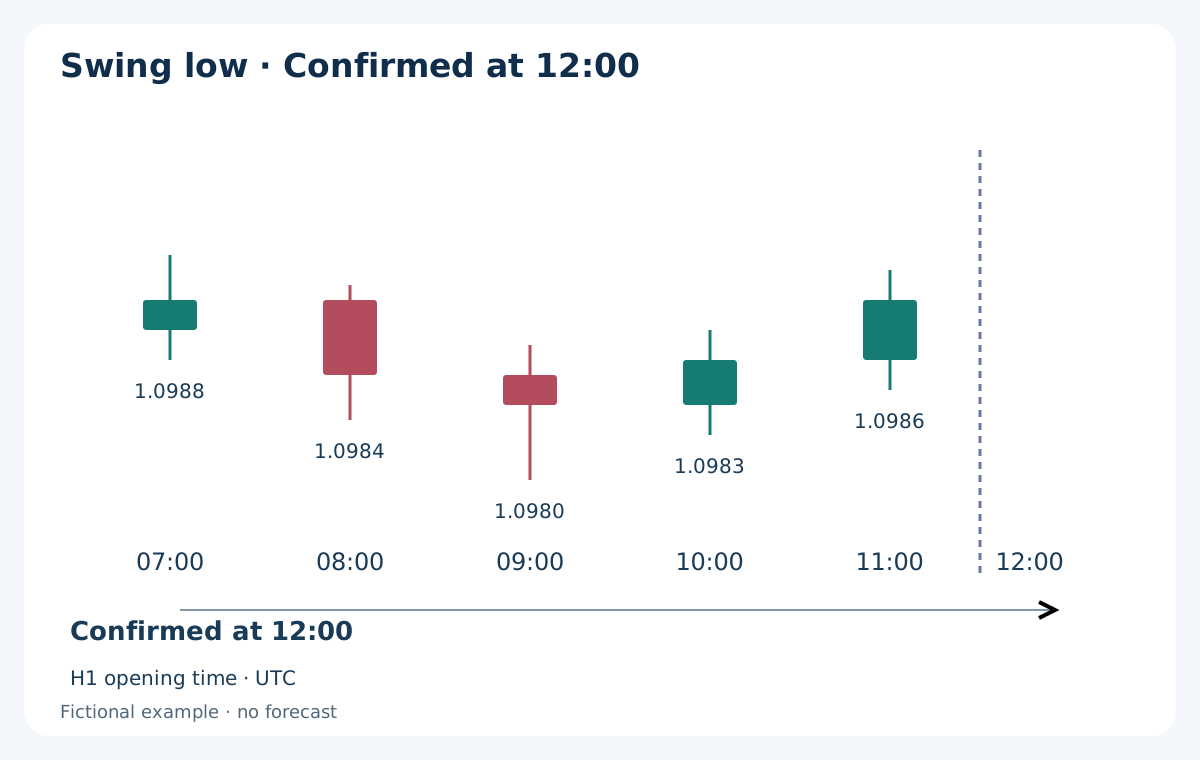
One objective convention defines a swing low as a bar whose low is strictly below the lows of the two preceding and two following bars. A swing high uses the opposite comparison. All five bars must be complete. Equal neighbouring extremes fail this strict convention; another tie rule is possible, but it must be declared before review.
Consider H1 bars opening at 07:00, 08:00, 09:00, 10:00 and 11:00, with lows of 1.0988, 1.0984, 1.0980, 1.0983 and 1.0986. The 09:00 bar contains the lowest low, but the final comparison is available only when the 11:00 bar closes at 12:00. A historical marker drawn beneath 09:00 must therefore carry an availability time of 12:00. Using it to justify a 10:00 entry introduces future information.
Confirmation creates delay and can miss an early move. That is part of the convention, not an error to repair with an earlier historical entry. ZigZag-style displays and indicators that revise their latest extreme need the same availability check. For more on swing sequences, see the guide to HH, HL, LH and LL.
4. Build a zone with a declared width rule
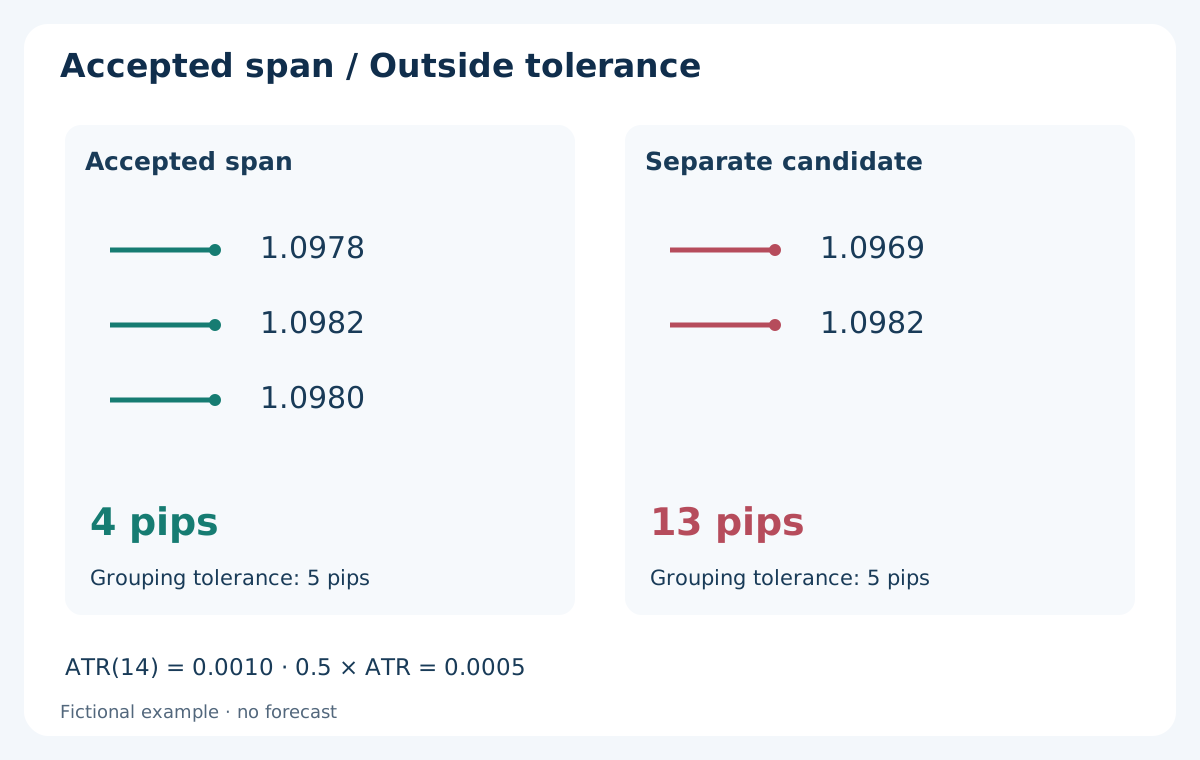
A reproducible exercise is to take the three most recent confirmed swing lows within the fixed lookback. At T, accept them as one support cluster only if the highest low minus the lowest low is no greater than 0.5 × ATR(14, H1, T). If there are fewer than three eligible lows, or their full span is wider, this exercise produces no support zone. Do not skip an inconvenient recent low to manufacture a cluster. Apply the mirrored rule to the three most recent confirmed swing highs for resistance.
Suppose the eligible lows are 1.0978, 1.0982 and 1.0980, and ATR at T is 0.0010, or 10 EUR/USD pips. The tolerance is 0.0005, or 5 pips. The full span is 0.0004, or 4 pips, so draw the support zone from 1.0978 to 1.0982. These edges are the minimum and maximum of the selected lows; they are not the entire candles or an extra padding allowance.
On a five-decimal EUR/USD quote, one point is 0.00001 and one pip is 0.0001: this zone is 40 points wide. A proposed low at 1.0969 would expand the span to 13 pips and would fail the same 5-pip tolerance. At a later review it may lead to a new zone or no zone; it must not silently alter the recorded earlier one. The multiplier controls grouping, not a stop distance or a probability of success.
This is one transparent drawing convention among many. If you use candle bodies, wick extremes, a fixed pip band or a different clustering method, name that choice and validate it separately. Mixing methods after seeing which one survived the next candle destroys comparability.
5. Choose relevant references instead of filling the chart
Keep the nearest usable zone below price and the nearest above it, plus clearly identified higher-timeframe obstacles. Compare their distance with the intended entry, stop and realistic target. A distant historical level may have little relevance to an intraday decision, while a nearby opposing zone may leave too little room after costs.
Previous day or week highs and lows, confirmed swings and round numbers are different reference types. Label their origins rather than counting several labels at the same price as independent confirmations. For example, a swing high that is also yesterday’s high is largely the same price observation twice.
Multiple visits do not mechanically make a level stronger. Several adjacent candles are not necessarily separate tests, and repeated contact can be followed by either a reversal or a break. Record the number and spacing of eligible visits, the approach and the session, then test whether those features help. Avoid assigning a strength score solely because a completed chart looks persuasive.
6. Freeze, review and retire the drawing
At T, save the zone edges, contributing swing timestamps, their confirmation times, ATR value and a screenshot with the chart’s future hidden. In our example the latest swing becomes eligible at 12:00, so the completed zone can first be recorded then. Extending its rectangle to the left is a visual aid, not a claim that the same zone was known earlier.
Choose a review schedule before the next test. For this exercise, freeze the zone through the next four completed H1 bars and reassess at 16:00; do not trade from an expired drawing without a new review. A strict H1 Bid close below the support zone’s lower edge invalidates the support-bounce observation sooner. For resistance, a close above the upper edge invalidates the mirrored observation.
A wick beyond an edge and a close beyond it are different records. A chart invalidation rule also differs from a protective Stop Loss: a position can hit its stop before the H1 close. Never defer a protective exit merely because a candle has not closed. Keep the original drawing in the journal even after you retire it.
7. Separate a bounce, a break and a failed break
A bounce hypothesis requires a reaction away from the zone. For illustration, a support-test bar trades into the zone and closes strictly above its upper edge; resistance uses a close strictly below its lower edge. This is a defined observation, not proof that price will continue. A direct limit entry on first contact would be a different rule.
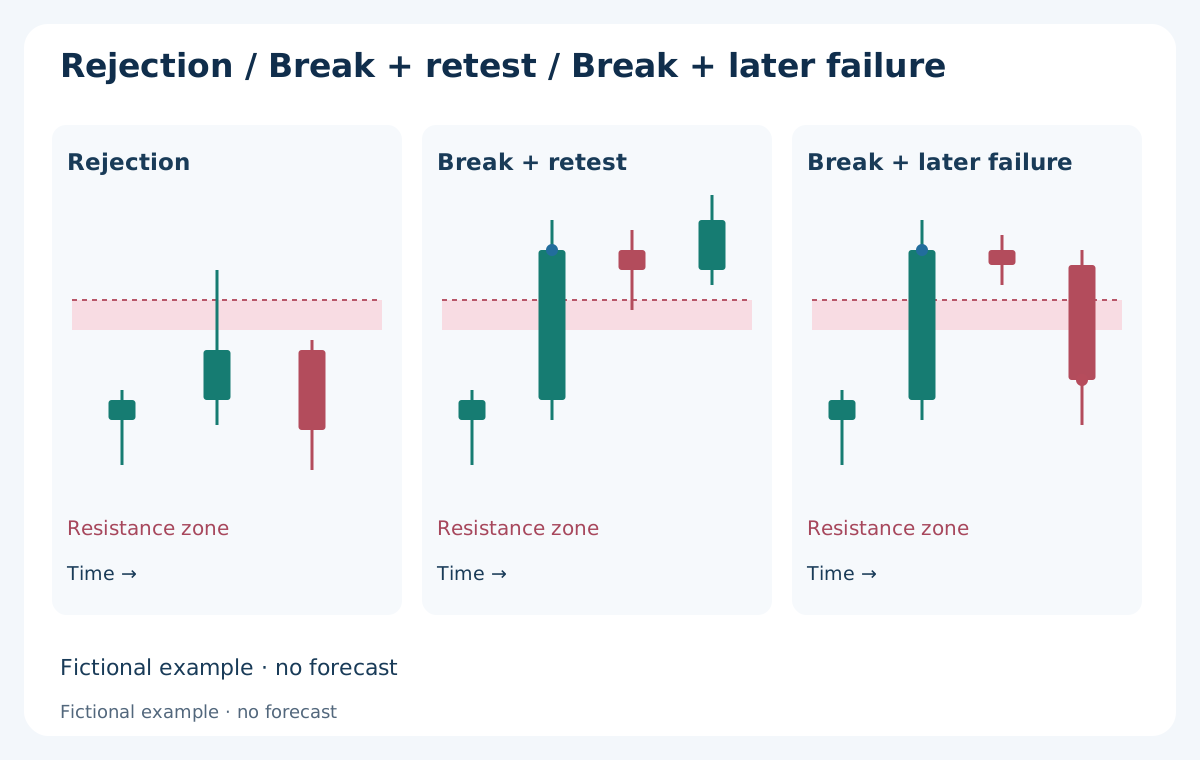
A break hypothesis requires your specified condition outside the far edge. Under a simple strict-close convention, resistance is broken only by a completed Bid close above its upper edge. A later retest from above is a separate event; role reversal is a hypothesis to confirm at that retest. Some breaks never retest, and a retest can fail.
A wick through resistance that closes back below it is not the same sequence as a completed close above resistance followed by a later close back below it. The first is a same-bar rejection; the second is a failed close-based breakout. Record the return window in advance. The guide to wick reclaims and failed breakouts develops this timing distinction without inferring hidden orders from a candle.
8. Translate the chart into Bid and Ask
BUY opens at Ask and closes at Bid. SELL opens at Bid and closes at Ask. MT4 checks a long position’s Stop Loss and Take Profit against Bid, and a short position’s against Ask. Broker execution terms still determine the resulting fills. A Bid candle crossing a drawing does not prove that every associated Ask condition was reached.
For example, with a constant 2-pip spread, Bid 1.1006 corresponds to Ask 1.1008. A SELL Take Profit at Ask 1.1008 can therefore be reached while the Bid chart is at 1.1006. If the spread widens, that relationship changes. Historical spread or Ask ticks are needed to investigate an actual discrepancy.
Measure risk and reward between the relevant executable entry and exit prices. Spread is already included in those price differences; adding it again double-counts it. Add separately charged commission and any explicit slippage or financing assumptions. See the trading-cost guide for the complete framework.
9. A BUY example: support is only the starting point
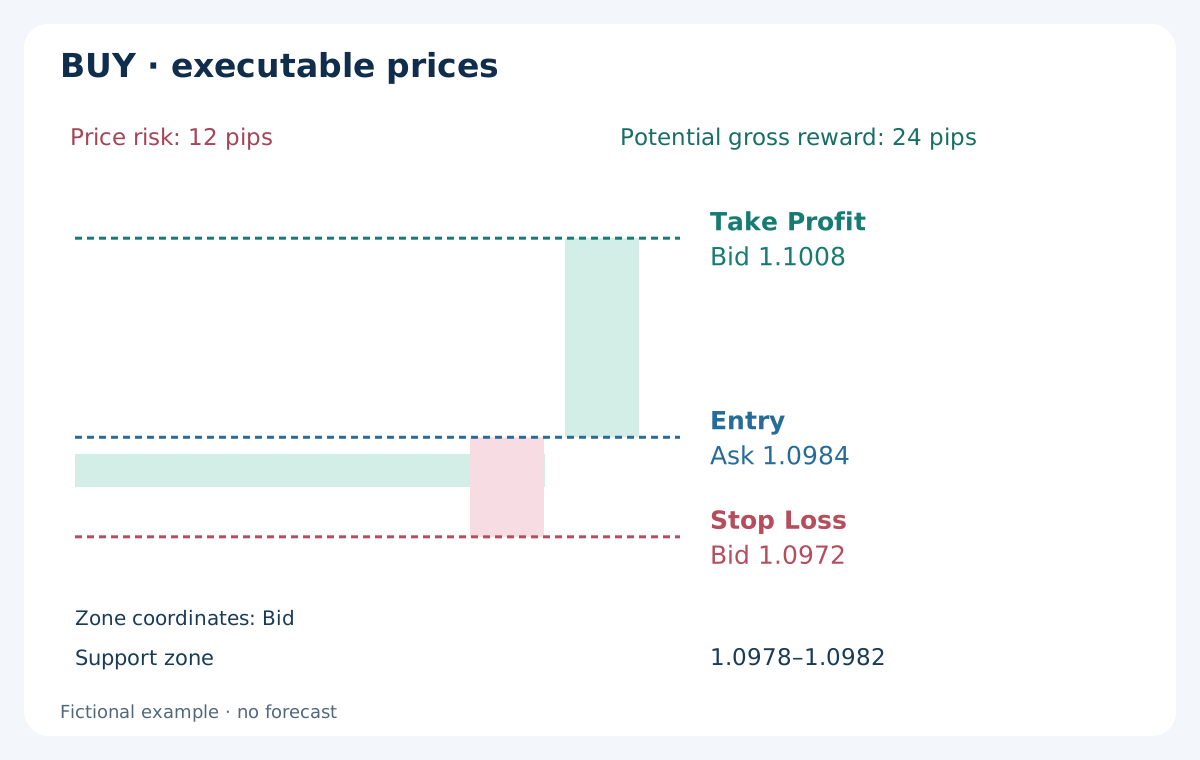
This independent fictional path uses the Bid support zone 1.0978–1.0982, frozen at 12:00. The H1 bar ending at 13:00 has a low of 1.0980 and closes at Bid 1.0983, above the upper edge. At 13:00:01, suppose the quote is Bid 1.0982 / Ask 1.0984 and a market BUY fills at Ask 1.0984. The confirmation close is not retrospectively used as the entry fill.
Assume an accepted Stop Loss at Bid 1.0972 and Take Profit at Bid 1.1008, ahead of an already recorded opposing zone beginning at 1.1009. The stop is 6 pips below the support zone, but 12 pips below the actual Ask entry. The target is 24 pips above entry. Those distances serve different purposes; measuring risk only from the zone edge would understate this trade’s exposure.
For 0.10 standard lot, a 100,000-EUR contract per lot and a USD account, pip value is USD 1.00. Exact fills at the stated levels give a gross loss of USD 12.00 at the stop or gross profit of USD 24.00 at the target. With USD 0.70 round-trip commission and no swap, these become a USD 12.70 loss or USD 23.30 profit. The after-commission reward/risk ratio is about 1.83, before additional slippage. Neither outcome is predicted.
10. A SELL example: keep the exit quote side visible
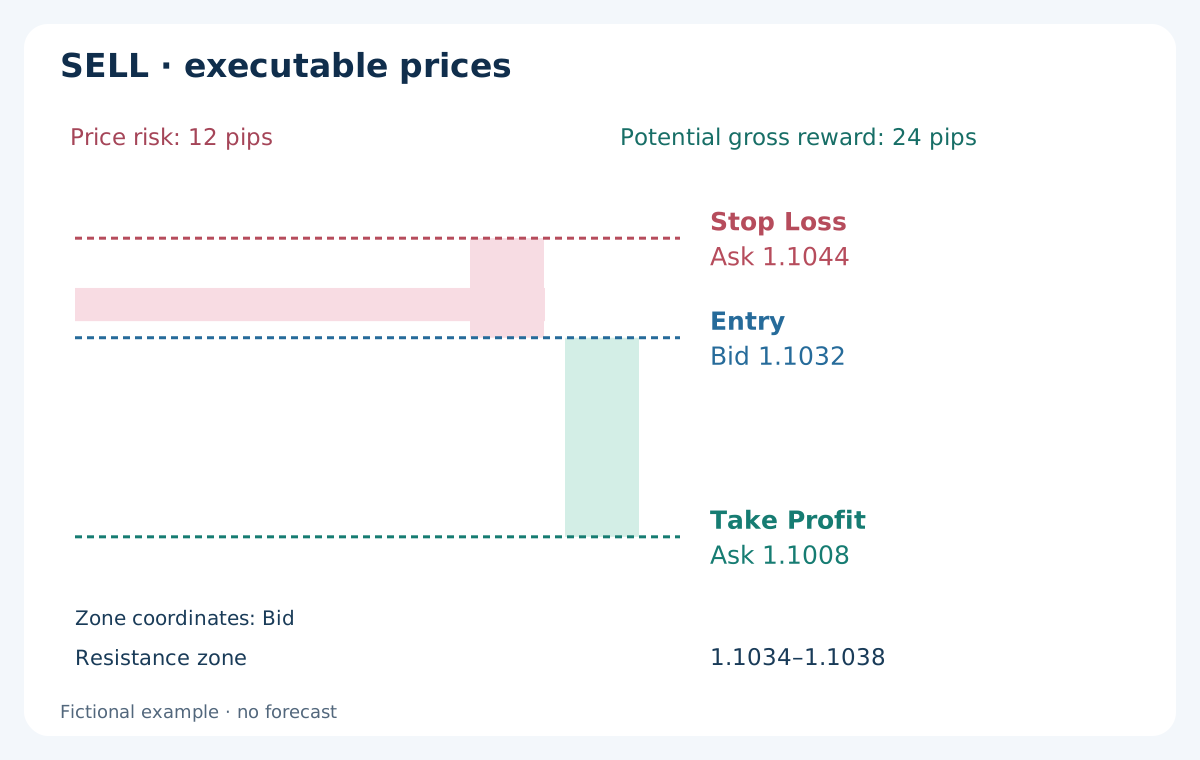
Use a separate fictional resistance zone at Bid 1.1034–1.1038. A completed test bar reaches Bid 1.1036 and closes at 1.1031. On the following tick suppose Bid is 1.1032 and Ask is 1.1034; a SELL fills at Bid 1.1032. This path is independent of the BUY example, rather than a continuation invented to make both trades win.
Assume an accepted Stop Loss at Ask 1.1044 and Take Profit at Ask 1.1008. The executable risk is 12 pips and the potential gross reward is 24 pips. With an unchanged 2-pip spread, the target corresponds to Bid 1.1006, just above a premarked support zone whose upper edge is Bid 1.1005. The stop corresponds to Bid 1.1042. These Bid equivalents change with spread; the attached short exits remain Ask-based.
At the same 0.10-lot size and commission, the arithmetic is again USD 12.70 loss versus USD 23.30 profit, assuming exact fills and no swap. A short stop can activate while the Bid chart remains below its numerical Ask stop level. Check the quote side and records before concluding that the broker ignored a chart level.
| Record | BUY example | SELL example |
|---|---|---|
| Entry fill | Ask 1.0984 | Bid 1.1032 |
| Stop trigger side | Bid 1.0972 | Ask 1.1044 |
| Target trigger side | Bid 1.1008 | Ask 1.1008 |
| Gross risk / reward | 12 / 24 pips | 12 / 24 pips |
| At 0.10 lot, after USD 0.70 commission | −USD 12.70 / +USD 23.30 | −USD 12.70 / +USD 23.30 |
11. Size the position from the stop and a cost allowance
Choose a cash risk budget independently of the attractiveness of the zone. As a sizing illustration only, an account with USD 5,000 equity and a 0.5% budget allows USD 25 of planned risk. Use the 12-pip executable stop distance above, add a 1-pip adverse stop-fill allowance and assume USD 7 round-trip commission per standard lot. At USD 10 per pip per lot, planned loss per lot is (12 + 1) × 10 + 7 = USD 137.
The raw volume is 25 ÷ 137 ≈ 0.18248 lot. If the broker permits a 0.01-lot step, round down to 0.18 lot, giving USD 24.66 planned loss under those assumptions. Verify minimum volume, contract size, tick value, margin and distance restrictions. A different account currency requires conversion into that account currency; do not reuse the USD cash amounts blindly.
The allowance is a stress assumption, not a cap on slippage. Gaps or poor execution can produce a larger loss. If the next opposing zone is too near, the spread is excessive or the valid minimum volume exceeds the budget, skip the example trade. Moving the stop into an arbitrary place simply to obtain a desired lot size changes the premise.
12. Draw and preserve the references in MT4
On desktop MT4, open the intended symbol and working timeframe and verify the broker’s displayed time against your journal. Use Insert → Lines → Horizontal Line for a single price reference, or Insert → Shapes → Rectangle for a zone. A rectangle needs both time and price anchors. Menu wording varies with terminal language; these instructions concern desktop MT4.
Select the object and open its properties, directly or through Charts → Objects → Objects List. Enter exact price coordinates in Parameters instead of estimating by dragging. For the example rectangle, set 1.0978 and 1.0982 as the vertical boundaries, and begin the forward observation at the 12:00 review time. Record any leftward extension as historical context only.
Give the object a descriptive name containing the symbol, timeframe and review identifier. Use a light background fill so candle bodies remain readable, and label whether the coordinates are Bid references. Set timeframe visibility deliberately; a rectangle carried onto M15 keeps its H1 construction method and does not become a new M15 level.
Save the drawing or chart template and a screenshot before revealing subsequent bars. Keep a separate journal record because objects can be moved later. A drawn line or rectangle places no order, provides no server-side stop and does not cause an EA to trade unless that EA explicitly implements such behaviour.
13. Validate the process with replay and a journal
Replay the chart with future candles hidden. At each scheduled review, construct references from the eligible bars, record availability times, freeze the edges and then reveal the next bar. Preserve rejected clusters, expired zones, invalidations, skipped trades and non-retests alongside successful reactions. Otherwise the sample describes selected memories rather than the drawing rule.
Define a reaction horizon and measurement before collecting results. For example, observe the next four H1 bars and record whether a bounce confirmation occurred before invalidation or expiry. Keep this event count separate from simulated trade returns. A high reaction rate may still produce losses when entries are late, stops are larger than targets or costs consume the move.
For execution testing, use suitable Bid/Ask tick data or a documented conservative treatment of intrabar ambiguity. One OHLC candle that touches both a stop and target does not reveal their order. Keep development and later validation periods separate, compare with a simple benchmark and avoid choosing zone widths from the best historical profit. The forward-validation guide explains how to freeze a protocol.
14. A final check before using a level
Ask whether another reader could reconstruct the same drawing from your saved inputs. They should know the price side, timeframe, lookback, swing rule, confirmation delay, clustering tolerance, review time and expiry. If an exception is needed, record it as a new rule version rather than editing the previous record.
Then separate three questions: is the reference valid under the drawing convention; has the chosen trading condition occurred; and can the intended order be executed within the current risk budget? A valid support zone alone answers only the first. News, spread, available margin, nearby obstacles and missing price data can still make the next step unsuitable.
Common errors are drawing around the eventual winner, enlarging a zone after a loss, counting unfinished swings, treating every contact as an independent confirmation and using Bid-only charts to judge Ask-based exits. A useful chart is selective, time-stamped and testable. Its value lies in making decisions auditable, while performance must be established separately.
Questions about support and resistance
Should support and resistance be lines or zones?
Use a line when the reference is one declared price, such as a previous daily high. Use a bounded zone when the method groups several nearby prices. Record the source and boundaries before the next test. A zone should not expand whenever price moves against the idea, and its width is separate from the protective stop distance.
Do I draw levels from wicks or candle bodies?
Both conventions are possible, but they produce different references. This exercise uses confirmed wick extremes and strict comparisons. A body-based method needs its own definition for opens and closes, width and availability. Do not switch between bodies and wicks after seeing which drawing would have avoided a losing trade.
Which timeframe is best for support and resistance?
There is no single best timeframe for every holding period or cost structure. Higher-timeframe references can supply context while a declared lower timeframe supplies the observation rule. Record how both are used. A lower-timeframe entry does not erase a nearby higher-timeframe obstacle, and a level’s apparent precision is not evidence of profitability.
Does a broken resistance level always become support?
No. A close beyond resistance establishes only the chosen break condition. A later retest and reaction must be observed separately. Price can continue without a retest, return inside the old zone or move directly through it. Treat role reversal as a conditional hypothesis and specify the retest window and invalidation before the outcome.
Why can a SELL stop trigger before Bid reaches its drawn price?
A short position closes by buying at Ask, so its MT4 Stop Loss is checked against Ask. The ordinary chart normally shows Bid. Spread can therefore explain a trigger while Bid remains below the stop’s numerical price. Check the historical quotes, fill and broker terms; the current Ask line cannot reconstruct the complete earlier spread.
Can support and resistance be used in an Expert Advisor?
Yes, if the EA defines the lookback, eligible swings, confirmation time, clustering, expiry and execution rules explicitly. It must handle duplicate signals and order responses as well. A graphical rectangle alone does not create that logic. Test the implementation with costs and later data; an objective definition makes a method reproducible, not automatically profitable.
Sources and scope
MetaQuotes documents support the MT4 drawing tools and Bid/Ask order mechanics. The two New York Fed publications provide historical research context with specific samples and dates. Our five-bar swing convention, clustering rule, review schedule, fictional prices and cash examples are original educational constructions; the cited research does not validate those settings or establish a current trading edge.
- Carol Osler (2000) · Support for Resistance
- Carol Osler (2001) · Currency Orders and Exchange-Rate Dynamics
All prices and paths are fictional teaching examples. They are not backtests, trading signals or evidence of future returns.