

An ATR reading is useful only when you know what it measures. A value that looks small in the platform can represent a meaningful distance in pips, while a rising line can accompany either a rally or a decline. This guide turns that displayed number into a reproducible measurement before it becomes part of a trading rule.
The focus is ATR construction and interpretation: True Range, averaging, units and timing. It does not supply an entry system or a universal stop multiplier. The momentum-indicator guide covers directional price changes; ATR instead summarizes movement magnitude without choosing BUY or SELL.
1. Read volatility as scale, not direction
Average True Range, or ATR, is an average of bar-by-bar True Range. It is expressed in the same price units as the underlying quote. It is not inherently a percentage, a pip count, traded volume or an annualized standard deviation of returns.
A higher ATR means a larger measured range under the chosen inputs and averaging method. It does not establish a stronger directional trend, a reversal or a better trade. A wide, erratic range can raise ATR while offering poor directional follow-through.
ATR is descriptive and uses observed prices. A reading of 12 pips is neither a promise that the next bar will travel that distance nor a ceiling on its range. A band drawn one ATR from a price is not a calibrated probability interval.
2. Include the previous close in True Range
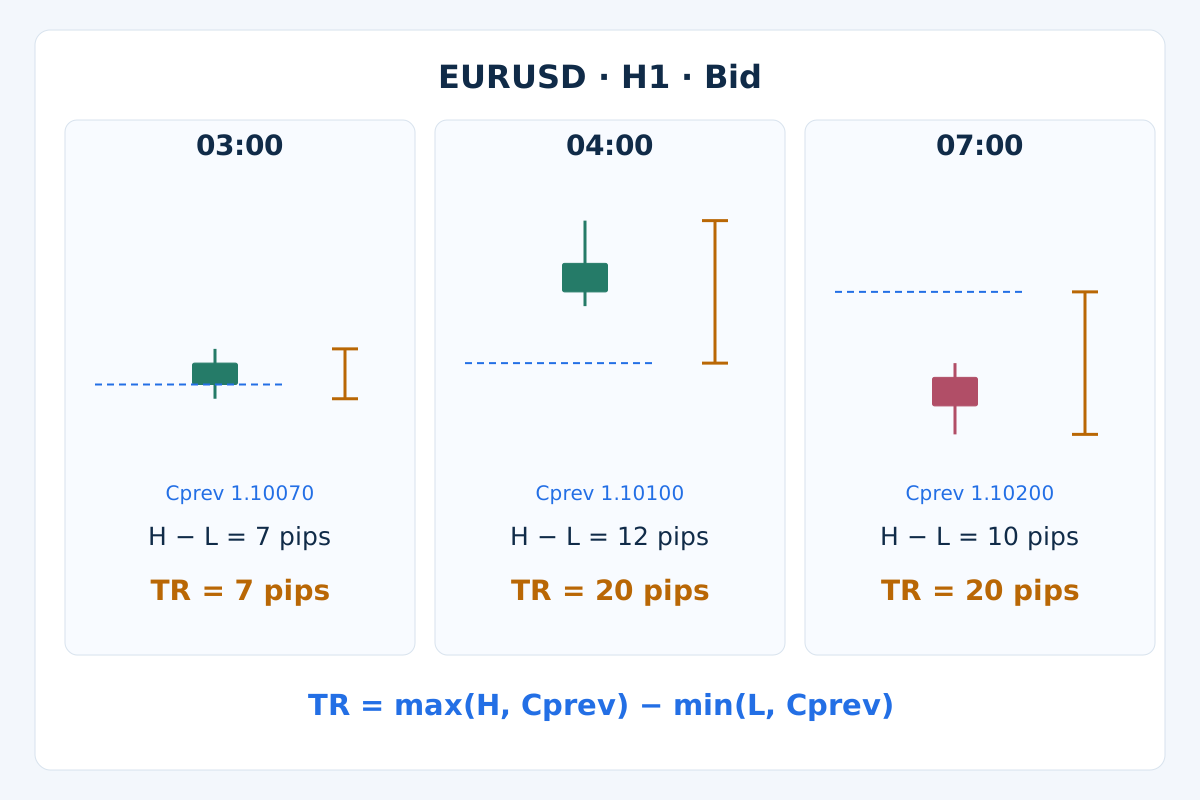
For a completed bar t, let H and L be its Bid high and low, and Cprev the previous valid bar's Bid close. Define TR = max(H − L, abs(H − Cprev), abs(L − Cprev)). Absolute values prevent a signed gap from becoming a negative distance.
For valid OHLC, the equivalent expression is TR = max(H, Cprev) − min(L, Cprev). If the previous close lies inside the current high–low interval, TR equals H − L. If it lies outside, TR includes the gap as well as the relevant current range; do not add the previous candle's full range.
An upward gap and a downward gap can therefore produce the same TR. Reflecting a positive price path around a fixed level preserves its ranges while reversing its direction. ATR built from those ranges also stays the same. It cannot recover the missing direction from that magnitude alone.
3. Name the averaging method and its seed
A rolling simple average is ATR_SMA(t) = Σ TR(t−j) / n, j = 0…n−1. It keeps the latest n True Ranges with equal weights. Once the window advances, the oldest value leaves completely. Its efficient update is ATR_SMA(t) = ATR_SMA(t−1) + (TR(t) − TR(t−n)) / n.
For the Wilder convention used here, seed ATR with the arithmetic mean of the first n valid TR observations, then use ATR_W(t) = ((n−1) × ATR_W(t−1) + TR(t)) / n. This recursive average has weight 1/n on the newest value. Older observations decay rather than vanish at a fixed boundary.
These formulas share the seed but need not share later values. Ordinary EMA weighting 2/(n+1) is different again. “ATR” and a period alone are therefore an incomplete reproducibility specification: state the smoothing, initialization and available history. More decimals cannot repair a different algorithm.
4. Match the measurement to the MT4 environment
In MT4, record the exact broker symbol, timeframe, indicator implementation and period. The documented call iATR(_Symbol, PERIOD_H1, 14, 1) requests that symbol's H1 ATR at shift 1. Its arguments do not include a smoothing selector or an applied-price selector.
Do not assume that a terminal's ATR equals a hand-calculated Wilder series merely because the period matches. Compare the actual completed-bar values after matching input candles, seed and history. A custom indicator can use another algorithm. This article compares two explicit formulas; it does not claim to have verified a live terminal's output.
Check the platform's Data Window against a small reconstruction and retain the indicator or EA version. ATR uses highs, lows and the previous close; it is not a moving average applied only to Close. The symbol-specification guide explains why broker suffixes and price increments also matter.
5. Reproduce a complete synthetic H1 example
The table supplies invented EURUSD Bid candles, labeled by their closing times on one assumed server clock. The preceding close at 00:00 is 1.10000. Use n = 3 to keep the arithmetic visible; this is a teaching choice, not a recommended trading setting. The gaps are specified price jumps, not missing rows.
| H1 close time | Bid open | Bid high | Bid low | Bid close | TR, pips | Wilder(3), pips | SMA(3), pips |
|---|---|---|---|---|---|---|---|
01:00 | 1.10000 | 1.10080 | 1.09980 | 1.10040 | 10 | — | — |
02:00 | 1.10040 | 1.10100 | 1.10020 | 1.10070 | 8 | — | — |
03:00 | 1.10070 | 1.10120 | 1.10050 | 1.10100 | 7 | 8.333333 | 8.333333 |
04:00 | 1.10200 | 1.10300 | 1.10180 | 1.10240 | 20 | 12.222222 | 11.666667 |
05:00 | 1.10240 | 1.10280 | 1.10200 | 1.10220 | 8 | 10.814815 | 11.666667 |
06:00 | 1.10220 | 1.10260 | 1.10180 | 1.10200 | 8 | 9.876543 | 12.000000 |
07:00 | 1.10080 | 1.10100 | 1.10000 | 1.10040 | 20 | 13.251029 | 12.000000 |
08:00 | 1.10040 | 1.10120 | 1.10020 | 1.10080 | 10 | 12.167353 | 12.666667 |
09:00 | 1.10080 | 1.10140 | 1.10060 | 1.10100 | 8 | 10.778235 | 12.666667 |
10:00 | 1.10100 | 1.10160 | 1.10080 | 1.10120 | 8 | 9.852157 | 8.666667 |
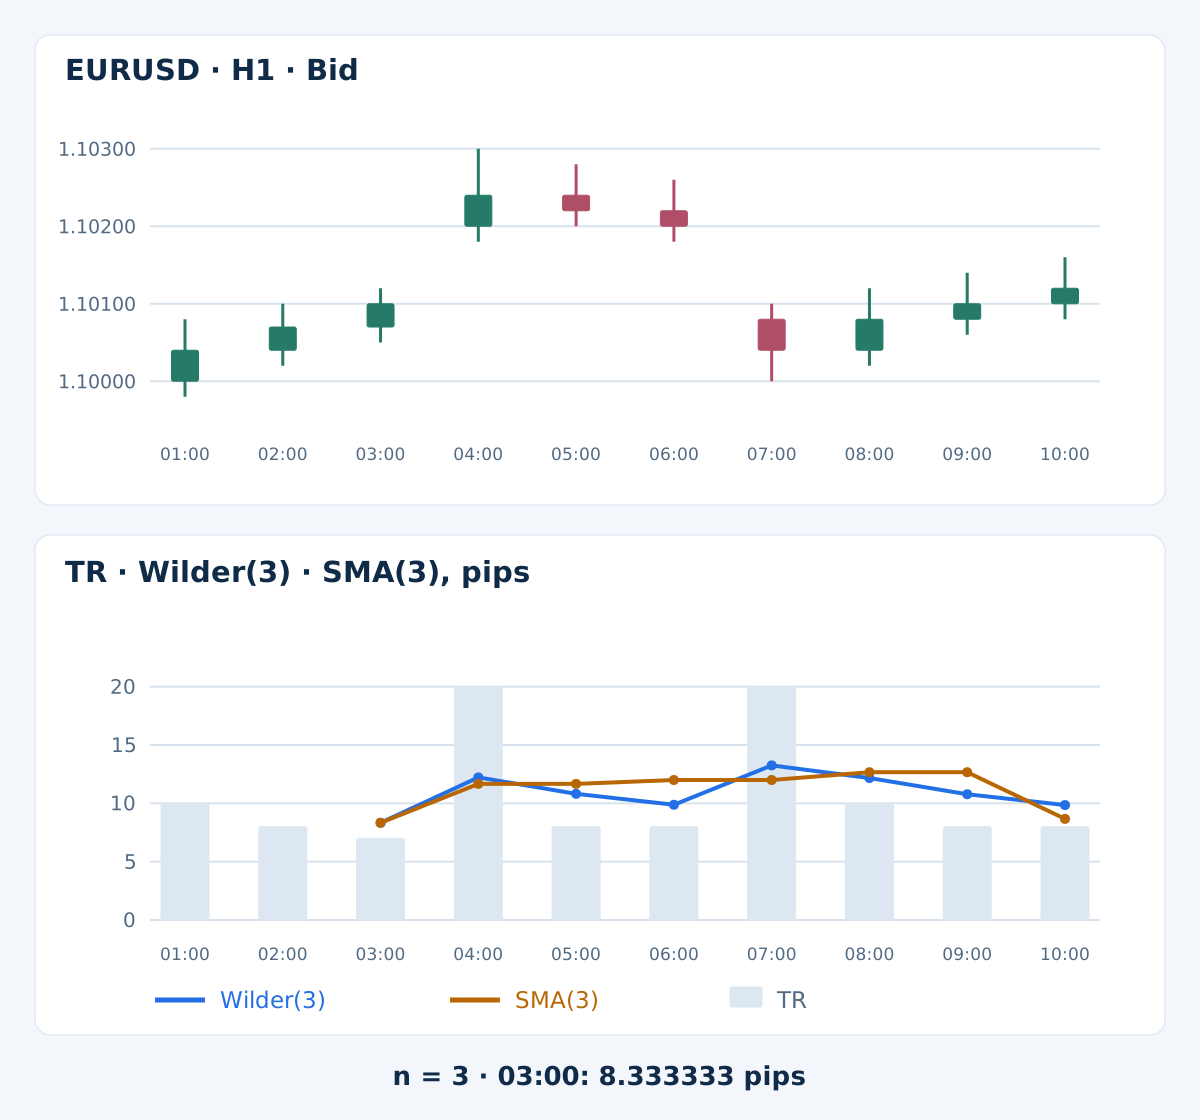
The first True Ranges are 10, 8 and 7 pips. Both averages first become available at the 03:00 close: (10 + 8 + 7) / 3 = 8.333333 pips. Earlier ATR entries are unavailable, not zero. Keep full precision between steps; only the displayed averages are rounded to 6 decimals.
At 04:00, H − L is 12 pips, but the high is 20 pips above the previous close. TR is therefore 20. The next Wilder value is ((2 × 8.333333…) + 20) / 3 = 12.222222…; the rolling SMA is (8 + 7 + 20) / 3 = 11.666667… pips. The ellipses represent retained precision, not rounded intermediate inputs.
At 07:00, the previous close is 1.10200, above the new high 1.10100; the low is 1.10000. TR is 20 pips even though the candle range is 10. Both gap directions enlarge the measurement. No order, fill or trading return is simulated; the sequence ends at its last listed bar.
6. Interpret a change without inventing a signal
In the example, a quiet new candle can coexist with an elevated ATR because earlier large ranges remain in the calculation. Conversely, a falling SMA can partly reflect a large old observation leaving its window. Read the current TR and the averaging rule before attributing every change to a fresh market event.
Low ATR does not mean a breakout is due, and high ATR does not make a reversal imminent. Any threshold is relative to a defined instrument, timeframe and sample. The Bollinger Bands squeeze strategy uses a different volatility construction and separately defined price confirmation; neither measurement guarantees follow-through.
7. Keep periods, timeframes and observation times separate
A period of 14 means a bar-count parameter, not automatically fourteen days. On H1 it applies to hourly bars; on D1 it applies to daily bars. A rolling SMA uses its finite window, whereas a Wilder average retains decaying influence from older bars beyond that count.
For completed-bar analysis, wait until the bar has ended and the needed data are ready. Immediately after 10:00, the bar labeled by its 10:00 close opened at 09:00 and is shift 1; the 10:00–11:00 bar is forming at shift 0. A later shift number is not a stable identifier; store the opening timestamp too.
Server timezones, daily boundaries and trading sessions change how ticks are grouped into candles. Do not compare H1 and H4 ATR by simply multiplying by 4. Aggregation changes highs, lows and gap placement. A scheduled market closure differs from an unexpected data hole; a reopening bar can legitimately reference the last traded close.
8. Convert price units into pips and points explicitly
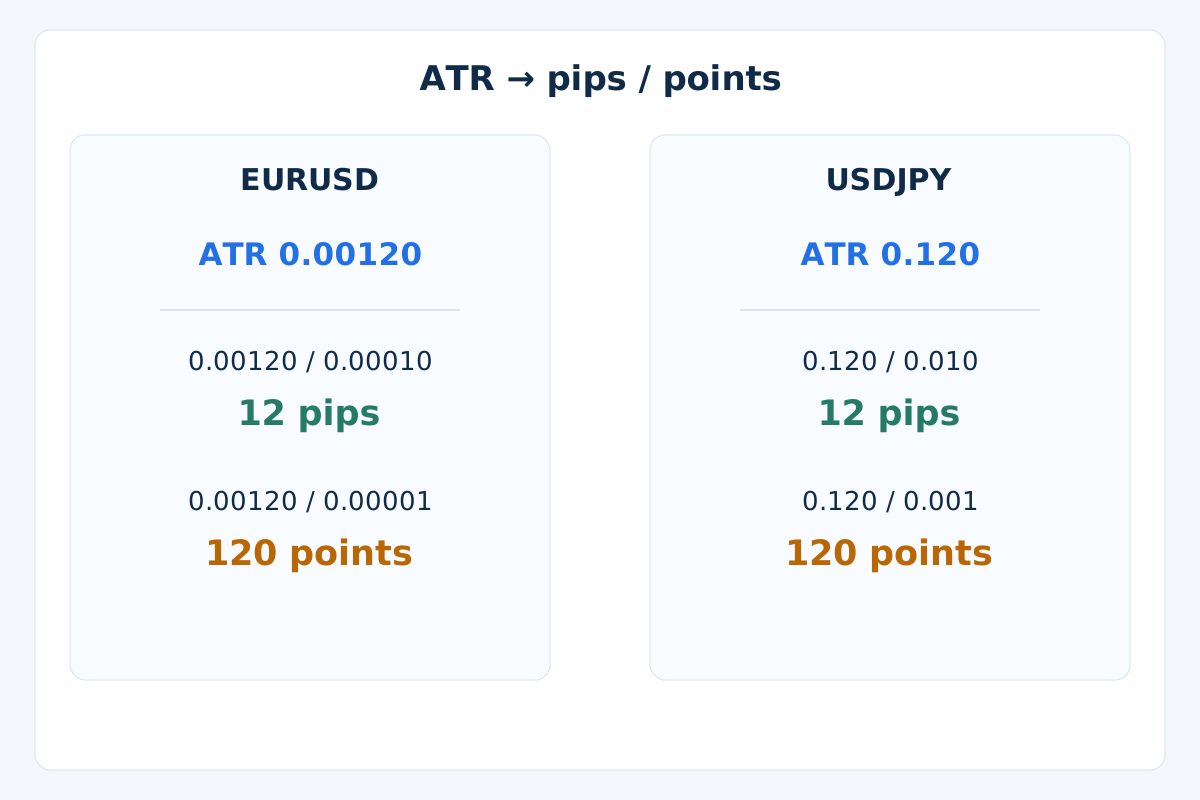
Use ATR_pips = ATR_price / pip_size and ATR_points = ATR_price / Point. For the stated 5-decimal EURUSD convention, pip size is 0.00010 and Point is 0.00001. ATR 0.00120 means 12 pips or 120 points, not the same number of both.
For the stated 3-decimal USDJPY convention, pip size is 0.010 and Point is 0.001. ATR 0.120 again means 12 pips or 120 points. These are unit examples, not current quotes. Do not transfer a Forex pip convention to gold, indices or another contract without checking its specification.
An indicator display may round away useful precision. Calculate from the underlying value and preserve its units. Pip conversion still does not supply money risk: contract size, tick size, tick value and account currency are separate inputs. An EA distance setting may expect pips, points or a price distance; read its documented unit.
9. Put costs and normalization in context
A spread of 0.00012 against ATR 0.00120 is 10% of that ATR, or 1.2 versus 12 pips. This is a descriptive cost comparison, not an entry threshold. Bid-based ATR excludes the Ask side, commission, financing and actual execution slippage; a small ratio does not establish a profitable opportunity. The trading-cost guide covers those separate charges.
The explicit normalization 100 × ATR / Close expresses ATR as a percentage of a positive price. With ATR 0.00120 and Close 1.10200, it is 0.108893%. It helps distinguish distance from price scale, but does not equalize liquidity, contract risk or timeframe. A stop multiple is another rule, not part of ATR itself; the risk-management guide explains why distance and volume must be considered together.
10. Handle missing observations and valid zeros differently
Our worked calculation requires valid positive OHLC and a previous close. Before n valid consecutive True Ranges are available, ATR is unavailable. A genuinely flat sequence can give TR and ATR equal to 0; that is a valid measurement, not a division-ready risk distance. Never divide by zero ATR or invent a fallback pip value.
For an unexpected missing required observation, this teaching calculation clears its averaging state and waits for a fresh contiguous sequence with a known preceding close. It does not bridge the hole or insert zero. An implementation using another missing-data policy is a different specification and needs an explicit comparison.
Reject malformed candles, such as High below Low or Open/Close outside the candle interval. A previous close outside the current interval is allowed: that is how the gap cases arise. Also distinguish “no tick yet,” incomplete history and a real zero indicator value instead of treating every returned zero as evidence of a quiet market.
For an EA, log the exact symbol, timeframe, bar opening time, period, smoothing convention, ATR in price units and its converted distance. Require data readiness before using a closed-bar reading. An indicator observation, an order request and a confirmed position remain different states.
11. Validate the reading before evaluating a method
First reconstruct a small sequence and check the seed, gap-up and gap-down cases, flat prices, invalid OHLC, missing history and unit conversion. Replay it one completed bar at a time. Appending later candles must not change earlier calculations when the data and initialization are unchanged.
Then compare with the intended terminal implementation using the same feed and history. A disagreement can come from smoothing, seed, quote side, grouping, missing-data handling or rounding. It is not automatically a broker fault or a repainting signal. Keep the observation log before changing any trading rule.
If ATR becomes part of a trading model, separately define entries, invalidation, exits, costs and exposure. Preserve tried variants and later evaluation data, then forward-test incoming observations. The MT4 backtesting guide explains the wider process. Matching an indicator formula proves neither a trading edge nor live execution reliability.
12. Practical ATR questions
Does rising ATR tell me to buy?
No. Both upward and downward price jumps can increase True Range and ATR. A directional hypothesis needs its own price or indicator rule; volatility magnitude alone cannot choose BUY or SELL.
Does an ATR of 12 pips forecast the next candle's range?
No. It summarizes ranges under the chosen averaging method. The next candle can be much smaller or larger. ATR supplies neither a guaranteed travel distance nor a probability bound.
Why do Wilder ATR and SMA ATR differ with the same period?
They weight history differently. In our example they share the first mean, but Wilder retains decaying influence while the SMA drops its oldest value when the window advances. Different seeds or history can create further differences.
Why does my MT4 value differ from the example?
Check the exact symbol, timeframe, input bars, averaging implementation, seed and warm-up history, then compare unrounded values at the same completed bar. This guide's synthetic arithmetic is not a verified reproduction of your terminal.
Is 14 always the best ATR period?
No. A familiar default is not an optimized choice for every pair, timeframe or rule. Shorter periods respond differently from longer ones; any trading value must be assessed within a complete, separately tested method.
Can ATR legitimately be zero?
Yes, when the required observations are available and their ranges produce zero under the chosen formula. Missing data or an uninitialized buffer can also appear as zero in software, so check readiness. A zero reading must not be used as a divisor.
13. Technical reference and scope
The official MetaTrader 4 ATR reference describes True Range and its averaging. This guide states the Wilder and SMA recurrences and its synthetic initialization explicitly so readers can reproduce the arithmetic without assuming every platform uses the same convention.
Forex and leveraged trading involve substantial risk. This guide is educational, not investment advice. Past or simulated results do not guarantee future performance.