

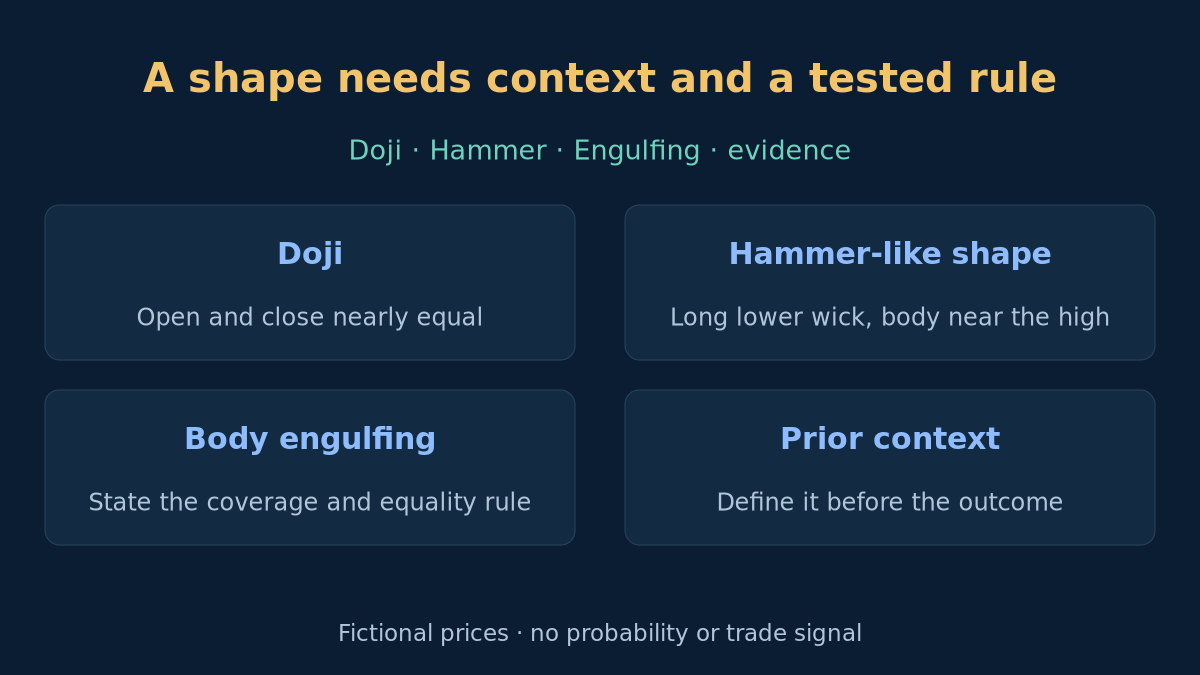
Candlestick names are useful shorthand when everyone means the same thing. Confusion begins when a small body becomes a prediction, an engulfing body is mistaken for an outside bar, or later price action is silently added to an earlier decision. This guide makes the definitions explicit, works through fictional prices and separates recognition from context and validation. It is the second guide in the cluster; start with reading OHLC and Bid/Ask if the anatomy is unfamiliar.
1. Separate shape, context and a trading rule
A shape is a relationship among observed prices. Context describes where it appeared relative to information already available, such as the preceding move or a previously defined level. A trading rule must additionally state when it can act, how it enters and exits, how much exposure it permits and how costs are handled. Naming a pattern supplies none of those remaining rules.
Use ordinary OHLC from a specified symbol, price side, timeframe and provider. Calculated candles such as Heikin-Ashi change the inputs. Colours are configurable, so determine direction from open and close. A wick is not evidence of particular participants, order flow or a stop hunt. Record measurable facts before adding an interpretation.
2. Measure the candle before assigning a name
Let R be high minus low, B the absolute distance between close and open, U the upper wick and D the lower wick. The upper wick is high minus the greater of open and close; the lower wick is the lesser of them minus low. With valid OHLC, R equals B + U + D. Check price units with the pip and pip-value guide. These distances do not measure cash profit.
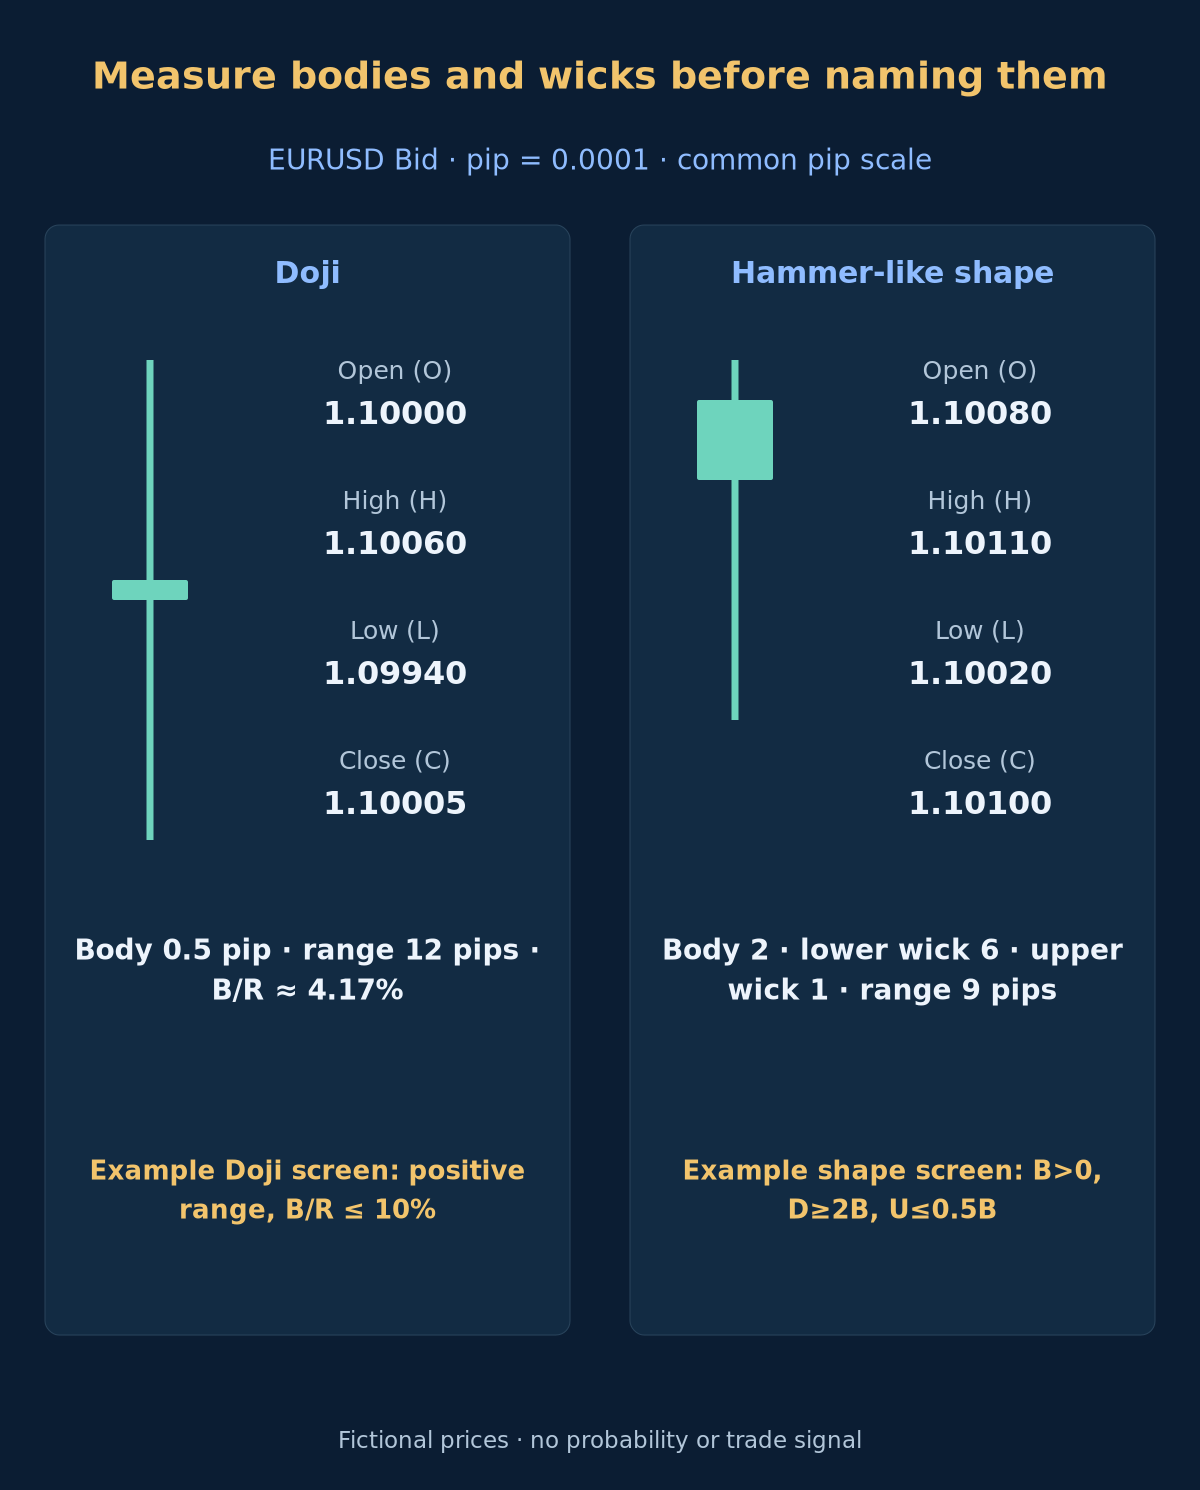
Definitions vary between authors and scanners. Here a Doji screen uses positive range and B / R at most 10%. The hammer-like screen requires positive body, D at least 2 times B and U at most 0.5 times B. These precise cutoffs make our examples reproducible; they are not a claim that one threshold is universally correct. If range is zero, do not calculate B / R. If body is zero, do not divide a wick by B or label it using our hammer ratio.
3. Doji: nearly equal endpoints, not a forecast
A Doji has equal or nearly equal open and close under the chosen tolerance. Its body can be small while its total range is large. The familiar word “indecision” is an interpretation of those endpoints, not a measurement of buyer and seller counts. Doji variations describe different wick arrangements; the name alone gives neither an entry direction nor a reliable probability.
Our EURUSD Bid example has O 1.10000, H 1.10060, L 1.09940 and C 1.10005. With pip size 0.0001, body is 0.5 pip and range 12 pips: B / R is about 4.17%, so it passes the stated 10% screen. The close is slightly above the open, but that does not turn the example into a BUY signal. Decimal precision and minimum price increments affect how a scanner sees small bodies.
4. Hammer-like geometry: a long lower wick
The shape has a body near the upper end of the range and a comparatively long lower wick. In traditional terminology, a hammer is considered in the context of a preceding decline. A positive-coloured body is not essential to the geometric idea. Define “small”, the wick proportions and the prior-context rule explicitly rather than deciding by the attractiveness of a screenshot.
For O 1.10080, H 1.10110, L 1.10020 and C 1.10100, body is 2 pips, lower wick 6 pips, upper wick 1 pip and total range 9 pips. The lower wick is 3 times the body and the upper wick 0.5 times it. This meets our shape screen. It does not by itself establish a preceding downtrend, support, a reversal or an executable trade.
5. The same shape changes meaning with prior context
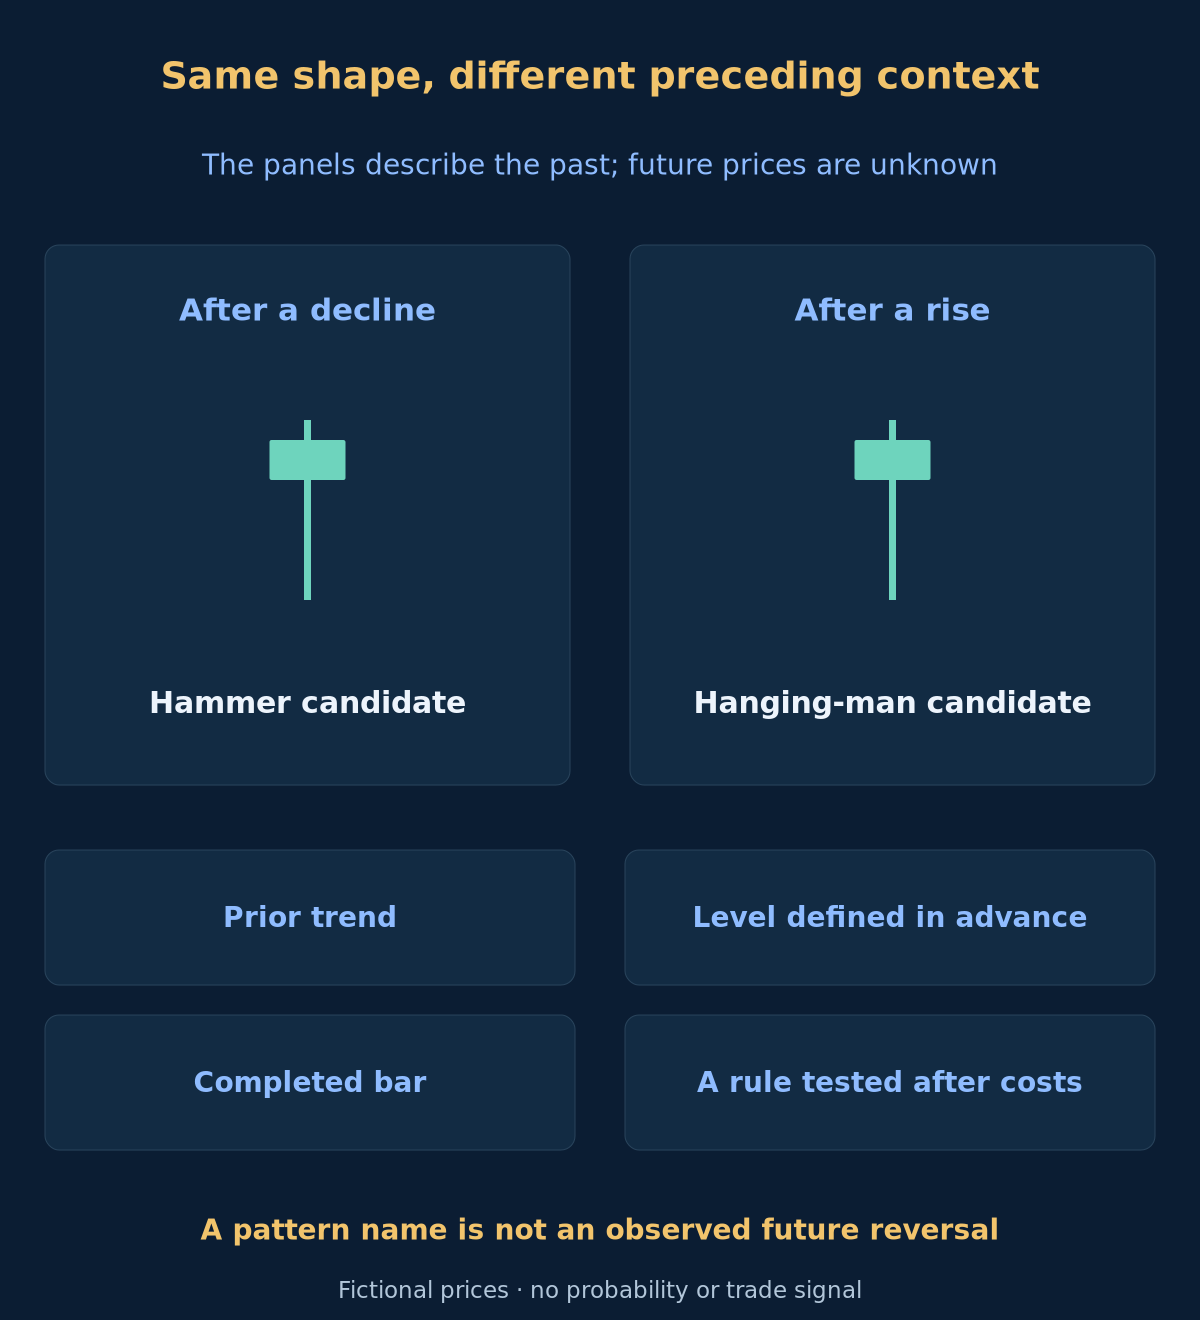
After a decline, that lower-wick shape may be called a hammer candidate; after a rise, the same geometry is traditionally called a hanging man. In an undirected range, assigning either reversal label may be inappropriate. The context panels deliberately reuse the same candle without drawing a future rally or decline. A traditional name is a description to investigate, not an observed future outcome.
Define the preceding trend and any support or resistance level using only information available before the candidate completed. State the lookback and timeframe in any test. A level drawn afterwards to fit a winning example introduces hindsight. Also compare candle size with recent movement: a striking-looking shape can still be tiny relative to spread or ordinary volatility.
6. Engulfing: state exactly what must be covered
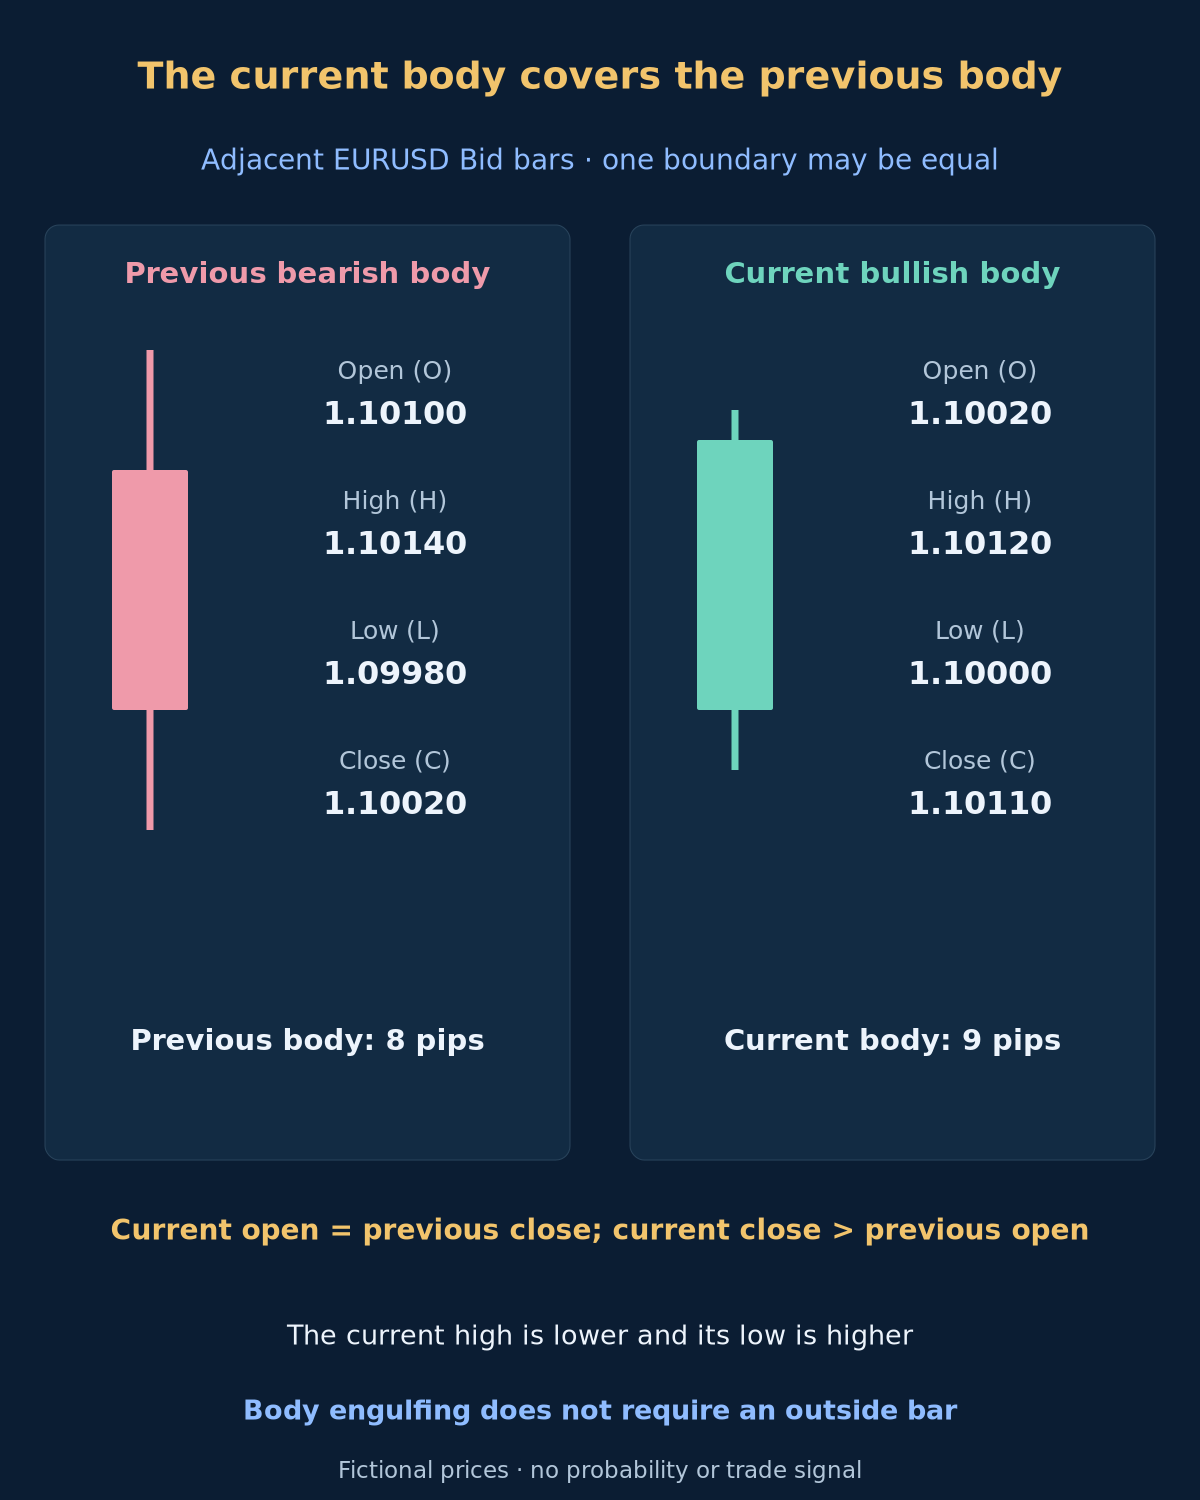
For our bullish body-engulfing variant, the previous body is bearish and the current body bullish. The current open is at or below the previous close, and the current close is at or above the previous open. At least one boundary must extend strictly beyond the old body. This permits equality at one boundary but excludes two opposite candles with exactly identical body endpoints. Wicks do not have to be engulfed under this definition.
The bearish mirror starts with a bullish body followed by a bearish body. Its current open is at or above the previous close and its current close at or below the previous open, with at least one strict extension. Other definitions require stricter inequalities, gaps or full-range coverage. Record the variant before scanning. Do not impose stock-market gap examples automatically on a continuously quoted Forex feed.
7. Read an engulfing example without inventing a gap
The table uses two adjacent fictional Bid bars with pip size 0.0001. The previous body is 8 pips and the current body 9 pips. The current open 1.10020 equals the previous close, while the current close 1.10110 is above the previous open 1.10100. It therefore passes our body-coverage variant without an opening gap. The prices do not establish any prior trend.
| Bar | Open (O) | High (H) | Low (L) | Close (C) |
|---|---|---|---|---|
| Previous bearish | 1.10100 | 1.10140 | 1.09980 | 1.10020 |
| Current bullish | 1.10020 | 1.10120 | 1.10000 | 1.10110 |
The previous high is 1.10140, above the current high 1.10120. The previous low is 1.09980, below the current low 1.10000. The full current range is therefore inside the previous range even though the real body engulfs the previous body. Body engulfing and an outside bar are different conditions. Neither label proves a reversal or a profitable entry.
8. Keep the price feed and execution separate
Ordinary MT4 Forex bars are Bid-based. A recognised pattern does not provide the historical Ask path or a guaranteed fill. A BUY opens on Ask and exits on Bid; a SELL opens on Bid and exits on Ask under the usual convention. Review spread and other costs before treating a small candle movement as a possible economic edge.
Two providers can produce different shapes because of data, session alignment or missing quotes. A historical gap may be a genuine discontinuity or a data problem needing investigation. Save the feed and timestamps. If a scanner rejects missing or invalid OHLC, retain that status instead of silently calling the observation a non-pattern.
9. Confirmation becomes known later
In MT4, shift 0 is the current unfinished bar and shift 1 the latest completed bar in that series. A developing Doji or engulfing body can disappear before the bar ends. A later confirming close is only known when that later bar has completed. Do not attach it to the earlier candle as information that was available then.
Confirmation is another condition, not a guarantee. If a rule waits for later price evidence, record that decision time and the price actually available then. Include failed confirmations and missed opportunities in a test. Adding several indicators derived from the same prices does not by itself demonstrate independent evidence. Keep the loss budget and position risk separate from the pattern name.
10. Validate a complete definition, not selected pictures
Before testing, freeze the price source, symbol, timeframe, pattern inequalities, equality policy, trend context, level construction and decision timing. Define outcomes and observation horizons, and include costs and all qualifying cases. Keep losses, ambiguous cases and missing records visible. Follow a backtesting protocol rather than collecting only convincing examples.
Evaluate the rule on data not used to choose its thresholds and report how many variations were tried. A high pattern count, a reversal percentage or an attractive chart does not establish net trading profitability. Results depend on entry, exit, position size, costs and sampling uncertainty. The numerical examples here only verify geometry. They are not a performance study or a recommendation to trade these shapes.
Optional: exact working definitions used in this guide
R = H - L
B = abs(C - O)
U = H - max(O, C)
D = min(O, C) - L
doji: R > 0 && B / R <= 0.10
hammer_shape: B > 0 && D >= 2 * B && U <= 0.5 * B
bull_body: C1 < O1 && C2 > O2 && O2 <= C1 && C2 >= O1 && (O2 < C1 || C2 > O1)
bear_body: C1 > O1 && C2 < O2 && O2 >= C1 && C2 <= O1 && (O2 > C1 || C2 < O1)
11. Questions about candlestick patterns
Is the 10% Doji cutoff a universal definition?
No. It is the declared tolerance for these examples. Authors and scanners use different absolute or relative tolerances. Record yours before testing, handle zero range explicitly and do not change it to fit the chart afterwards.
Must a hammer have a green body?
No. Open and close determine body direction, and colours can be changed. The long lower wick and body location describe the shape. The preceding context distinguishes traditional hammer and hanging-man interpretations; neither guarantees a reversal.
Must an engulfing candle also engulf the wicks?
Not under our body-only variant. The worked example covers the previous body while its full range stays inside the previous range. Other variants use different requirements; specify the exact one instead of treating all pattern labels as interchangeable.
Does a confirming candle make a pattern reliable?
It adds an observable condition at a later time. Whether that condition improves a particular rule after costs is a separate testing question. It cannot guarantee direction or be used as information available before it formed.
12. Sources and scope
Primary references: IG Academy on traditional pattern shapes and context, Bulkowski’s body-engulfing definition, in a paper hosted by Fidelity, Schwab’s discussion of bearish engulfing in a rally, MetaQuotes timeseries indexing and MT4 chart price basis. Checked 2026-10-19. Stock-market studies and descriptive pattern names are not Forex performance estimates. Thresholds, prices and calculations in our examples are declared teaching constructions.
Forex and leveraged trading involve substantial risk. This material is educational and is not investment advice. A named pattern, additional confirmation or correct arithmetic does not guarantee execution, limited loss or profit.