

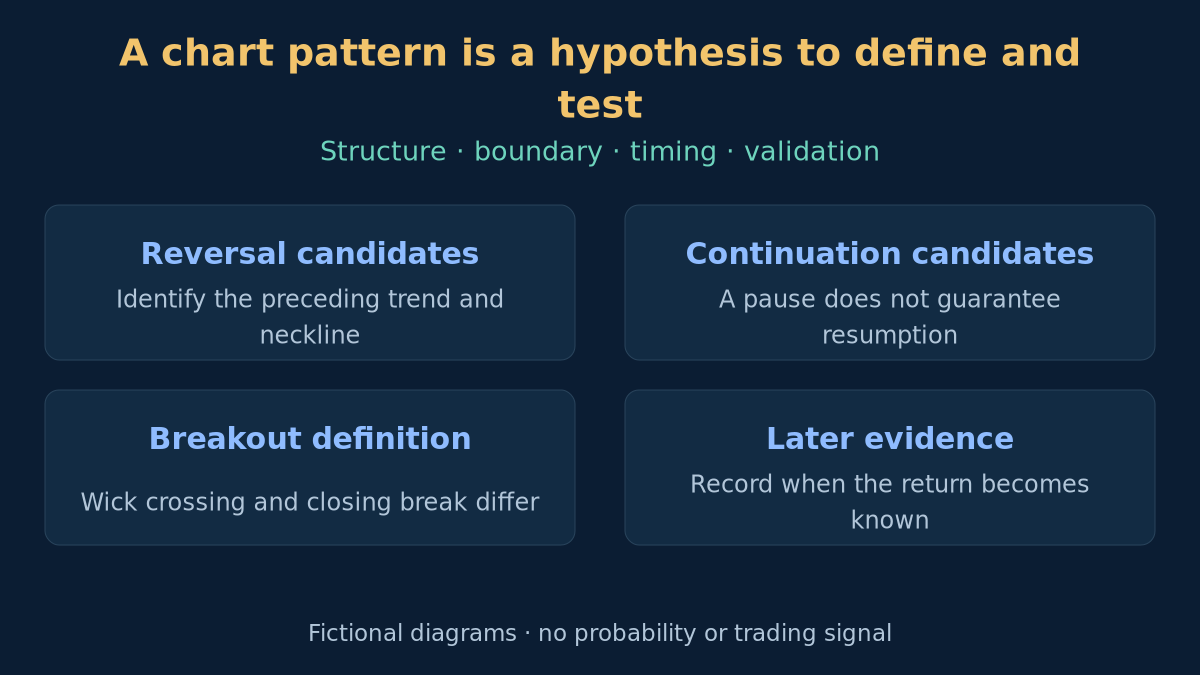
A double top can remain a range, a triangle can break against its preceding trend, and a price crossing can fail after the bar closes. Recognising a familiar outline does not settle any of those questions. This final guide in the cluster explains multi-bar structures and makes the timing of breakout evidence explicit. Read the guides on ordinary OHLC and Bid/Ask and individual candlestick patterns first if those foundations are unfamiliar.
1. Distinguish chart structures from candle names
A candlestick pattern describes relationships within a small group of bars. A chart pattern describes a broader arrangement of swings, boundaries and prior movement. The categories can overlap, but an Engulfing body does not establish a double bottom, and a Doji inside a triangle does not decide the breakout direction. Start with the price observations rather than the label you hope to find.
Specify the instrument, provider, timeframe and price side. Ordinary Forex charts and calculated charts such as Heikin-Ashi do not contain identical inputs. The same history may support more than one plausible outline. Record rejected and ambiguous candidates as well as the attractive ones; otherwise a pattern catalogue can become a collection of selected successes.
2. Reversal and continuation require prior context
Reversal describes a possible change relative to an earlier trend; continuation describes a possible resumption after a pause. Define that earlier trend before evaluating the formation. Without it, the words can lose their meaning. The market-structure guide explains how higher and lower swings depend on the chosen observation scale.
Separate the candidate stage, the boundary test and the later outcome in your notes. A reversal candidate is not an observed reversal, and a continuation candidate can fail. State how swings are recognised and how similar extremes must be. If identifying a pivot requires later bars on its right, the pivot becomes usable only after those bars are available.
3. Double tops and double bottoms
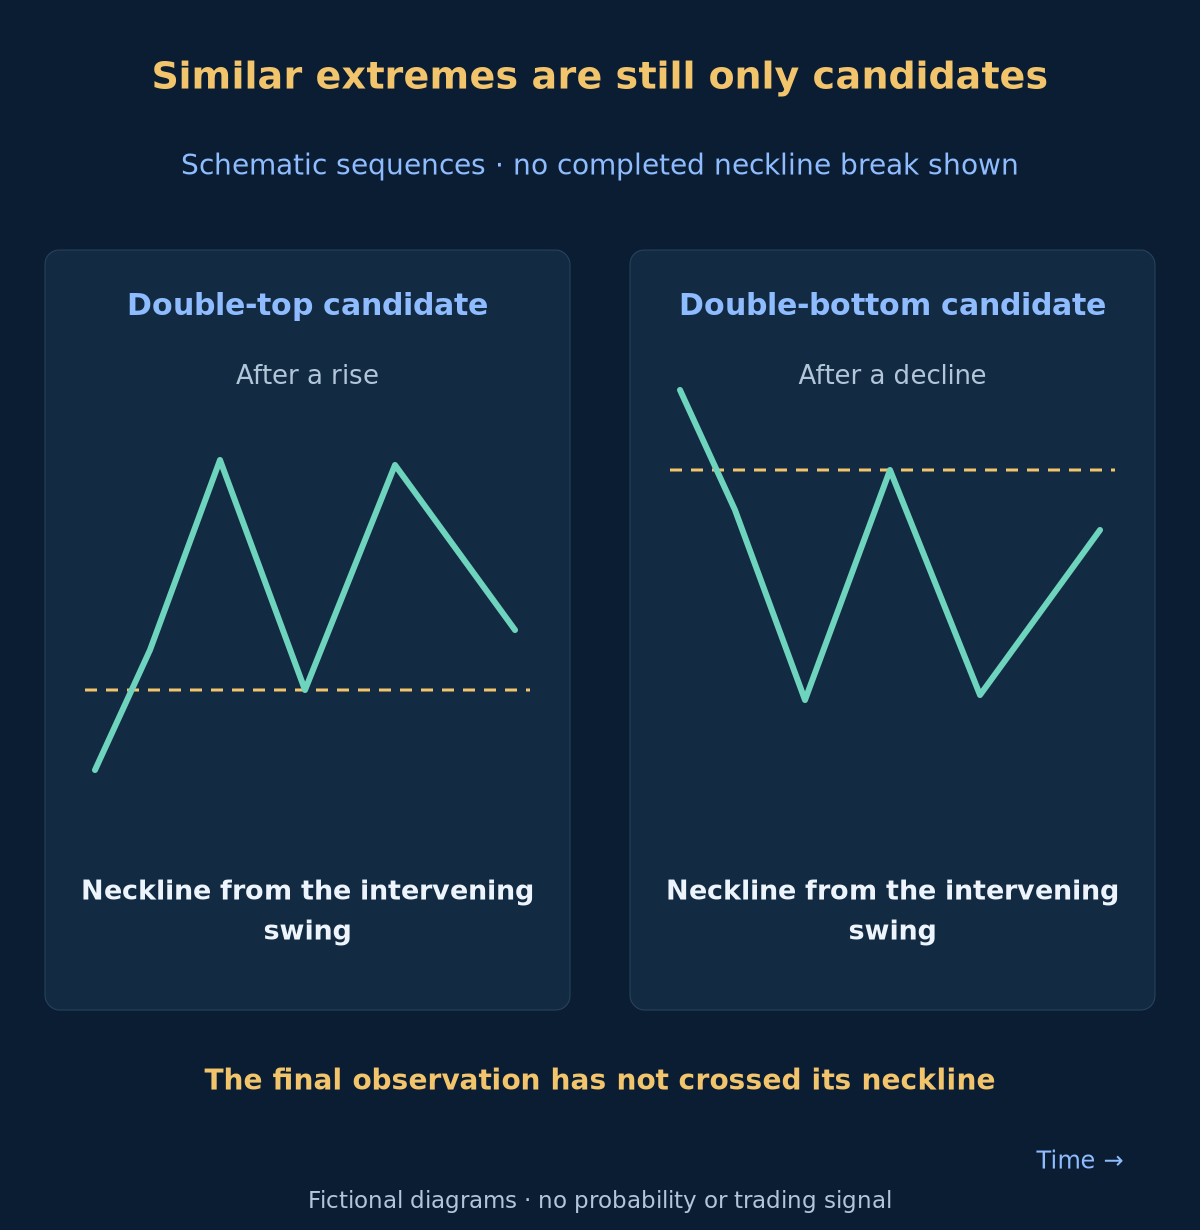
A double-top candidate has successive peaks near a declared price area, separated by a meaningful trough, in the context of an earlier rise. That intervening trough defines the simple neckline. The traditional completion condition is a break below it; a chosen implementation must say what counts as a break. Similar peaks alone do not show that a reversal has occurred.
A double bottom is the inverse construction after a decline: troughs separated by a peak, with an upward neckline break as the traditional completion condition. Specify tolerance, separation and the preceding trend rather than requiring a perfectly drawn letter. The panels stop before either neckline is crossed. They intentionally provide no successful future path to copy.
4. Head and shoulders: the neckline still matters
The usual head-and-shoulders top has a central peak above the flanking shoulders after a rise. Its neckline joins the intervening troughs and may slope. The inverse version follows a decline and uses a central trough below the shoulders, with a neckline through the intervening peaks. Exact symmetry is not a universal requirement; a reproducible detector needs its own tolerances.
A shoulder outline does not replace a completion rule. For a sloping neckline, calculate its level at the observation time instead of comparing every bar with a fixed horizontal price. Preserve the original anchor points and the time they became known. Moving a neckline after seeing the outcome changes the tested hypothesis and can hide a failed candidate.
5. Triangles describe compression, not certainty
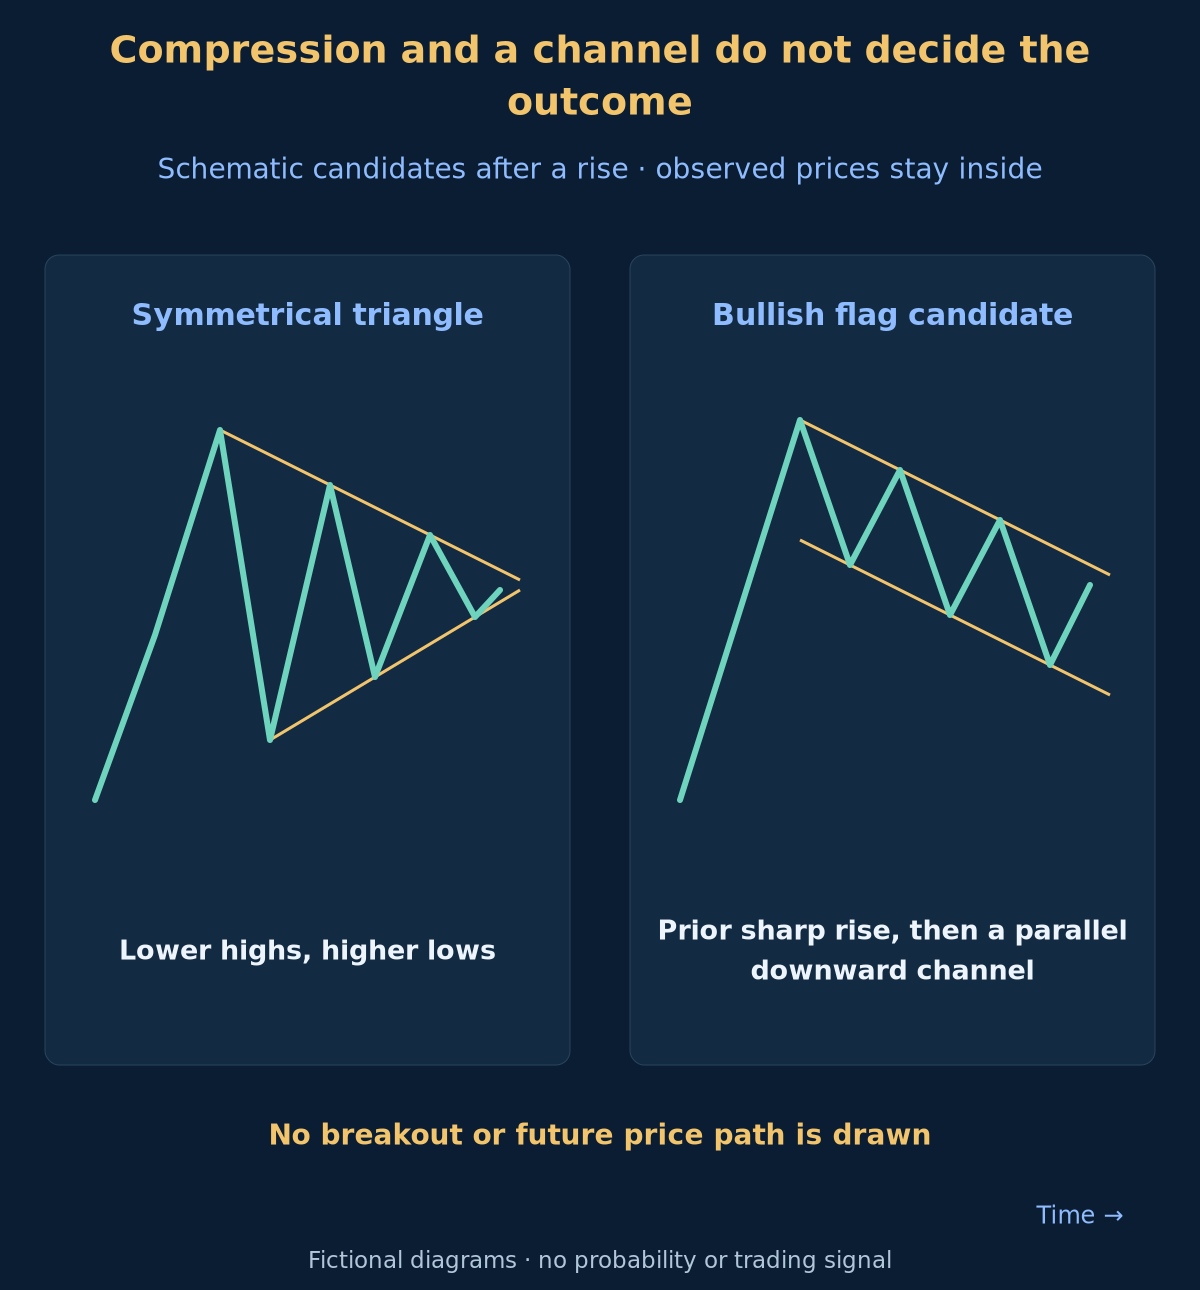
A symmetrical triangle has declining swing highs and rising swing lows. An ascending triangle combines a roughly horizontal upper boundary with rising lows; a descending triangle combines a roughly horizontal lower boundary with declining highs. Traditional directional interpretations are hypotheses. Even a formation commonly described as bullish can break down instead.
Define which observations anchor each boundary, how many contacts are required and what counts as a valid contact. Specify whether the lines use highs and lows or closing prices. Do not redraw them simply to rescue the latest bar. A narrowing range alone does not prove an accumulation of executable orders, a particular participant’s intention or an imminent expansion.
6. Flags and rectangles need a defined preceding move
A traditional bullish flag consists of a marked rise followed by a relatively compact consolidation, often in a gently declining channel. A bearish flag mirrors that context. A pennant uses converging boundaries rather than a parallel channel. Name the prior move and consolidation window explicitly; a random channel without that context is not enough to establish a flag.
A rectangle uses roughly horizontal support and resistance around a trading range. It can develop after either direction of movement. The continuation label is conditional, and a retest after a break may never occur. The continuation panels end inside their boundaries: the fact that a shape is recognisable does not tell us where its next completed bar will close.
7. Define a breakout before looking for failures
A wick crossing, a close beyond a boundary and several closes outside it are different definitions. Choose the price side, buffer, equality policy and observation timing before scanning. A buffer expressed in pips must be converted using the specified symbol’s pip convention; it is not automatically the platform point or minimum tick size. See the pip and pip-value guide.
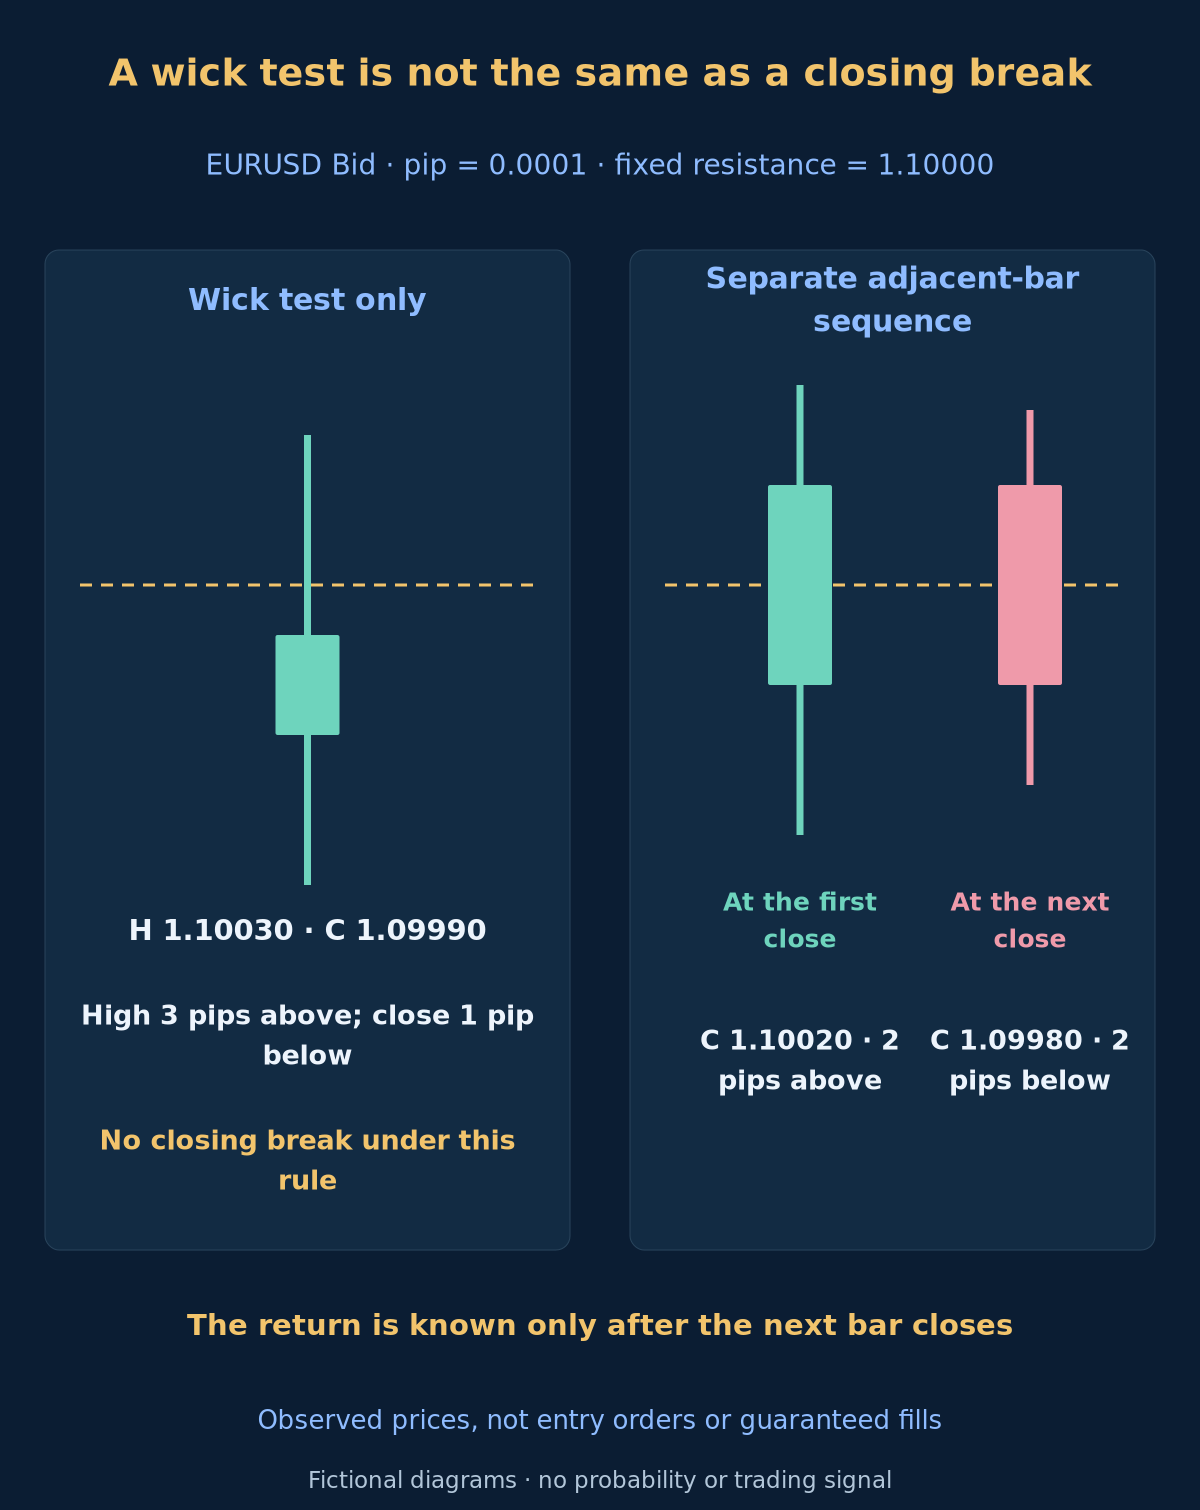
For the worked example only, an upward closing break means the completed Bid close is strictly above fixed resistance. No extra buffer is applied, and equality is excluded. We then label a return if the next completed close is at or below that same resistance. This is an explicitly chosen one-bar observation rule, not a universal definition of a false breakout or a trading strategy.
8. A wick test and a later return are different events
Use resistance 1.10000 and pip size 0.0001. The wick-test high 1.10030 is 3 pips above the level, but its close 1.09990 is 1 pip below it: there is no closing break under our rule. In the separate sequence, the first close 1.10020 is 2 pips above resistance. The next close 1.09980 is 2 pips below it. Only that next close supplies the return evidence.
| Observation | High | Close | Under the stated rule |
|---|---|---|---|
| Wick test | 1.10030 | 1.09990 | No closing break |
| First close | 1.10040 | 1.10020 | Closing break recorded |
| Next close | 1.10035 | 1.09980 | Return now observable |
At the first close, calling the later sequence a failure would use information not yet known. At the next close, the return can be recorded for this horizon. If that next bar is missing or not yet complete, retain a pending or unavailable status. A wick-only excursion might be a failed break under an intrabar definition, but it was never a closing break under the definition used here.
9. Keep decision time, volume and execution distinct
In MT4, shift 0 refers to the current unfinished bar and shift 1 to the latest completed bar. A later confirmation or retest delays the earliest decision time. Save the actual information set at that time, not the final chart alone. MT4 Forex volume commonly represents tick activity from the feed, not consolidated traded volume across the whole Forex market; it cannot establish all participants’ buying or selling.
A Bid-chart breakout does not supply the historical Ask path or guarantee a fill. Under the usual convention, BUY opens on Ask and closes on Bid; SELL opens on Bid and closes on Ask. Account for spread, commission, slippage and other costs. A pattern name also provides neither a position size nor a guaranteed maximum loss; keep risk budgeting separate.
10. Treat measured moves as arithmetic, then test the full rule
For a separate fictional horizontal range, support 1.09700 and resistance 1.10000 give height 0.00300, or 30 pips with pip size 0.0001. Adding that height to resistance gives an upper projection of 1.10300; subtracting it from support gives a lower projection of 1.09400. These are geometric reference levels, not expected returns, cash profits or promised destinations. They do not set a stop, fill price or time horizon.
Before a backtest, freeze the pattern definition, pivot-recognition delay, boundary construction, breakout filter, return horizon and treatment of missing data. Define entry, exit, sizing and costs separately. Keep every qualifying case, including losses and unresolved observations. Evaluate on data not used to select the rules and report how many variants were tried. Neither a high recognition count nor a collection of target hits proves net profitability. Equity-market pattern statistics are not Forex performance estimates.
Optional: exact illustrative rules and projection formulas
height = resistance - support
upper_projection = resistance + height
lower_projection = support - height
up_close_break = C[t] > resistance
down_close_break = C[t] < support
up_return_next = up_close_break && C[t+1] <= resistance
down_return_next = down_close_break && C[t+1] >= support
known_at = close_time_of_last_required_bar
11. Questions about chart patterns
Are similar peaks enough to confirm a double top?
No. They describe a candidate. The traditional completion condition concerns the neckline, and a test must specify its breakout rule and when its anchors became available. An outline without that timing is not a complete trading rule.
Must a symmetrical triangle continue the previous trend?
No. It describes converging boundaries and may break in either direction. Prior context explains the continuation interpretation but does not guarantee it. Define the boundary and filter without choosing them after seeing the next move.
Is every wick beyond resistance a false breakout?
That depends on the breakout definition. Our example requires a completed close beyond resistance, so a wick-only crossing does not qualify as a closing break. A later return is a separate observation that becomes known later.
Does a measured target predict profit?
No. It projects a price distance under a geometric convention. Whether price reaches it, when that happens, what fills are possible and what the trade earns after costs require separate evidence. The arithmetic alone does not answer those questions.
12. Sources and scope
Primary references: IG Academy on reversal structures, IG Academy on triangles and rectangles, IG’s overview including flags and pennants, Fidelity’s chart-pattern material on filters, false breakouts and measured moves and MetaQuotes on tick volume. Checked 2026-10-19. Our diagrams, prices, buffer choice and return horizon are declared teaching constructions. No probability or performance estimate is supplied.
Forex and leveraged trading involve substantial risk. This material is educational and is not investment advice. A recognised pattern, a confirming close or a measured projection does not guarantee direction, execution, limited loss or profit.