

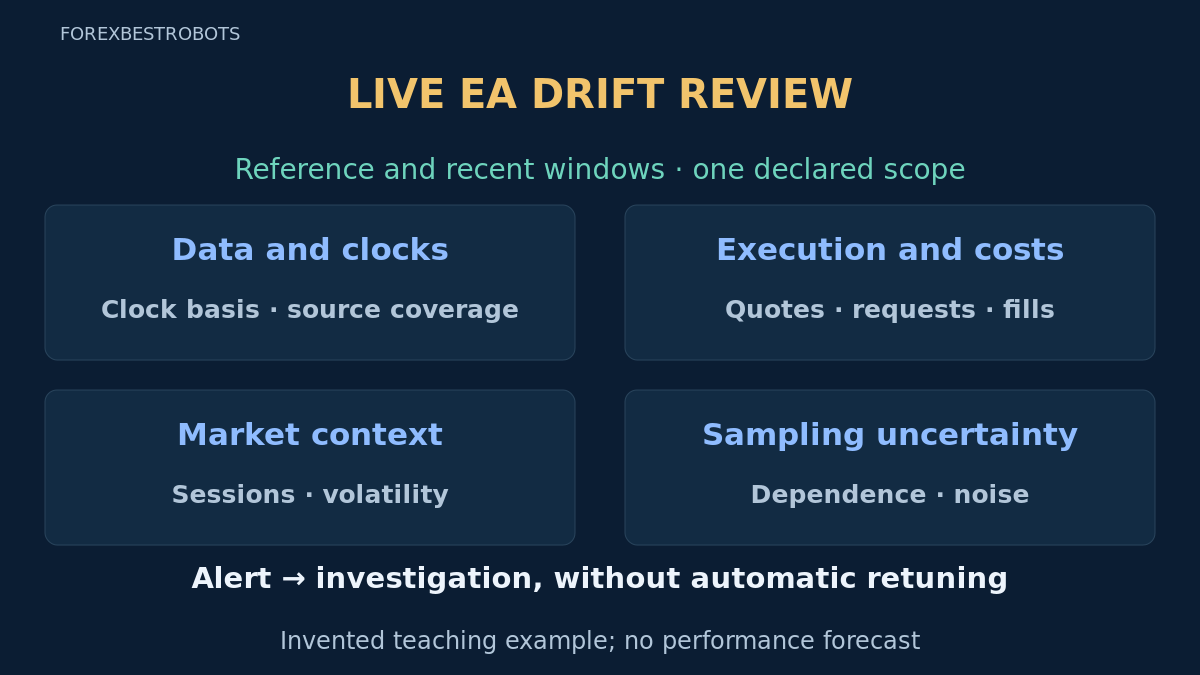
A live EA may show different fills, costs or results from its reference period. Call this an observed change before assigning a cause. A losing streak, one slow response or a stable average alone cannot establish that the trading edge has vanished or that execution is normal.
Separate data problems, execution changes, market context and sampling uncertainty. Use the reconciliation guide to establish the records and the forward protocol to preserve the original comparison rules. This final guide connects an alert to investigation and documented revalidation, not automatic trading action.
1. Define what the alert actually says
Write the metric, unit, source, reference window, recent window and review schedule. Keep the original investigation threshold and its version. An alert means that the specified condition was observed; it does not identify a broker fault, market regime or strategy failure by itself.
For this invented review, flag a recent window with at least 2 complete matched entries whose measured adverse slippage is strictly above 1.0 pip. Equality does not count. This is an authored investigation rule, not a universal tolerance or calibrated statistical control chart. No false-alarm probability or profitability test is calculated.
2. Keep the reference comparable
Identify build, inputs, account, mode, broker server, actual symbol and contract, order type, side, volume, session and data basis. Compare like scopes or show the differences explicitly. Keep a reference frozen rather than replacing it whenever a new window looks better. Demo and live fills are different evidence; see the mode-comparison guide.
This separate teaching fixture assumes build EA-R and inputs K1 on one declared live USD account trading EURUSD. Both windows use the same configuration and comparison scope. It is not a continuation of the previous guide's demo sample. All observations here are invented, and no capital allocation or working controller is supplied.
3. Keep competing explanations separate
Treat an explanation as a hypothesis until the evidence supports it. Several causes can coexist. A change in one field does not prove the direction of its effect on profitability.
- Data: missing records, changed feeds, stale quotes, clock offsets or revised inputs can invalidate comparisons.
- Execution: fills, rejection patterns, spread, commission or financing may change within otherwise comparable conditions.
- Context: sessions, volatility or event exposure may differ without an EA-code change.
- Sampling: small, dependent or repeatedly selected observations can produce unstable summaries.
Record evidence that supports or weakens each hypothesis. A convenient story is not a diagnosis. Do not tune a strategy parameter to conceal an unresolved data or ownership problem.
4. Retain all known request outcomes
These disjoint categories describe the known request inventory in each invented calendar window. Complete matched fills have valid send-time quotes and broker entry records. The table is not a count of all possible decisions, a win rate or a guarantee of full source coverage.
| Known request category | Reference | Recent |
|---|---|---|
| Complete matched fill | 20 | 20 |
| Confirmed rejection | 2 | 3 |
| Unresolved request | 2 | 3 |
| Total known requests | 24 | 26 |
Reference requests total 24; recent requests total 26. Only 20 fills in each window enter the price statistics. The 2 versus 3 confirmed rejections and 2 versus 3 unresolved requests remain visible. A timeout is not automatically a rejection. Filled-only statistics cannot describe every attempt; unresolved records hold back a complete performance sign-off and need the earlier reconciliation procedure.
5. Give entry slippage the correct sign
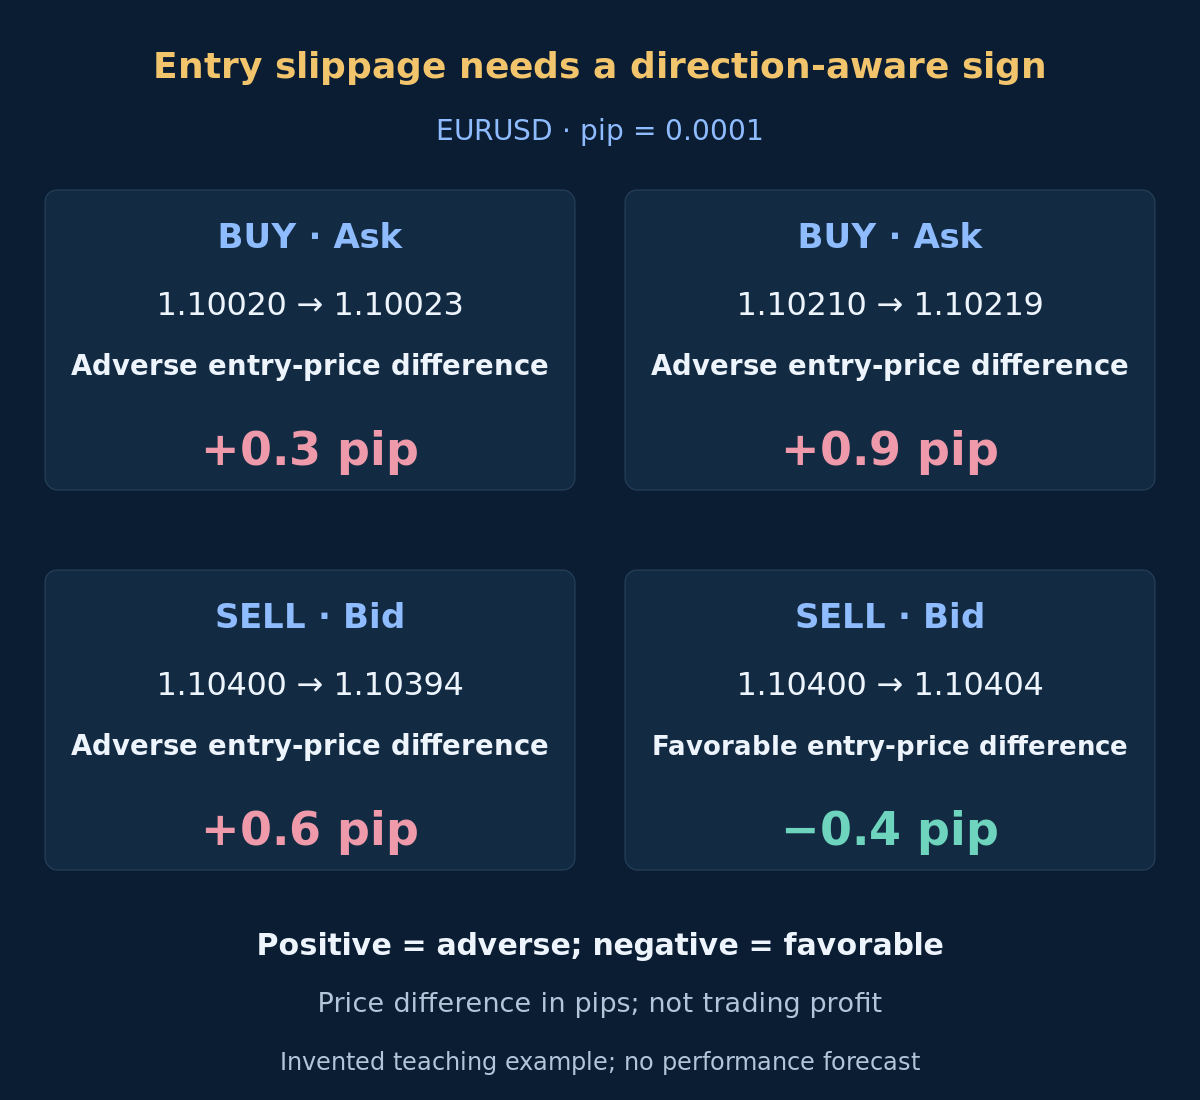
Assume EURUSD quotes with point size 0.00001 and pip size 0.0001, so a pip contains 10 points. Verify the actual symbol specifications elsewhere. For this entry comparison, define s_BUY = (fill_Ask − send_Ask) / pip and s_SELL = (send_Bid − fill_Bid) / pip. Positive is adverse for either direction; negative is favorable.
The table gives four independent arithmetic examples, not selected rows from the later cohorts. Use the client's recorded Ask for BUY and Bid for SELL, with the matched fill of that same order. Do not compare a BUY fill with Bid or a SELL fill with Ask. Values below are pips, not account money, maximum losses or expected returns.
| Case | Side | Client quote at send | Entry fill | Signed slippage · pip |
|---|---|---|---|---|
| A | BUY | 1.10020 | 1.10023 | +0.3 |
| B | BUY | 1.10210 | 1.10219 | +0.9 |
| C | SELL | 1.10400 | 1.10394 | +0.6 |
| D | SELL | 1.10400 | 1.10404 | −0.4 |
6. Respect the limit of the quote benchmark
A client quote observed when sending is a documented benchmark, not a guaranteed price executable at the broker on arrival. Record quote age, receipt basis, requested price and actual fill. Client-observed request duration is not pure broker-processing time; mixed clocks cannot decompose network and server delay reliably.
Keep spreads, fees and financing in their own correctly defined records. A measured price difference is already reflected in the actual fill-based result; do not deduct it again from booked profit. The cost guide explains the accounting. This pip metric is also distinct from the platform's order-deviation setting; do not copy its number into an order parameter without checking units and broker behavior.
7. Inspect the distribution, not just the median
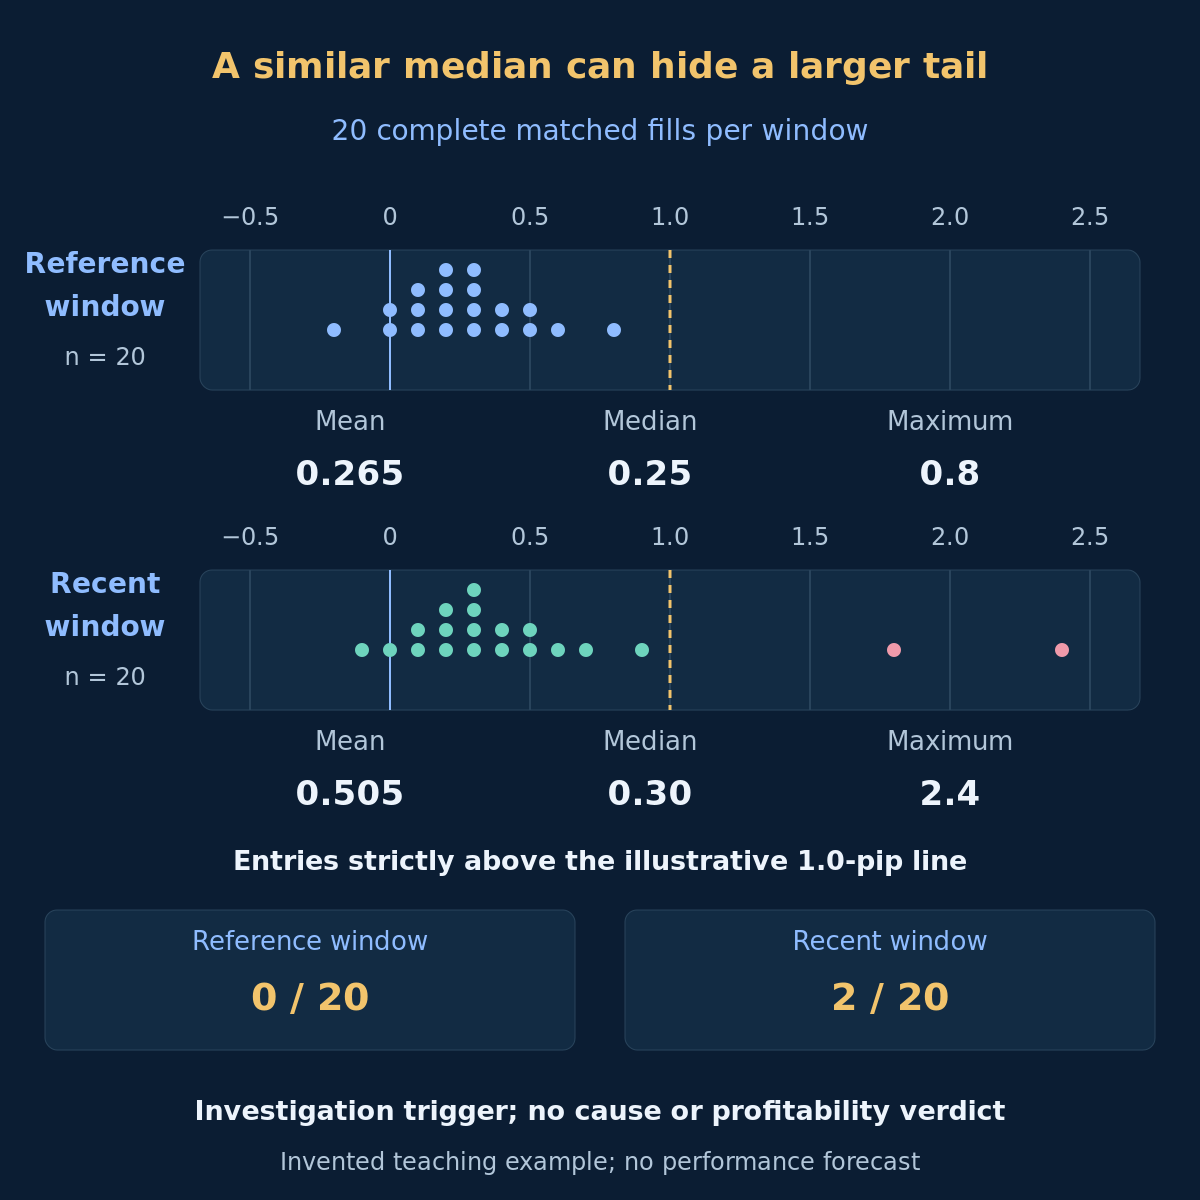
The complete filled cohorts happen to contain 20 entries each. Reference mean is 0.265 pip and median 0.25; recent mean is 0.505 and median 0.30. The median moves modestly while the maximum rises from 0.8 to 2.4. These descriptive sample values are not forecasts or an estimate of guaranteed future execution.
There are 0 reference and 2 recent fills strictly above 1.0 pip, so the authored recent-window trigger fires. Investigate the tail while retaining the excluded request outcomes. The window ends at its declared calendar cutoff, not when enough favorable fills accumulate. An adverse entry-price difference does not tell whether the eventual trade won or lost.
Optional: inspect the invented samples and reproduce the arithmetic
Sorted signed-pip samples, each value representing a separate complete matched fill. Reference: −0.2, 0, 0, 0.1, 0.1, 0.1, 0.2, 0.2, 0.2, 0.2, 0.3, 0.3, 0.3, 0.3, 0.4, 0.4, 0.5, 0.5, 0.6, 0.8. Recent: −0.1, 0, 0.1, 0.1, 0.2, 0.2, 0.2, 0.3, 0.3, 0.3, 0.3, 0.4, 0.4, 0.5, 0.5, 0.6, 0.7, 0.9, 1.8, 2.4.
Entry examples: (1.10023 − 1.10020) / 0.0001 = +0.3; (1.10219 − 1.10210) / 0.0001 = +0.9; (1.10400 − 1.10394) / 0.0001 = +0.6; (1.10400 − 1.10404) / 0.0001 = −0.4. Sample means: 5.3 / 20 = 0.265 and 10.1 / 20 = 0.505. Sample medians: (0.2 + 0.3) / 2 = 0.25 and (0.3 + 0.3) / 2 = 0.30. Results are pips; decimal points and thousands separators follow English numeric notation.
8. Review context and sample limitations
Check the recorded sessions, volume, spread, volatility and event exposure available as of each decision. A changed mix can change the aggregate distribution. Compare declared strata when evidence permits, report small cells and keep the full aggregate too. Do not invent causal regime labels from a convenient chart after seeing the loss.
Twenty fills are not necessarily independent observations or an adequate validation sample. Overlapping windows and repeated searches increase the opportunities to find alarming patterns. A normal-looking median does not prove stable tails; a flagged tail does not prove a permanent change. Keep uncertainty explicit instead of adding uncalibrated statistical claims.
9. Respond under the existing risk policy
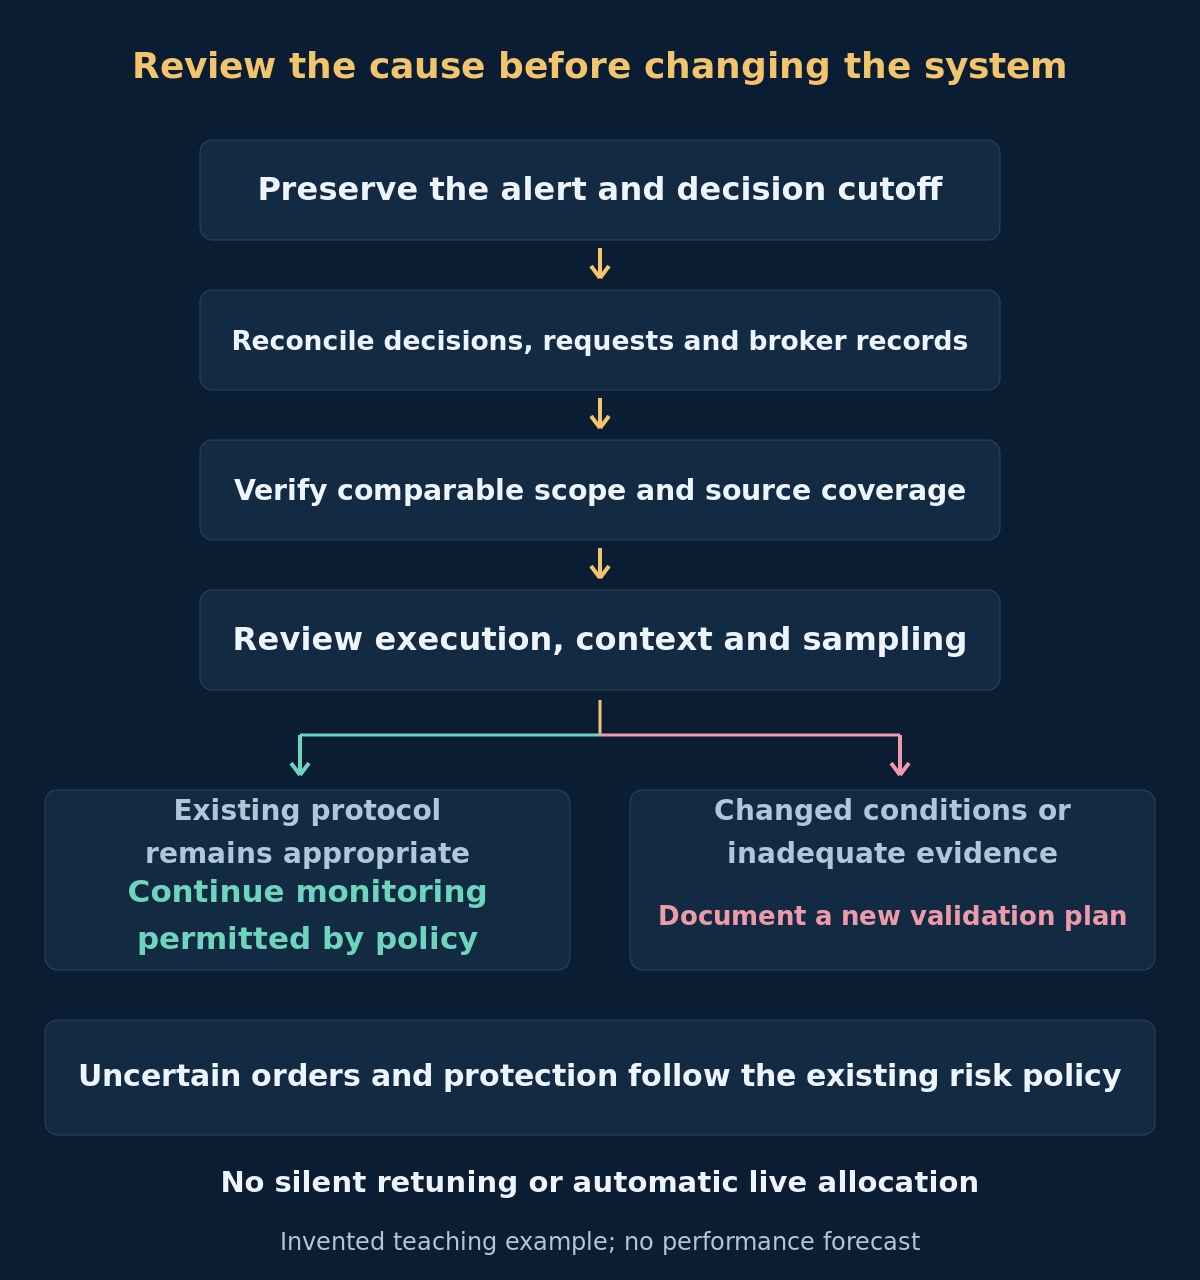
Uncertain order state, missing protection or other operational faults require the established response, not a wait for a scheduled performance review. Follow the account-risk policy and operational monitoring guide. This audit does not authorize duplicate entries, liquidation, wider stops or higher exposure.
Preserve the alert, raw records, scope differences, suspected cause and action taken. Repair documented operational issues through the tested procedure, then assess whether the comparison remains valid. If evidence is still incomplete, leave the performance conclusion inconclusive. An alert is not a reason to silently erase the old baseline or optimize away a losing period.
10. Document the revalidation decision
A changed strategy rule, risk rule, broker contract, feed or materially different operating environment may require a new validation plan. Record the reason, affected interval, new version and criteria before observing the new result. Use the forward protocol again and preserve all earlier variants; see the overfitting guide for selection limits.
- Are reference and recent scope, units and timestamps comparable?
- Are rejected, unmatched and unresolved requests visible outside the filled-only statistics?
- Are BUY and SELL price differences signed correctly without double-counting costs?
- Have data, execution, context and sampling explanations been kept separate?
- Does the action follow the existing policy, with changes recorded as a new validation version?
Write a bounded conclusion: observed issue and supporting evidence, unresolved hypotheses, operational action and whether a new protocol is needed. Keep the equity and drawdown review separate from this execution metric. Continuing monitoring is not proof of an edge, and a revalidation plan is not permission for new live funding.
11. Questions about live drift review
Does positive slippage mean a profitable trade?
Not in this convention. Positive means an adverse entry-price difference for BUY or SELL; negative means favorable. Eventual trade profit depends on exits and costs and is a separate quantity.
Can a stable median prove execution is unchanged?
No. The example's medians are close while the recent tail is larger. Inspect the whole distribution and all request outcomes, with the same declared comparison scope.
Does the illustrative alert prove broker or strategy failure?
No. It triggers investigation of an observed condition. The example does not establish causation, statistical significance or future loss, and unresolved requests still require reconciliation.
Should I retune immediately after a losing streak?
A streak alone is insufficient evidence for a new parameter choice. Follow the existing operational policy, investigate the records and context, and predeclare a separate validation version if rules change.
12. Sources and scope
Primary sources: MQL4 OrderSend and BUY/SELL price sides, MQL4 symbol properties and point units, and NIST guidance on process monitoring and control-chart limits. Sources checked on 2026-10-18. The illustrative trigger is authored here; it is not a NIST-calibrated control limit or a platform recommendation.
All requests, prices, cohorts and thresholds are invented teaching inputs, not verified live performance or original tester reports. No trading strategy, expected return, loss ceiling, causal diagnosis or automatic risk controller is supplied. Review and revalidation improve traceability; neither guarantees profitable or safe trading.