

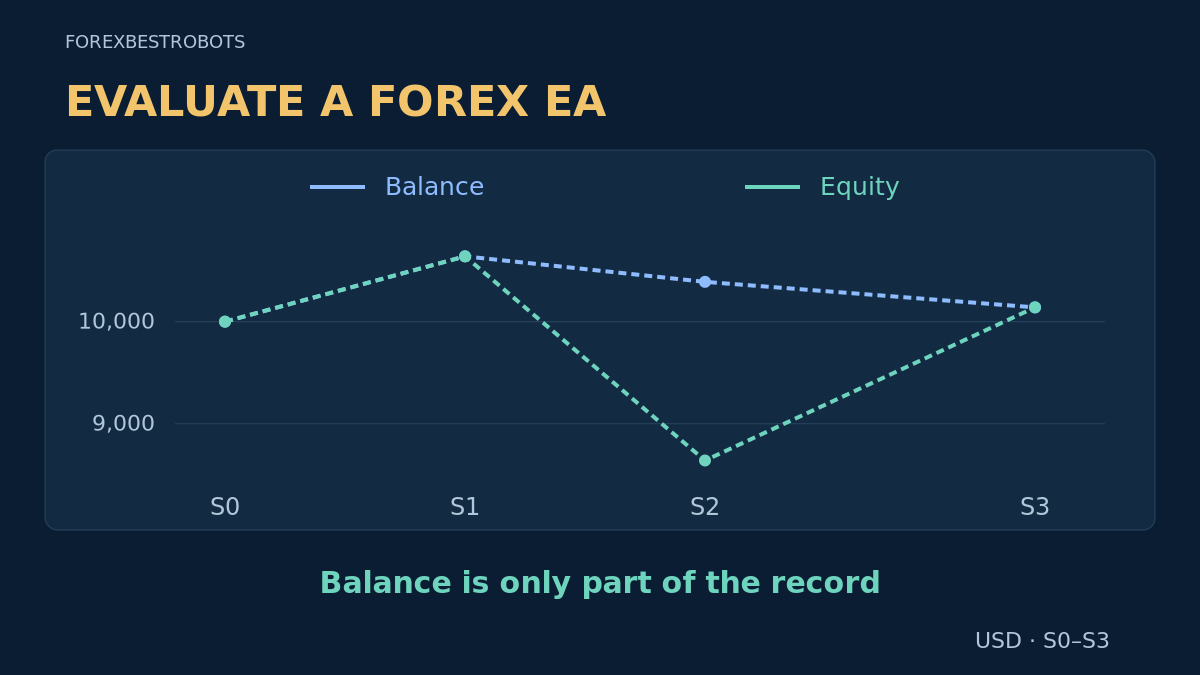
A rising balance or a large return does not tell you how an Expert Advisor earned it, what remained open, or whether another account can reproduce the conditions. A useful evaluation starts with the record, then checks the risk taken to produce it.
Use this sequence: identify the evidence, reconcile equity and cash flows, read several metrics together, and record what remains unknown. The worked example below is invented. It evaluates a small record; it does not rank products or establish a profitable EA.
1. Define exactly which record you are evaluating
Keep a dated review sheet for one account and one documented configuration. A backtest, a demo forward test and a live account answer different questions. Label each separately instead of joining their curves into one apparently continuous track record.
- Identity: broker/server, live or demo, account currency and standard or cent units, plus the monitoring link and review time.
- Strategy: EA version, input file, symbols, timeframes, lot-sizing method and changes during the period.
- Coverage: first and last available records, last update, filters, missing intervals and whether open positions are visible.
- Account context: deposits, withdrawals, credits, leverage, manual trades, other EAs and available trade/equity exports.
A long account history is not automatically a long history for the current settings. Mark version changes, risk increases and account replacements. If the configuration or earlier period cannot be reconstructed, keep that limitation visible rather than assigning the whole account result to today's EA.
2. Verify the source and separate account results from EA results
Broker-connected monitoring provides more evidence than a screenshot, but read what its verification actually covers. Myfxbook distinguishes a history matching the broker's records from verification that the uploader controls trading privileges. Neither proves which code placed every trade or guarantees future results. Check account type and the latest successful update separately.
An account can contain manual trades and several systems. Reconcile ticket history with the documented deployment and Magic Number scope; a number or comment alone is not conclusive attribution. Check for filters and omitted history. FX Blue documents publication start filters and broker-truncated histories; absence from the displayed list need not mean no earlier trading occurred.
3. Put balance and equity beside each other
Balance records realized account changes; equity also reflects the current value of open positions under the broker's account calculation. Check credits and charges instead of assuming every account uses the same convention. A system can close small winners while carrying a large open loss. If open P/L is hidden or stale, that part of the assessment is incomplete.
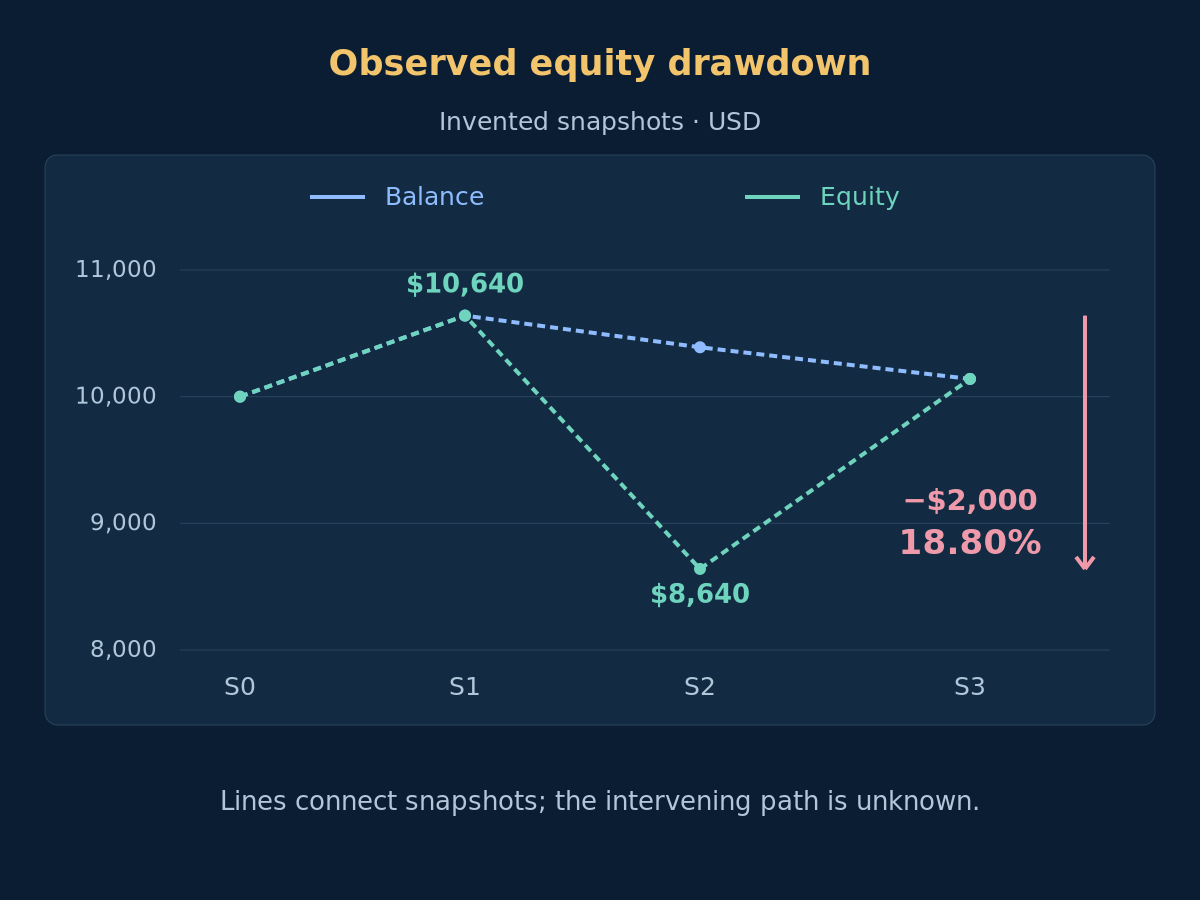
Consider these invented USD snapshots, with no deposits, withdrawals, credits or other adjustments. Start at S0. By S1, eight fully closed tickets have each earned $80 net. By S2, one ticket has closed at −$250 and the remaining ticket has floating P/L of −$1,750 including accrued charges. By S3, that last ticket has closed at −$250 and nothing remains open.
| Snapshot | Balance · USD | Open P/L · USD | Equity · USD |
|---|---|---|---|
| S0 | $10,000 | $0 | $10,000 |
| S1 | $10,640 | $0 | $10,640 |
| S2 | $10,390 | −$1,750 | $8,640 |
| S3 | $10,140 | $0 | $10,140 |
The closed result ends at +$140, or +1.4% of the initial $10,000. Yet equity at S2 is only $8,640. The final recovery of the open ticket is an invented part of this example, not a reason to assume future losses will recover. The snapshots do not reveal prices or account values between observations.
4. Ask what the drawdown number actually measures
For these no-flow observations, equity peaks at $10,640 at S1 and later reaches $8,640 at S2: an observed decline of $2,000, or 18.80% of that peak. The largest observed balance decline is only $500, or 4.70%. Those figures describe different series. Neither should silently replace the other.
Record whether a published drawdown uses balance or equity, its sampling frequency, covered dates and treatment of cash flows. Reconstructed historic equity can be approximate; sparse observations can miss a deeper intraday trough. Our 18.80% is the maximum of the supplied snapshots, not a claimed tick-by-tick maximum, future loss limit or account stop-out estimate.
Optional: reproduce the snapshot drawdown
With positive equity and no external flows, set H_t = max(E_s for s ≤ t) and DD_t = (H_t − E_t) / H_t. Here (10,640 − 8,640) / 10,640 × 100 ≈ 18.80%. For balance, (10,640 − 10,140) / 10,640 × 100 ≈ 4.70%. The dollar and percentage maxima need not occur at the same observation in a different record. Monetary examples use USD; decimal points and thousands commas follow English numeric notation.
5. Read profit factor, win rate and average result together
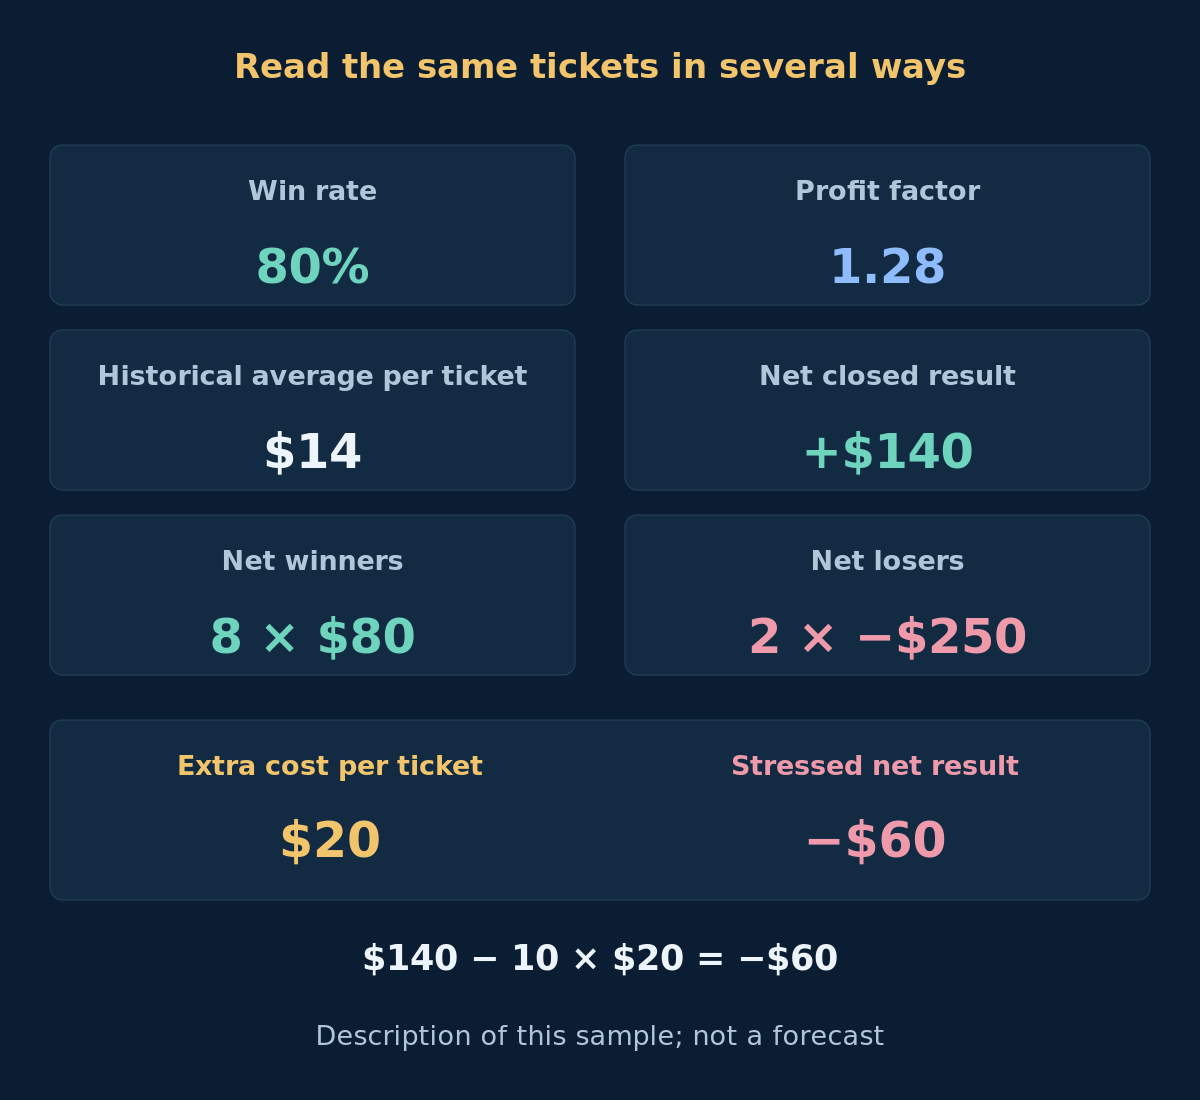
The same 10 fully closed tickets contain 8 net wins of $80 and 2 net losses of $250. Gross winning outcomes total $640; the magnitude of losing outcomes is $500. Therefore profit factor is 640 / 500 = 1.28, win rate 8 / 10 = 80%, net result 640 − 500 = $140, and historical average 140 / 10 = $14 per ticket. The average loss is larger than the average win despite the high win rate.
Here each ticket's signed net result already includes its commission and swap; spread and slippage are embedded in execution prices. Do not subtract those costs twice. State whether a provider uses net or price-only outcomes, how it treats zero results, partial closes and baskets, and which fees remain outside its statistics. No losing tickets makes the profit-factor denominator zero; it does not establish a reliable infinite edge.
6. Test how much of the result survives simple stresses
Apply an explicitly additional, invented $20 round-trip cost to every ticket: 10 × $20 = $200, so $140 − $200 = −$60. The winners become $60 each and losers −$270 each; stressed profit factor is 480 / 540 ≈ 0.89. This uniform surcharge is a sensitivity case, not a broker cost estimate or a second deduction of costs already paid.
As a separate concentration check, remove one $80 winner: the remaining sample nets $60 with profit factor 560 / 500 = 1.12. Keep the original result beside every stress. Removing trades is not a forecast or a corrected backtest; it asks whether a few outcomes dominate. For a real evaluation, use relevant spread, commission, swap and execution assumptions from the trading-cost guide.
7. Separate trading results from deposits and withdrawals
Reconcile the ledger in account currency. Over a period, equity change minus net external contributions measures account P/L only after credits, fees and other adjustments are classified consistently. That money amount is not automatically a percentage return. A deposit can raise balance without adding any trading profit; a withdrawal can lower it without creating a trading loss.
For an isolated example, start with $10,000, earn $400, then deposit $5,000 exactly at the period's end with no further trading. Ending equity is $15,400. The raw increase is 54%, but the no-flow trading period returned only 4%. For flows within a trading period, inspect the provider's return method and valuations around the flows; do not simply divide total profit by total deposits or subtract deposits from a curve and call it percentage drawdown.
8. Count decisions and market conditions, not just tickets
Our 10 tickets are not automatically 10 independent bets. Partial exits, a grid basket, repeated entries in one move and shared currency exposure can create dependence. Ask for the strategy's decision or basket grouping and overlapping positions. A long calendar period with little activity can still contain little information about its behaviour under stress.
Inspect different volatility, trend and execution conditions, losing stretches and time below the previous equity high. There is no universal trade count or number of months that proves robustness. Ask how many variants and accounts were tried, whether unsuccessful records disappeared, and which later chronological data remained untouched. The overfitting guide explains selection effects; a strong selected sample alone cannot measure future expectancy.
9. Compare records on a consistent basis
Two headline returns are not directly comparable when their dates, leverage, exposure, compounding or cost assumptions differ. Before comparing, align or explicitly disclose:
- Common start/end dates, account currency, cash-flow method and the treatment of open positions.
- EA versions, instruments, allowed simultaneous positions and the lot/risk schedule.
- Costs, update frequency, equity sampling and how missing data is handled.
- Whether the result is a backtest, demo or live record, with failures and configuration changes retained.
Equal lots do not imply equal risk across symbols, and multiplying a low-risk curve is not a faithful simulation of larger size. Margin constraints, volume steps, fills and liquidation can change. Use the MT4 backtesting guide for simulation evidence and the demo-versus-live guide for execution differences. This guide does not allocate a portfolio or prescribe a risk percentage.
10. Write a review decision with explicit limits
Use separate evidence gates rather than an unexplained score. Missing equity or unresolved attribution means incomplete, not safe. A documented mismatch with a review rule means that rule fails. Adequate records may support further controlled observation; they still cannot certify profitability, suitability or a maximum future loss.
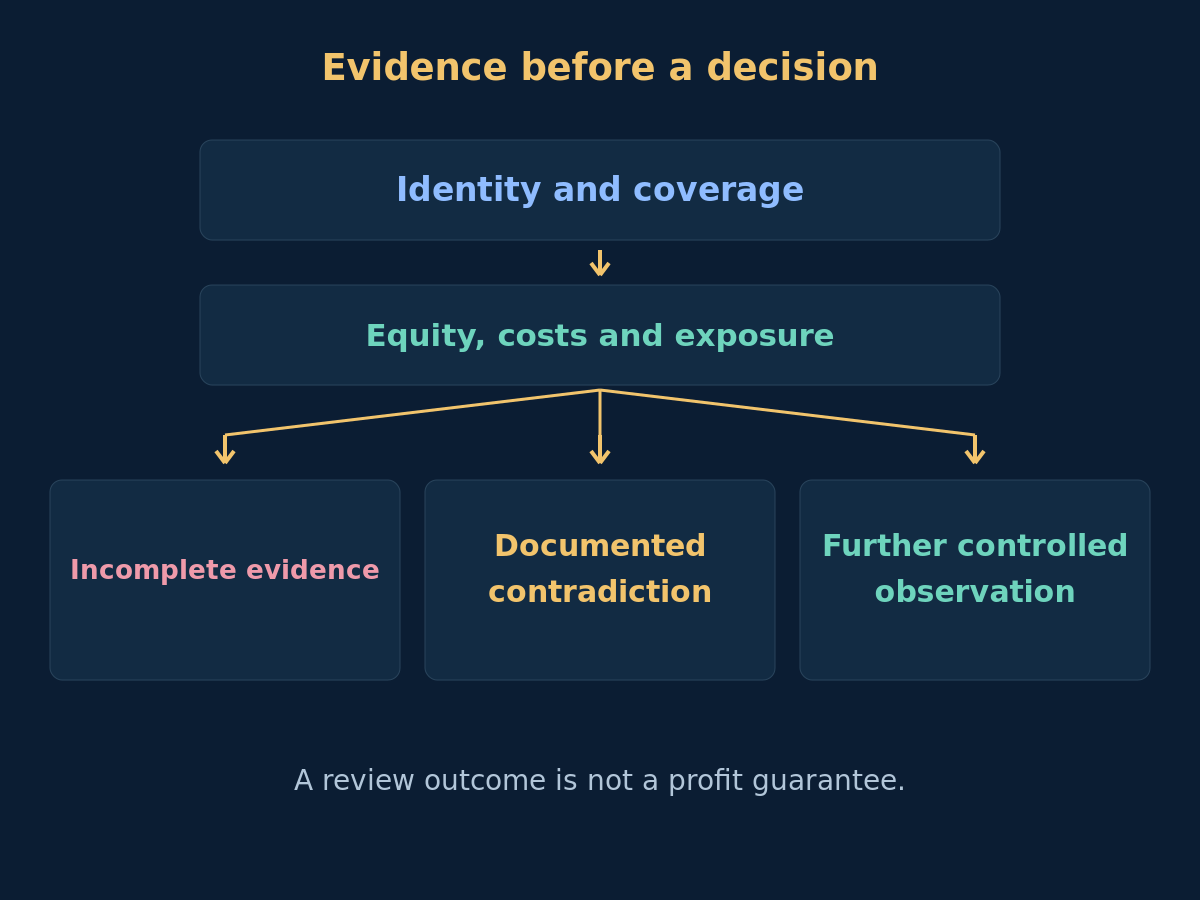
An actionable review sheet should answer these questions. Define any acceptance limits before looking at the result and retain rejected candidates as well as the eventual shortlist.
- Can I identify the account, configuration, full period and most recent update?
- Can I reconcile cash flows, closed tickets and current open exposure?
- Do I know the drawdown series, sampling and missing-history limits?
- Do costs, loss sizes and concentration explain the headline metrics?
- Have I separated descriptive results from later validation and any future claim?
- What evidence is still missing, and what observation would change the decision?
11. Questions about evaluating an EA
Does a verified account prove that the EA is safe?
No. Verification has a defined scope around the account record or its control. It does not establish code attribution, suitability, a trading edge or a future loss ceiling. Read the provider's definition and inspect the underlying exposure.
Is an 80% win rate enough to judge the system?
No. In our invented sample, average winners are $80 and average losers $250. The result depends on both sizes, costs and open exposure. A win percentage without those details is incomplete.
Can the next drawdown exceed the historical maximum?
Yes. A historical number describes a particular record and observation method. New market conditions, higher exposure, gaps or execution problems can produce a larger loss, including one missed by earlier sparse equity observations.
How many trades make an evaluation reliable?
There is no universal number. Dependence between tickets, market coverage, the size of rare losses and selection among many variants matter. More observations can improve evidence without guaranteeing that the process stays the same or becomes profitable.
12. Sources and scope
Use the official MetaTrader 4 report documentation for tester terminology, Myfxbook's verification guide for its verification scope, and the FX Blue FAQ for publication coverage and historic-equity limitations. Their statistics can use different conventions; the worked calculations here state their own definitions. Sources checked on 2026-10-18.
All tickets, snapshots and stresses in this guide are invented teaching data, not verified trading performance or a product recommendation. A positive historical average is not a forecast. The final comparison link below opens the site's product section; evaluate each product's own evidence separately.