

Adding oscillators is easy; deciding what each contributes is harder. Several green readings can repeat the same price information, and a condition that remains true is not a new event. A useful combination needs explicit roles, aligned observations and a test of the extra component's contribution.
1. Assign distinct roles rather than counting votes
Describe trend, range or transition with a predefined price-context rule. Then say what the oscillator is meant to add: a background state, a timing event or a condition that rejects an observation. An RSI value above its midpoint does not by itself prove an uptrend. Keep execution and exposure checks mandatory, outside any indicator vote.
The first momentum guide explains the measurements; the divergence guide explains confirmed swing comparisons. This final guide focuses on combining observations. Our synthetic example logs flags only; it deliberately supplies no complete entry, exit or position-sizing strategy.
2. Separate a state, an event and a gate
| Role | Question | Illustrative specification |
|---|---|---|
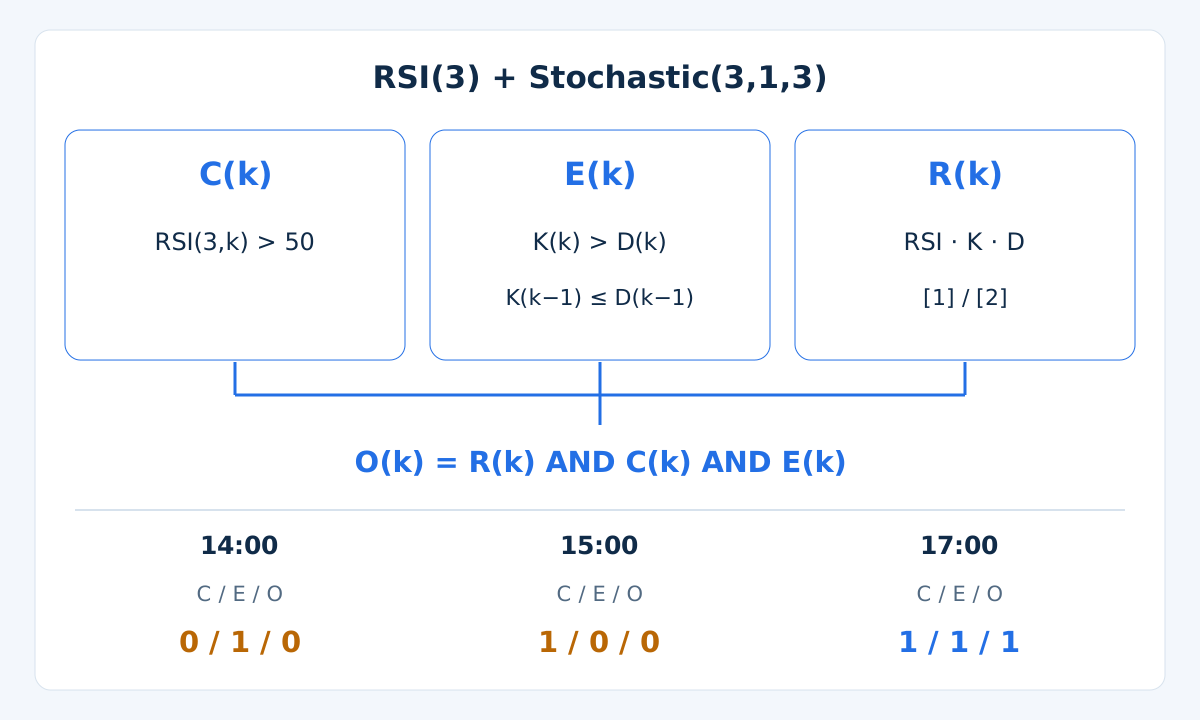
| State | What condition holds on this completed bar? | C(k): RSI(3,k) > 50. This can remain true across several bars. |
| Fresh event | What changed between two completed observations? | E(k): K(k) > D(k) AND K(k−1) ≤ D(k−1). This is a crossing, not just being above. |
| Data gate | Are the required current and previous values available and aligned? | R(k) requires valid RSI and Stochastic inputs for the stated comparison. Missing data cause a skipped observation. |
Scroll tables horizontally on a narrow screen.
The example records O(k) = R(k) AND C(k) AND E(k) on the same completed bar. Flags 1 and 0 mean true and false, not returns or trade directions. There is no waiting window: a crossing rejected by the state is not stored for later acceptance. A failed observation does not imply a sell signal.
3. Detect duplicated confirmation
Under the ratio and percentage conventions, Momentum = 100 + ROC for identical closing prices and lookback. Therefore Momentum > 100 and ROC > 0 are the same test wherever defined. Counting them as separate confirmations doubles a label, not information. A zero or missing reference price must be handled before using either formula.
RSI and Stochastic are different transformations, but they still share price inputs. Their agreement does not establish independent evidence. Different periods can change which observations pass without proving that the added filter improves net outcomes. Ask what extra distinction it makes and test that distinction.
4. Freeze the observation specification
Before inspecting results, record symbol, feed, candle boundaries, applied price, periods, smoothing, initialization, thresholds, strict or inclusive comparisons and missing-data treatment. For the example, RSI is calculated on Close with period 3. Stochastic uses a 3-bar high–low range, slowing 1 and %D = SMA(3) of %K.
These short settings and the midpoint condition are teaching choices, not optimized or recommended parameters. The invented path is designed to illustrate accepted, rejected and stale events. It is not evidence about a live market. No overbought/oversold band, divergence condition or higher-timeframe filter is added to the example's flags.
5. Reproduce the synthetic H1 inputs
These EURUSD Bid bars are invented, use one assumed server clock and are labeled by closing time. Compute from the listed prices without rounding intermediate values. No orders, fills or account returns are simulated.
| H1 close time | Bid high | Bid low | Bid close |
|---|---|---|---|
04:00 | 1.10030 | 1.09970 | 1.10000 |
05:00 | 1.10130 | 1.09970 | 1.10100 |
06:00 | 1.10230 | 1.10070 | 1.10200 |
07:00 | 1.10230 | 1.10120 | 1.10150 |
08:00 | 1.10280 | 1.10120 | 1.10250 |
09:00 | 1.10330 | 1.10220 | 1.10300 |
10:00 | 1.10330 | 1.10170 | 1.10200 |
11:00 | 1.10310 | 1.10170 | 1.10280 |
12:00 | 1.10310 | 1.10150 | 1.10180 |
13:00 | 1.10210 | 1.10090 | 1.10120 |
14:00 | 1.10190 | 1.10090 | 1.10160 |
15:00 | 1.10290 | 1.10130 | 1.10260 |
16:00 | 1.10290 | 1.10160 | 1.10190 |
17:00 | 1.10340 | 1.10160 | 1.10310 |
At 07:00, seed RSI's smoothed gain and loss magnitude with arithmetic means of the first 3 close changes: G = 0.002 / 3, L = 0.0005 / 3, RSI 80. Then use new average = (2 × previous average + new value) / 3 and RSI = 100 − 100 / (1 + G/L). For Stochastic, %K = 100 × (Close − LowestLow) / (HighestHigh − LowestLow). The range includes the observed bar.
The first complete Stochastic signal average appears at 08:00, but a crossing also needs the previous signal average. The first fully checkable comparison is at 09:00. If a required reading is missing or the high–low denominator is zero, follow a documented convention or skip the observation; do not manufacture a crossing from zero.
6. Read the event log, not just the lines
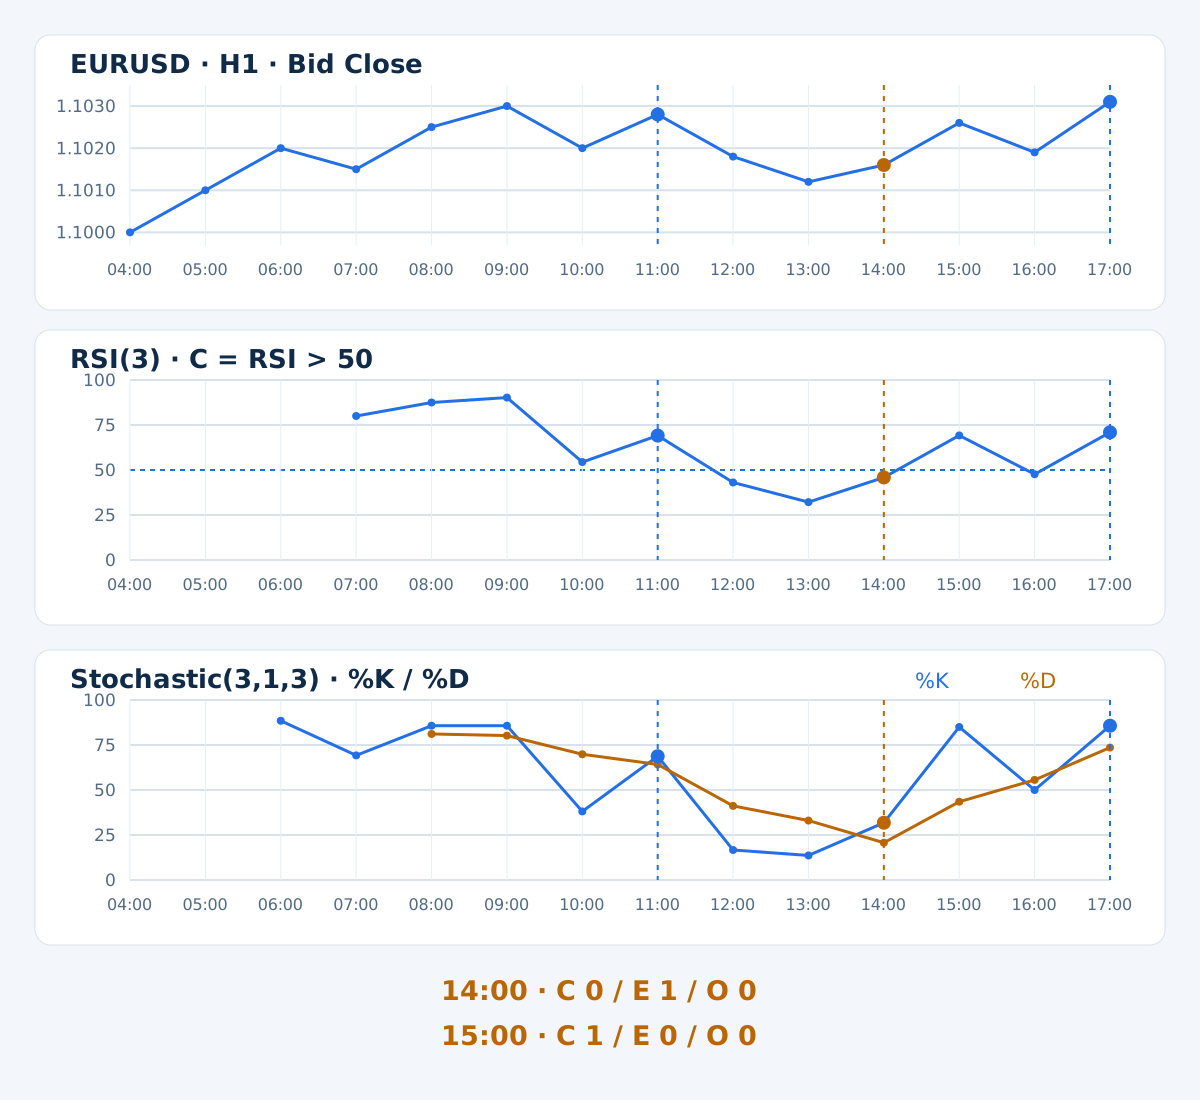
All rows below have the required inputs. Indicator readings are displayed to 6 decimals; comparisons use unrounded values. The flags follow the same-bar definition above. Repeated processing of a row must not create a new observation identifier.
| Close time | RSI(3) | %K | %D | C | E | O |
|---|---|---|---|---|---|---|
09:00 | 90.243902 | 85.714286 | 80.219780 | 1 | 0 | 0 |
10:00 | 54.411765 | 38.095238 | 69.841270 | 1 | 0 | 0 |
11:00 | 69.123506 | 68.750000 | 64.186508 | 1 | 1 | 1 |
12:00 | 43.065467 | 16.666667 | 41.170635 | 0 | 0 | 0 |
13:00 | 32.155682 | 13.636364 | 33.017677 | 0 | 0 | 0 |
14:00 | 45.868762 | 31.818182 | 20.707071 | 0 | 1 | 0 |
15:00 | 69.208122 | 85.000000 | 43.484848 | 1 | 0 | 0 |
16:00 | 47.640352 | 50.000000 | 55.606061 | 0 | 0 | 0 |
17:00 | 70.933119 | 85.714286 | 73.571429 | 1 | 1 | 1 |
At 11:00, the state and fresh crossing are both true, so O = 1. At 14:00, RSI is 45.868762: a crossing occurs, but the state fails and O = 0. At 15:00, RSI rises to 69.208122, yet Stochastic was already above its signal. There is no new crossing and O = 0; the rejected earlier event is not revived.
At 16:00, the main line is below its signal. At 17:00, a fresh crossing and the state coincide again, so O = 1. These are observation flags, not buy orders or winning trades. The example says nothing about subsequent returns, stops, costs or portfolio exposure.
7. Align the decision time across inputs
After the 10:00–11:00 bar completes and the next bar starts with ready data, MT4 shift 1 is the latest completed observation and shift 2 is its predecessor. Shift 0 is still forming. The crossing labeled 11:00 must use the completed pair, not a temporary intrabar cross.
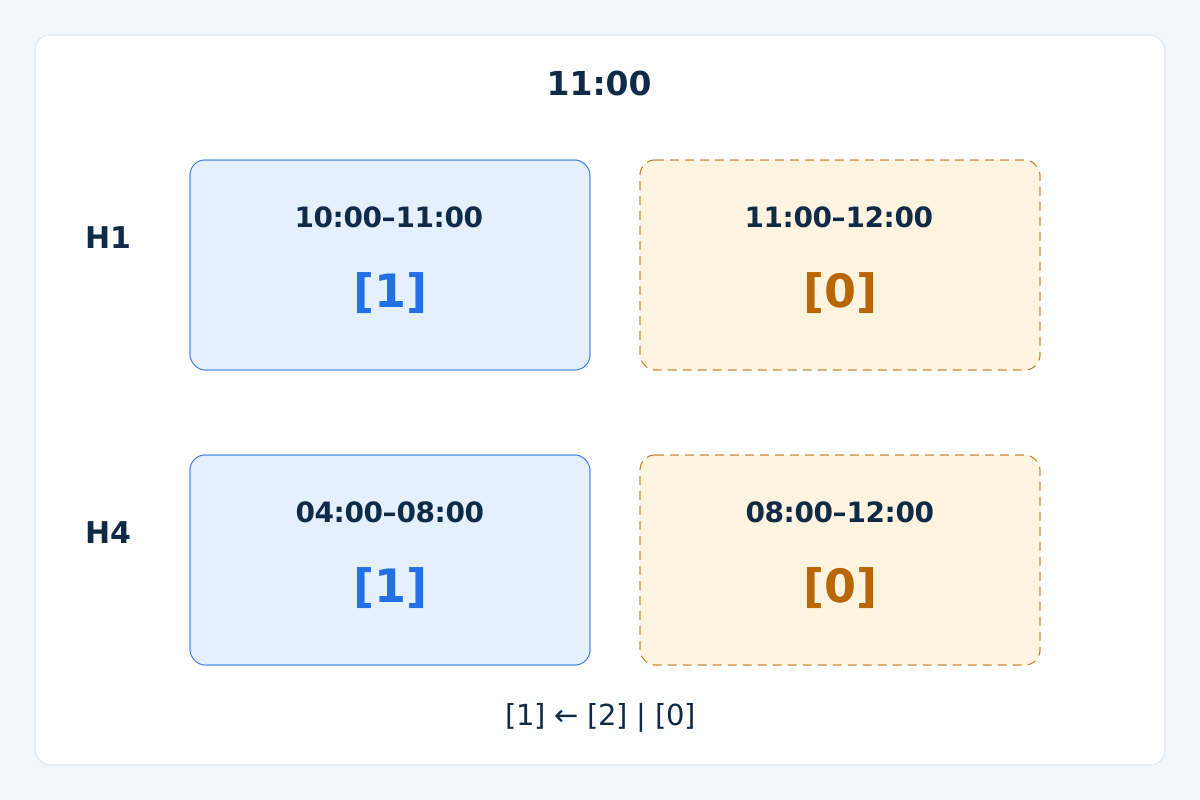
If a separate method adds H4 context, map availability explicitly. Assuming H4 boundaries at 00:00, 04:00, 08:00 and 12:00, an H1 decision after 11:00 can use the completed 04:00–08:00 H4 bar. The 08:00–12:00 H4 bar is unfinished then. Its final value becomes available only after 12:00 and data readiness. This timing illustration adds no H4 indicator values to our example.
8. Define what disagreement means
A method may reject an event, wait under an explicit expiry rule or treat signals as alternatives. Those are different specifications. Do not switch among them after seeing the outcome. In our example, all observation conditions must coincide on one bar; a later state change cannot approve an old event.
Mandatory data, execution and risk checks are vetoes, not minority votes. Agreement cannot override an invalid stop, unavailable quote or exposure limit. A confirmed divergence also has its own availability time; drawing it beside an oscillator crossing does not make both events simultaneous.
9. Test the extra component's contribution
Compare a frozen baseline with a version that adds one specified condition, using the same data and unchanged execution, exit, cost and risk rules. First compare event counts, timing and rejected cases. Fewer observations alone do not establish higher quality; a filter can merely remove opportunities or delay them.
Outcome comparisons require a complete trading method. Report net results, drawdown, exposure, sample size and uncertainty together. Keep a later evaluation period apart from development, log all tried settings and avoid repeatedly selecting on that same period. A useful-looking combination must still be observed on new incoming data. Follow the MT4 backtesting guide for the wider validation process.
10. Keep execution and EA state separate
A completed Bid-close observation does not promise execution at that close. A buy uses Ask; spread, gaps, slippage and rejected requests affect actual trading. Use position sizing and portfolio limits independently. This guide defines neither a protective-stop distance nor an order size.
For an EA, identify observations by symbol, timeframe, completed-bar opening timestamp and rule version. Process a closed-bar event once, then reconcile existing orders after restarts or connection loss before retrying anything. Preserve separate records for an analytical event, an order request and an actual fill. Indicator agreement cannot prove that an order exists.
11. Avoid common combination errors
- Counting equivalent Momentum and ROC conditions as independent votes.
- Treating a persistent above-line state as a fresh crossing on every tick.
- Replacing missing values with zero or comparing mismatched candles.
- Using the final value of a higher-timeframe bar before it closed.
- Reviving a rejected event without a predefined waiting and expiry rule.
12. A compact combination checklist
- Write down each input's distinct role and identify shared or equivalent information.
- Specify state, fresh event, readiness, disagreement handling and observation lifetime.
- Verify formulas, initialization, unrounded comparisons and completed-bar alignment.
- Test the added condition against a frozen baseline and retain all attempted variants.
- Keep execution, exits, costs and portfolio risk explicit before evaluating trading outcomes.
13. Questions about combining momentum indicators
How many momentum indicators do I need?
There is no universal count. Add an input only when its role is explicit and its contribution can be evaluated. Extra panels and agreement do not by themselves improve a method.
Do Momentum and ROC provide two confirmations?
Not under identical ratio and percentage formulas with the same prices and lookback. Their baseline-adjusted conditions are equivalent. Other definitions must be documented before comparing them.
Is being above the signal line a fresh crossing?
No. A crossing also checks the previous relationship. Once the main line is already above, remaining above is a state. Repeated ticks do not create repeated crossings.
Can a rejected crossing become valid later?
Only if the method defines a waiting window, expiry and later approval event in advance. This guide's example has no waiting window, so a rejected crossing is not carried forward.
Does adding a higher timeframe solve false signals?
It changes the context and timing but guarantees nothing. Use only the higher-timeframe observations completed at the decision, then evaluate the added rule within the full method.
Is the example a ready-to-trade strategy?
No. It is a reproducible observation workflow that separates a state, crossing and data gate. It has no trading exits, position size or demonstrated performance.
14. Check definitions before combining labels
The official MetaTrader 4 indicator reference documents the indicator definitions. The sample settings, seed, flags and event-lifetime rule here are explicitly chosen teaching conventions. For broader context roles, continue with the guide to combining trend indicators.
Forex and leveraged trading involve substantial risk. This guide is educational, not investment advice. Past or simulated results do not guarantee future performance.