

Envelopes place two bands at a chosen percentage above and below a moving average. The percentage, price distance and number of pips are three different quantities. These real USD/JPY examples show their relationship while keeping the recorded prices fixed.
1. Define the centre and both percentage bands
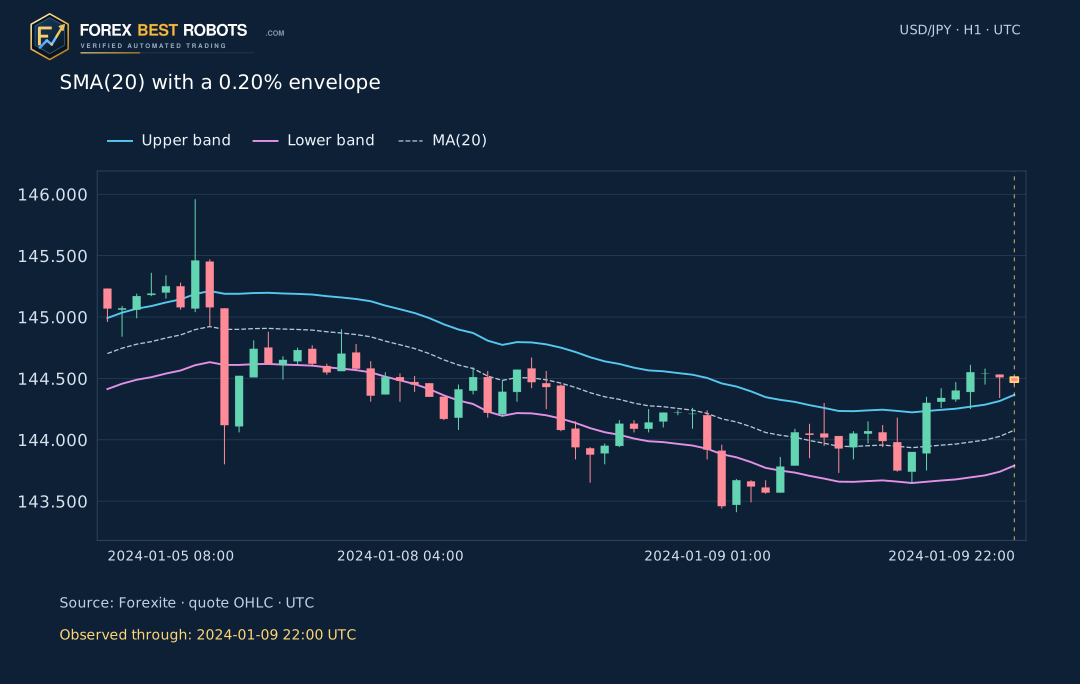
This guide uses the last 20 recorded completed H1 closes, including the selected candle, for an SMA centre. Upper and lower bands are M × (1 + p/100) and M × (1 − p/100). The declared baseline p = 0.20 is a percent, not a decimal ratio. These teaching settings are not claimed as universal MetaTrader defaults.
The bands have no horizontal displacement. A Close can lie outside an Envelopes band even when it is included in the moving average. Compare the Close with its own completed candle’s bands, rather than a boundary belonging to a different time.
M(t) = SMA20(Close)[t]
U(t) = M(t) × (1 + p/100)
L(t) = M(t) × (1 − p/100)
2. Convert a percentage into a price distance
At 2024-01-09 22:00 UTC, the SMA is 144.078000 JPY per USD. A one-sided deviation of 0.20% is 144.078000 × 0.002 = 0.288156 JPY per USD. The upper band is 144.366156 and the lower band is 143.789844. Their total separation is 0.576312 JPY per USD.
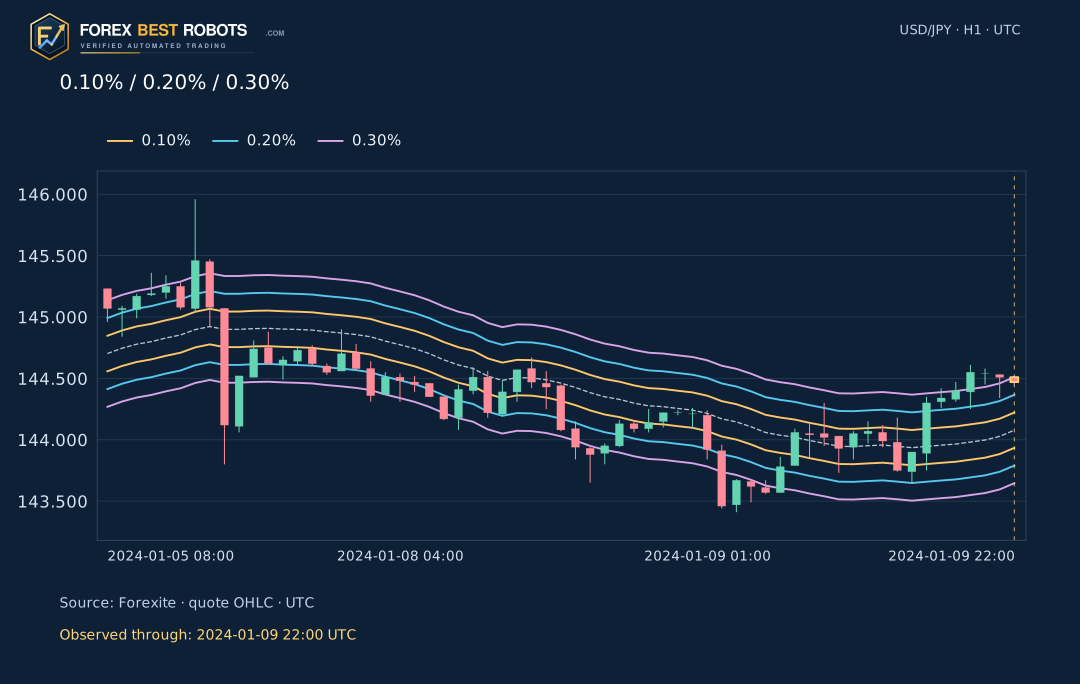
Changing p to 0.10% halves that distance; 0.30% makes it one and a half times as large. The selected Close remains 144.470000, and its time and OHLC do not change. On this observation, widening from 0.20% to 0.30% moves the Close from above the upper band to inside the channel. It does not reverse a trade or improve a historical return.
p = 0.20% → r = 0.002
D = M × r
U − L = 2 × D
3. Distinguish USD/JPY pips from percent and broker points
For USD/JPY, one pip is 0.01 JPY per USD. The baseline one-sided distance is therefore 28.8156 pips, displayed as 28.8; the total width is 57.6312 pips, displayed as 57.6. A deviation of 0.20% is not 0.20 pip, and the total width is not the one-sided distance.
A broker’s Point depends on its price specification. If its Point is 0.001, ten such points make one 0.01-JPY pip; that example does not establish the specification of your broker. The source quotes here have two decimal places. Extra zeros and calculated decimals do not create finer source-price precision.
1 USD/JPY pip = 0.01 JPY per USD
One-side pips = D / 0.01
Total width pips = 2 × D / 0.01
4. Change SMA to EMA as a separate choice
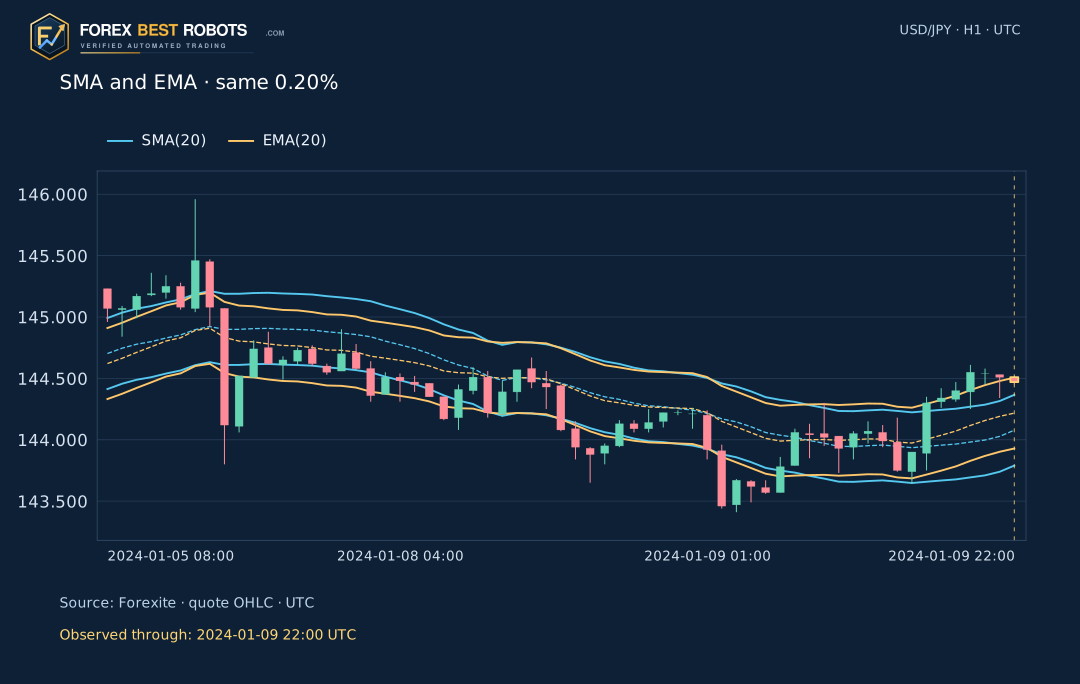
SMA(20) gives equal weight to its last 20 closes. The EMA alternative starts with their arithmetic mean at the twentieth recorded group, then uses α = 2/21. Switching the method changes the centre and therefore both percentage bands, even while p and the historical OHLC stay fixed.
An EMA retains earlier history recursively. The 20-close table below is sufficient to reconstruct the current SMA, but is not the EMA’s entire history. Neither average restarts at the first candle visible in the chart. The first 140 recorded groups are reserved for warm-up; residual EMA seed effects decay rather than becoming exactly zero.
5. Use completed groups and the correct clock
The examples use Forexite’s January 2024 minute quote archives. Source GMT+1 is converted to UTC by subtracting one hour, and minute stamps are treated as minute-end labels. Each H1 group includes recorded observations after its start through its labelled end. Final Close and band values are used only at that endpoint.
There are 529 recorded H1 groups; 4 contain 59 rather than 60 source minutes. Empty hours are omitted and missing observations are not filled with invented prices. This archive’s hours, sparse observations and quotes can differ from a broker’s chart. In MQL4, ma_shift displaces an indicator horizontally; the final shift argument selects a buffer observation. Neither is the percentage deviation.
6. Separate percentage, ATR and standard-deviation channels
At a fixed p, Envelopes width scales with the moving-average price level. It can change in JPY and pips as that level moves, while the percentage stays constant. It does not automatically widen in proportion to recent candle ranges or standard deviation.
A modern Keltner channel uses a declared multiple of ATR; Bollinger Bands use a declared multiple of standard deviation. Their width units and estimators differ. Equal-looking bands at one time do not make the indicators equivalent, and these examples do not rank their profitability.
| Channel | One-sided distance | What sets the width |
|---|---|---|
| Envelopes | M × p/100 | A percentage of the moving-average price |
| Modern Keltner | k × ATR | Smoothed True Range, including gaps |
| Bollinger Bands | k × standard deviation | Dispersion around the chosen mean |
7. Distinguish a wick, a close and a trading decision
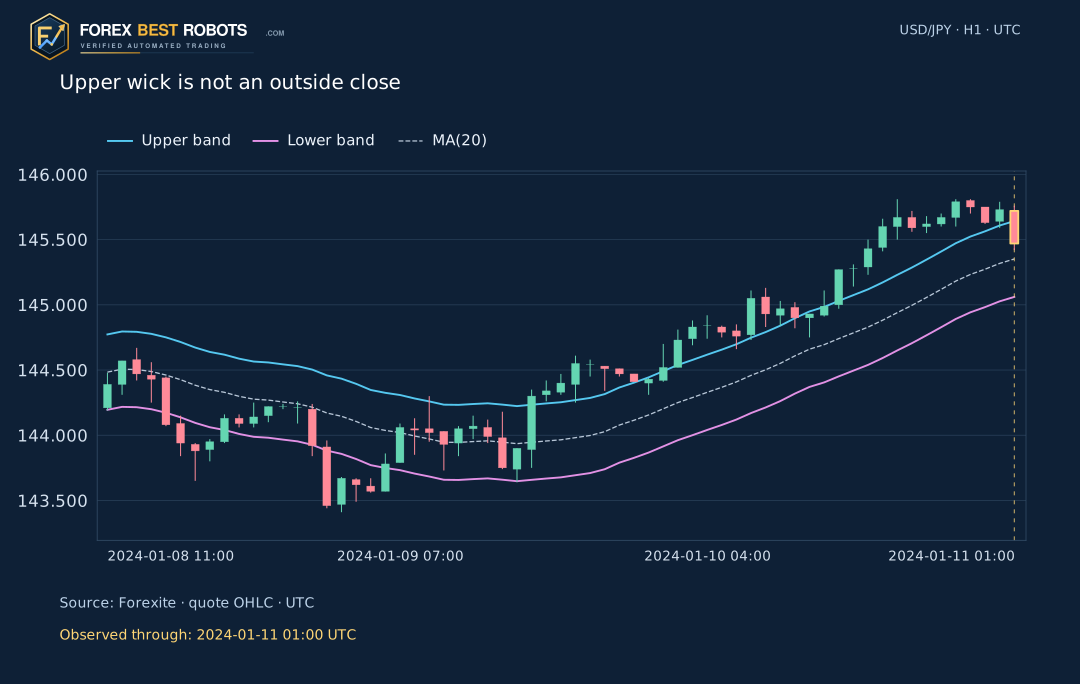
At 2024-01-11 01:00 UTC, the recorded High reaches above the upper band, but the Close is inside. That is different from a completed outside close. A wick alone does not show the exact intrahour path, order execution or whether a stop would have filled.
In a rising market, price can remain near or outside an upper envelope while the centre catches up. Selling every upper-band observation assumes a reversal that this indicator does not establish. A strategy still needs separate entry confirmation, executable quotes, protective stops, exits, exposure limits and costs.
| Example | H1 end UTC | Close | SMA(20) | One-side JPY/USD | Upper · 0.20% | Lower · 0.20% |
|---|---|---|---|---|---|---|
| Outside 0.20%, inside 0.30% | 2024-01-09 22:00 | 144.470000 | 144.078000 | 0.288156 | 144.366156 | 143.789844 |
| Lower outside close | 2024-01-11 22:00 | 145.270000 | 145.578500 | 0.291157 | 145.869657 | 145.287343 |
| Upper wick, inside close | 2024-01-11 01:00 | 145.470000 | 145.351500 | 0.290703 | 145.642203 | 145.060797 |
| Close before a return | 2024-01-09 23:00 | 144.410000 | 144.115000 | 0.288230 | 144.403230 | 143.826770 |
8. Read a return inside as a later observation
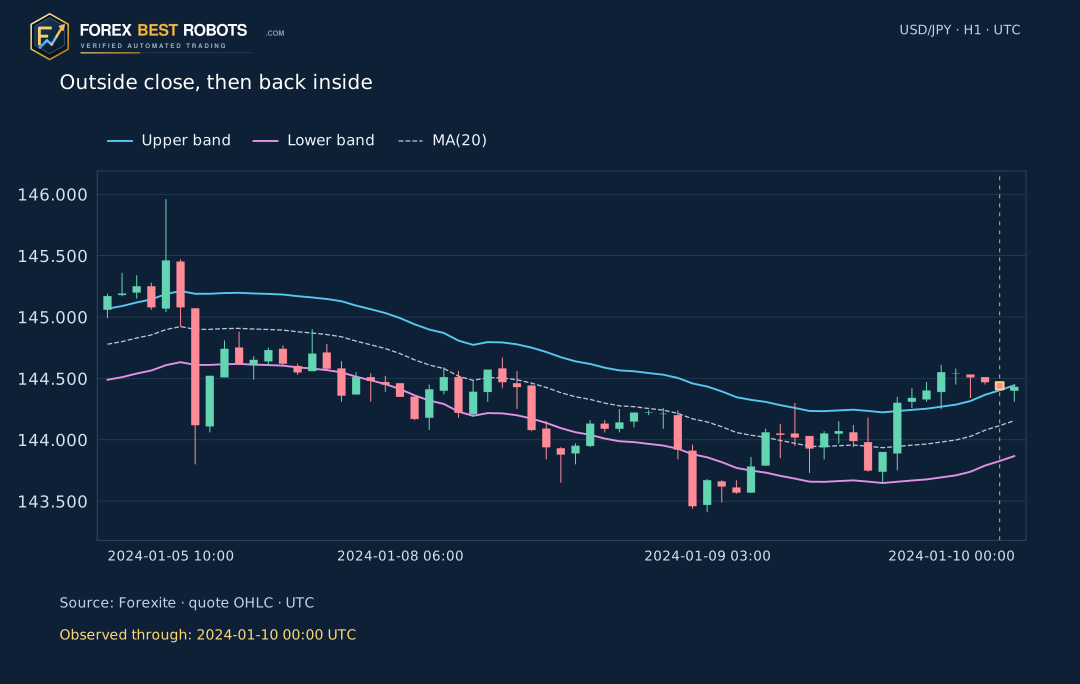
The return illustration pairs an upper outside close at 2024-01-09 23:00 UTC with the next recorded close inside its own updated channel. Both the centre and its percentage bands roll forward. The next observation is available only at 2024-01-10 00:00 UTC, not when the first close occurs.
This pair was selected retrospectively to explain a return inside. It cannot estimate a failure rate, win rate or probability of reversal. The static illustration discloses its later endpoint; the interactive explorer shows no candles after the selected completed observation.
9. Inspect the same prices under different settings
Choose 0.10%, 0.20% or 0.30%, then switch SMA/EMA separately. The selected OHLC and UTC endpoint remain fixed. The chart, centre, one-sided distance, full width and classification update together. Prices are shown to six decimals and pips to one; classification uses unrounded calculations.
The four teaching shortcuts restore SMA(20) and 0.20%. Step forward only when you want to reveal another completed group. On a narrow screen, the chart, tables and numerical calculation scroll inside their own blocks. These controls inspect an indicator; they do not place orders or simulate strategy returns.
Keep prices fixed while changing the envelope
Baseline: Close SMA(20), 0.20% on each side, no horizontal shift. The EMA alternative uses α = 2/21. Displayed values are rounded; classification uses unrounded calculations.
The interactive example could not load. Use the static charts and downloadable observations.
Teaching examples · restore SMA(20), 0.20%
Gold marks the selected completed group. Future groups are hidden. Settings change the bands while its OHLC and UTC endpoint stay fixed.
- Recorded observations through UTC
- —
- Deviation on each side
- —
- Centre · JPY per USD
- —
- One-side distance · JPY per USD
- —
- One-side distance · pips
- —
- Upper band
- —
- Lower band
- —
- Total channel width · pips
- —
- Selected quote Close
- —
- Close minus upper band · pips
- —
- What does this close show?
- —
On narrow screens, scroll the chart or formula within its block, or open a static chart at full size.
Show the numerical calculation
Show the 20 recent closes
These 20 closes fully define the selected SMA. EMA also retains earlier history through its preceding value; this table is not its entire calculation history.
| H1 end UTC | Quote Close · JPY per USD |
|---|
Frequently asked questions
Does 0.20 mean 20% in the deviation input?
The declared input is a percent: p = 0.20 means 0.20%, converted to a ratio of 0.002. Multiplying the average by 0.20 would mean 20% and produce a different channel.
Is the total width 0.20% when p is 0.20%?
Each band is 0.20% from the centre, so the full upper-to-lower separation is 0.40% of that centre.
Does a fixed percentage mean a fixed number of pips?
No. The price distance is M × p/100 and moves with the average price level. Divide it by 0.01 to obtain the one-sided USD/JPY pip distance.
Are SMA and EMA interchangeable here?
They are different centre definitions. The declared SMA uses 20 equally weighted closes; EMA uses an explicit initial mean and α = 2/21. Switching changes the bands.
Do the bands include the selected candle?
Yes, its completed Close contributes to the selected SMA or EMA. There is no horizontal shift. Final values are used only at the labelled H1 endpoint.
Does an upper outside close justify selling?
It describes price relative to a band. Trends can persist outside an envelope; a trading rule needs separate confirmation, risk controls, exits and realistic costs. This guide reconstructs no trades.
Data, calculation method and scope
The 31 original daily Forexite archives were checked against retained SHA-256 hashes before extracting USD/JPY. The original two-decimal quote prices are preserved. The downloadable method specifies UTC endpoints, sparse groups, SMA/EMA seeds, warm-up and full-precision classification. These are provider quote OHLC records, without identified Bid/Ask, observed spreads or broker fills.
Examples follow declared rules after 140 warm-up groups: the first close above the 0.20% upper band but inside 0.30%; the first lower outside close; and the first upper wick with an inside close. The return pair additionally requires a later inside close, so it is explicitly retrospective. The download includes the exact selected indices and a standalone replay script.