

A Keltner channel puts a volatility-scaled envelope around a moving average. To read it correctly, separate the centre line, the range estimate and the width multiplier. The real GBP/USD examples below keep the quotes fixed while you inspect what each calculation changes.
1. Define the modern EMA–ATR channel
This guide uses EMA(20) of Close, Wilder ATR(14) and k = 2, with no displacement. These are declared teaching settings, not a universal platform default. Modern Keltner implementations can use different ATR periods and smoothing methods; the original Keltner construction also differs.
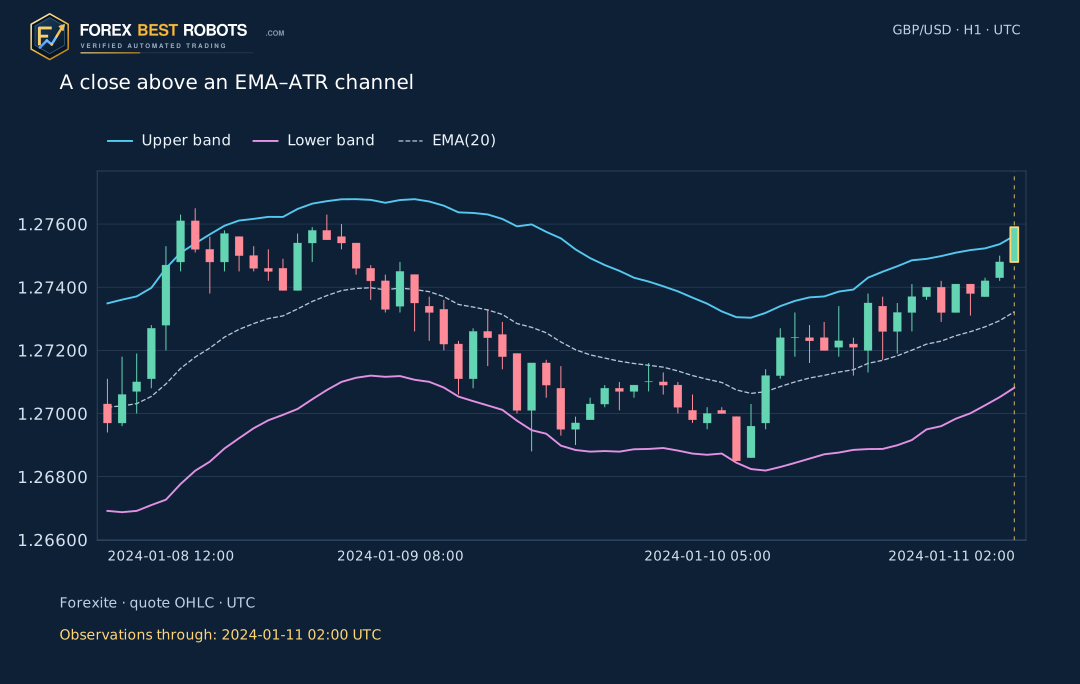
Both EMA and ATR include the selected completed H1 group. Unlike a Donchian boundary built from price extremes, a Keltner band can still have a Close outside it when that candle is included. Compare prices and bands at the same completed observation time.
M(t) = EMA20(Close)[t]
U(t) = M(t) + k × ATR14(t)
L(t) = M(t) − k × ATR14(t)
U(t) − L(t) = 2 × k × ATR14(t)
2. Use True Range, including the previous close
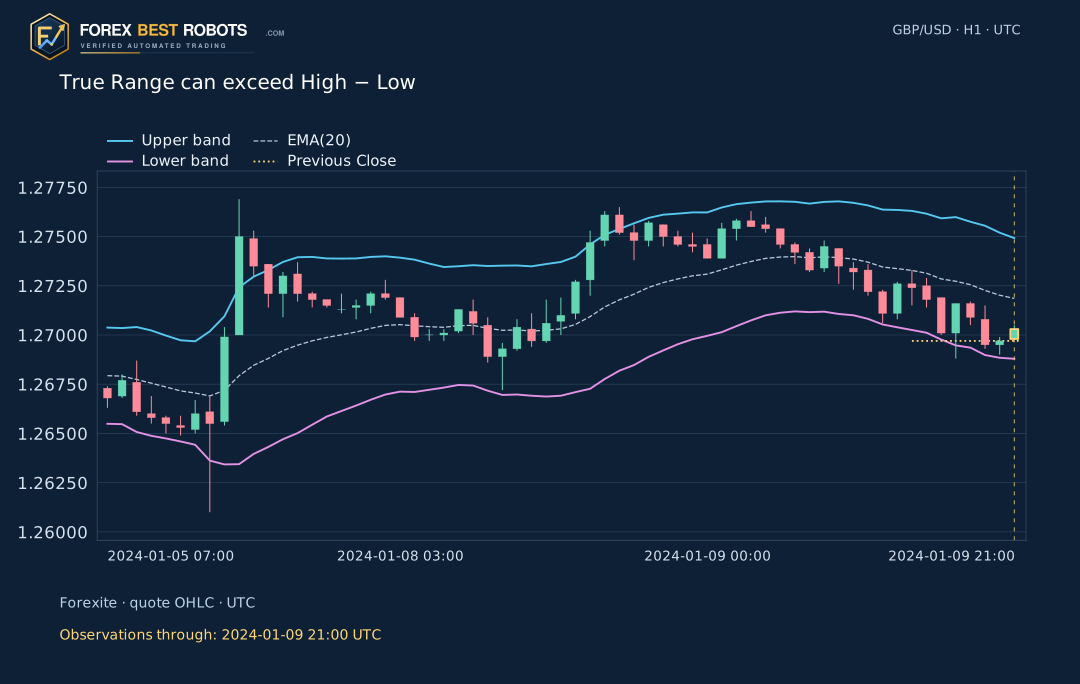
True Range is the largest of High − Low, |High − previous Close| and |Low − previous Close|. A gap from the preceding recorded close can therefore make TR larger than the selected candle’s visible range. ATR smooths these non-negative distances; it does not measure buying or selling direction.
The gap example shows actual recorded prices. Missing observations are not inserted to draw a smooth path between them. The previous close is a reference quote, not evidence that a transaction was possible at that price during the gap.
TR(t) = max(H(t) − L(t), |H(t) − C(t−1)|, |L(t) − C(t−1)|)
3. Distinguish Wilder, EMA and SMA smoothing
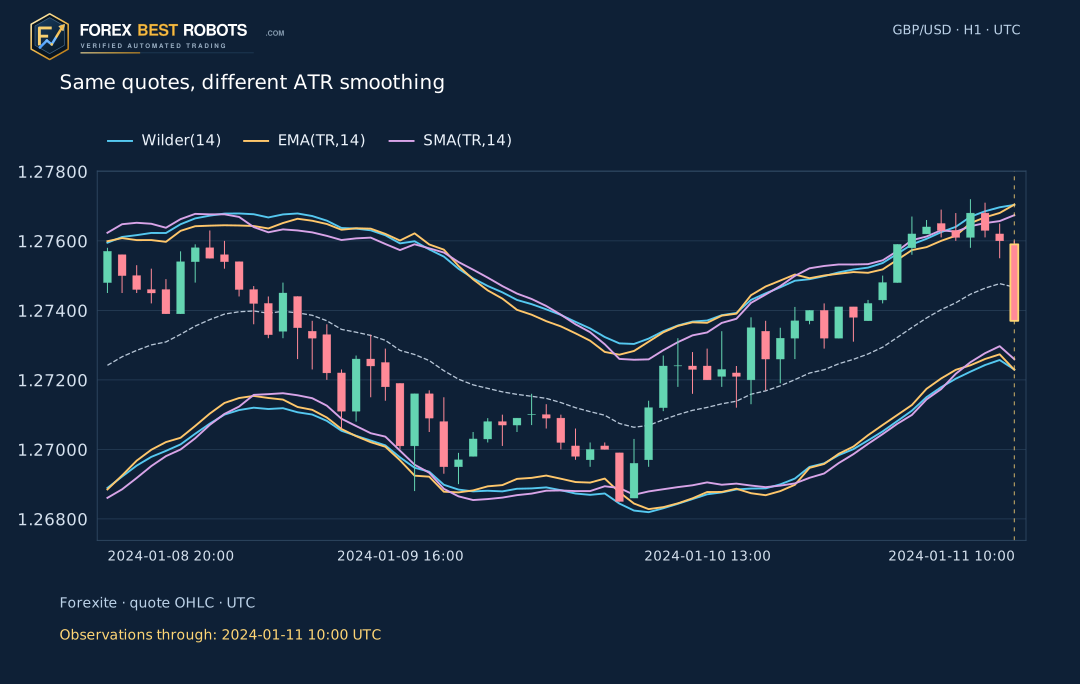
For 14 periods, Wilder uses α = 1/14 and the EMA alternative uses α = 2/15. SMA uses the last 14 TR values with equal weights. The three methods share the same first 14-TR arithmetic seed here. Their later values can differ even with identical quotes, period and multiplier.
The centre EMA(20) is unchanged when you switch ATR smoothing. Wilder and EMA retain earlier history recursively; the table of 14 recent TR observations is not their entire history. A shorter displayed chart does not restart the calculation.
Wilder ATR14(t) = [13 × ATR14(t−1) + TR(t)] / 14
EMA(TR,14): α = 2/15
SMA(TR,14): sum(TR[t−13] … TR[t]) / 14
4. Change the multiplier without changing the market
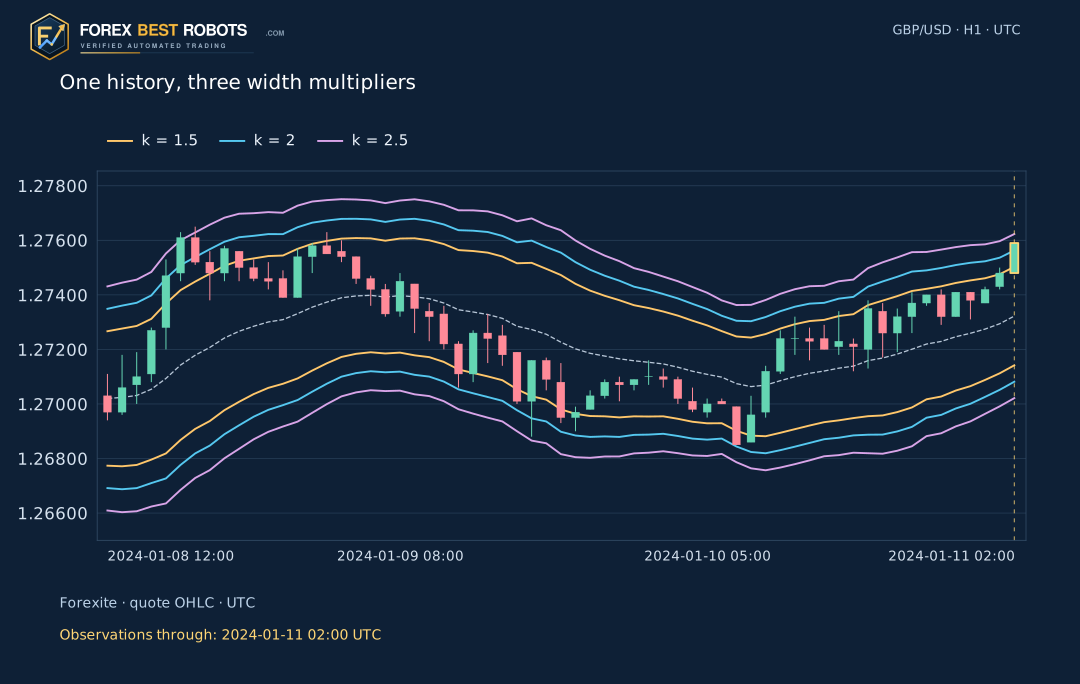
At a fixed candle and smoothing method, k = 1.5, 2 and 2.5 share the same centre and ATR. Their total widths are respectively 3, 4 and 5 ATR. Changing k alters which closes lie outside the bands; it does not alter any historical OHLC price or tell you which setting would make better trades. For GBP/USD, one pip is 0.0001 USD per GBP.
5. Read the UTC endpoint and the warm-up
The source is Forexite’s January 2024 minute quote archive. Its GMT+1 stamps are converted to UTC by subtracting one hour and treated as minute-end labels. Each H1 group contains recorded stamps after its start through its labelled end. The selected group’s final values are used only at that endpoint; later groups stay hidden.
There are 529 recorded H1 groups; 4 contain fewer than 60 source minutes. Empty hours are omitted, not filled. EMA starts with the mean of the first 20 closes; the first TR is High − Low and ATR starts with the mean of 14 TR values. The first 140 groups are reserved for warm-up. Seed effects decay rather than becoming exactly zero.
6. Read an outside close in its market context
A rising centre with repeated upper-band closes can accompany a strong advance. Selling solely because price is above an upper band assumes a reversal that the indicator has not established. Equally, a single outside close does not establish a lasting trend. EMA lags the quotes it averages.
Width describes recent range in either direction. A wide channel can accompany rising or falling prices, while a narrow one does not promise the next breakout. This guide does not label a sample as profitable, estimate a win rate or optimise settings using later outcomes.
| Example | H1 end UTC | Close | EMA(20) | Wilder ATR(14) | Upper · k = 2 | Lower · k = 2 |
|---|---|---|---|---|---|---|
| Upper outside close | 2024-01-11 02:00 | 1.275900 | 1.273222 | 0.001203 | 1.275629 | 1.270816 |
| Range expansion | 2024-01-11 10:00 | 1.273700 | 1.274668 | 0.001184 | 1.277036 | 1.272299 |
| TR and the previous close | 2024-01-09 21:00 | 1.270300 | 1.271857 | 0.001532 | 1.274921 | 1.268792 |
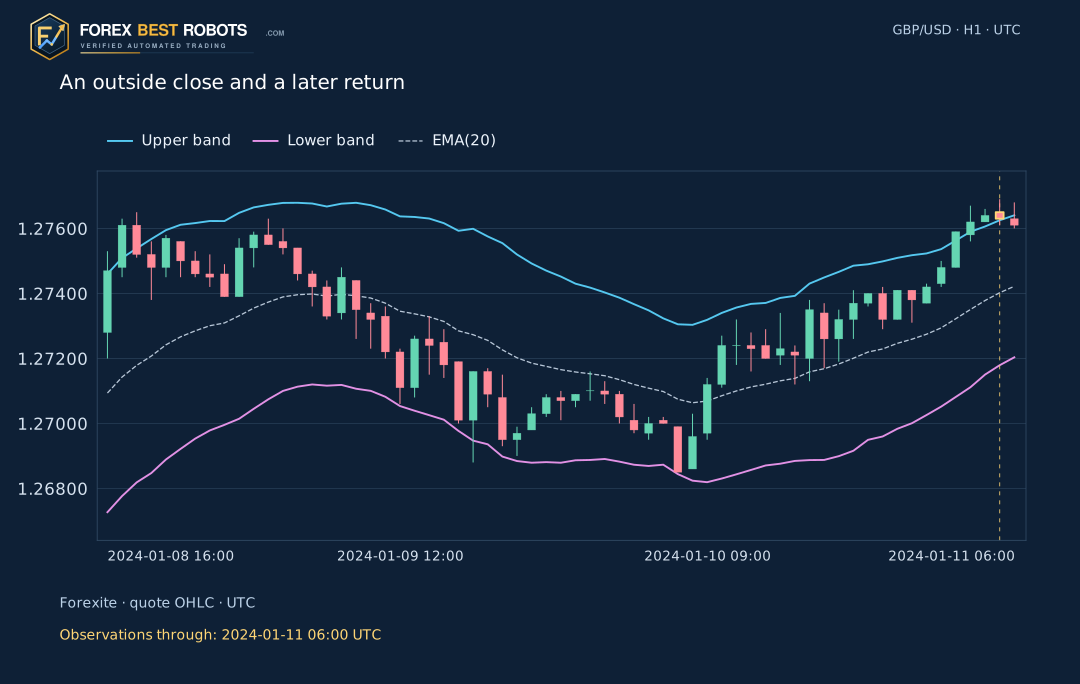
| Close before a return | 2024-01-11 05:00 | 1.276300 | 1.274021 | 0.001115 | 1.276251 | 1.271792 |
7. See how an outside close can return inside
The return example shows an upper outside close and the next recorded close inside its own updated channel. Both the centre and ATR roll forward; these are not frozen Donchian boundaries. The second observation becomes available only at the next endpoint. This pair was selected retrospectively to explain the mechanism, so it cannot estimate the probability of failure or continuation.
8. Inspect one completed observation at a time
Select k or the ATR method, then step through recorded H1 groups. The selected candle and its OHLC stay fixed when a setting changes. Prices, centre, ATR, width and classification update together. The four teaching shortcuts restore Wilder(14), k = 2. On a narrow screen, the chart and numerical formula scroll inside their own blocks.
Keep prices fixed while changing the envelope
These controls inspect an indicator, not orders or strategy returns. The baseline is Close EMA(20), Wilder ATR(14), k = 2. Displayed values are rounded; classification uses unrounded results.
The explorer could not load. Use the static charts and CSV below.
Teaching examples · restore Wilder(14), k = 2
Gold marks the selected completed group. Future groups are hidden. A setting change keeps its OHLC and UTC endpoint fixed.
- Recorded observations through UTC
- —
- Centre · EMA(20)
- —
- ATR(14) · price units
- —
- Selected True Range · price units
- —
- Upper band
- —
- Lower band
- —
- Total channel width · pips
- —
- Selected quote Close
- —
- Close minus upper band · pips
- —
- What does this close show?
- —
On narrow screens, scroll the chart or formula within its block, or open a static chart at full size.
Show the numerical calculation
Show 14 recent TR observations
This table shows the latest 14 TR values. Recursive Wilder and EMA smoothing also retain earlier history; only SMA uses just these 14 observations.
| H1 end UTC | High | Low | Previous Close | True Range |
|---|
9. Turn an indicator condition into a separately defined strategy
A strategy must separately define direction, confirmation, executable quote, stop, exit, expiry, exposure and costs. A breakout continuation and a return-to-channel model are different hypotheses. The existing Keltner re-entry strategy remains a separate lesson. These provider quote OHLC records do not supply Ask, observed spreads, slippage or broker fills; no trades or returns are reconstructed here.
Frequently asked questions
Are 20/14/2 the only Keltner settings?
No. This guide explicitly chooses EMA(20), ATR(14), Wilder smoothing and k = 2. Other implementations may use a different ATR period, seed, smoother, price or displacement.
Does this channel include the selected candle?
Yes, after that H1 group is complete. Its Close updates EMA and its TR updates ATR. A Close can still be outside the resulting band; ATR is a range estimate, not the highest High or lowest Low.
Are Wilder ATR and an EMA of TR the same?
With period 14, Wilder uses alpha 1/14, while EMA uses 2/15 here. Both start from the same arithmetic seed in this example, then apply different recursive weights.
Is the whole channel two ATR wide when k is 2?
No. Each band is two ATR from the centre, so the full upper-to-lower distance is four ATR. The panel reports that total width in pips.
Why can my broker chart differ?
Quote feed, price side, minute timestamp convention, server timezone, missing observations, EMA/ATR seeds and smoothing can all change the result. The calculation method and original source hashes are provided.
Does an outside close prove a profitable setup?
No. It describes a completed price position relative to an indicator. A separately fixed strategy, costs, execution assumptions and further data are required to study trading outcomes.
Data, calculation method and scope
The 31 original daily Forexite archives were checked against retained SHA-256 hashes. GBP/USD is preserved at the provider’s original four-decimal quote precision. Recorded minute-end observations are aggregated into H1 endpoint groups; sparse groups remain visible and unobserved hours are not synthesised.
Examples are selected by declared rules after 140 warm-up groups: the first upper outside close; the first TR at least twice the previous Wilder ATR; and the first TR larger than High − Low. The return illustration uses the first upper outside close followed by an inside close and therefore uses later information for explanation only. The download records exact indices, seeds, timestamps and source hashes.
- Download H1 observations and Keltner values (CSV)
- Download the observations and calculation method (ZIP)