

The Money Flow Index combines a candle's typical price with a weight, then compares the sums assigned to rising and falling typical prices. In spot Forex, the available weight often describes quote activity. This guide makes that distinction visible, reconstructs MFI from real EUR/USD records and lets you inspect the bars behind a reading. A return through 20 or 80 is treated as a precisely timed observation that a later strategy can test.
1. What the Money Flow Index measures in this Forex example
MFI is an oscillator between 0 and 100 that compares price–weight contributions classified by the direction of typical price. This guide weights each candle with a declared quote count. The result describes the selected EUR/USD feed and bar construction; the file contains no executed transaction sizes from which market-wide cash inflows or outflows could be measured.
MFI, the tick-volume count and VWAP answer different questions. The count measures recorded activity; the VWAP proxy averages representative prices from an anchor; MFI compares two rolling classified sums. Keeping those definitions separate makes the three guides in this cluster useful together.
2. Use the same real EUR/USD quotes and UTC clock
The source is HistData's January 2024 Generic ASCII tick archive, identified by SHA-256 in the downloads. It contains 2 176 113 original Bid/Ask records. The study slice is 2024-01-08 00:00–17:00 UTC: 71 261 records, including 70 929 records whose Bid or Ask changed. Source timestamps use fixed EST, UTC−05:00; we add five hours without a daylight-saving adjustment.
The source Volume field is zero. N counts all records; Q counts records with a Bid or Ask change against the preceding archive record, continuing across candle boundaries. These reconstructed counts are declared weights, rather than an assumed copy of a broker's native MT4 volume. The viewer selects 07:00–17:00 UTC and retains earlier observations for its rolling windows.
3. Compare typical prices before looking at candle colour
Typical price TP is (High + Low + Close)/3, using Bid OHLC here. Compare TP with the immediately preceding candle's TP on the same timeframe. A rise classifies the current candle as positive, a fall as negative and equality as neutral. The comparison uses full precision; comparing displayed prices rounded to a few decimals can create false ties.
A candle can close below its own Open while its typical price exceeds the previous candle's typical price. Its body colour therefore need not match its MFI classification. Likewise, the size of the typical-price change determines the sign only; the raw contribution uses the current typical price multiplied by its weight, not the price change multiplied by that weight.
4. Build the two classified sums and handle zero cases explicitly
For each of the last L candles, multiply TP by the chosen N or Q count. Add that amount to F+ when TP rises, to F− when it falls, and to neither when TP is unchanged. Negative flow is stored as a positive magnitude in F−. Then calculate MFI = 100×F+/(F+ + F−). For a nonzero total this is equivalent to the conventional money-ratio formula.
Positive flow alone gives 100; negative flow alone gives 0. If both sums are zero, this guide reports an unavailable value because the ratio has no denominator. It does not insert an arbitrary midpoint. A zero-weight candle contributes zero. With quote-count weights, TP×count is a calculation unit, not a measured amount of money invested.
TP = (H + L + C) / 3
F+ = Σ(TP × W | TP[t] > TP[t−1])
F− = Σ(TP × W | TP[t] < TP[t−1])
MFI = 100 × F+ / (F+ + F−)
L ∈ {7, 14, 28}; W ∈ {N, Q}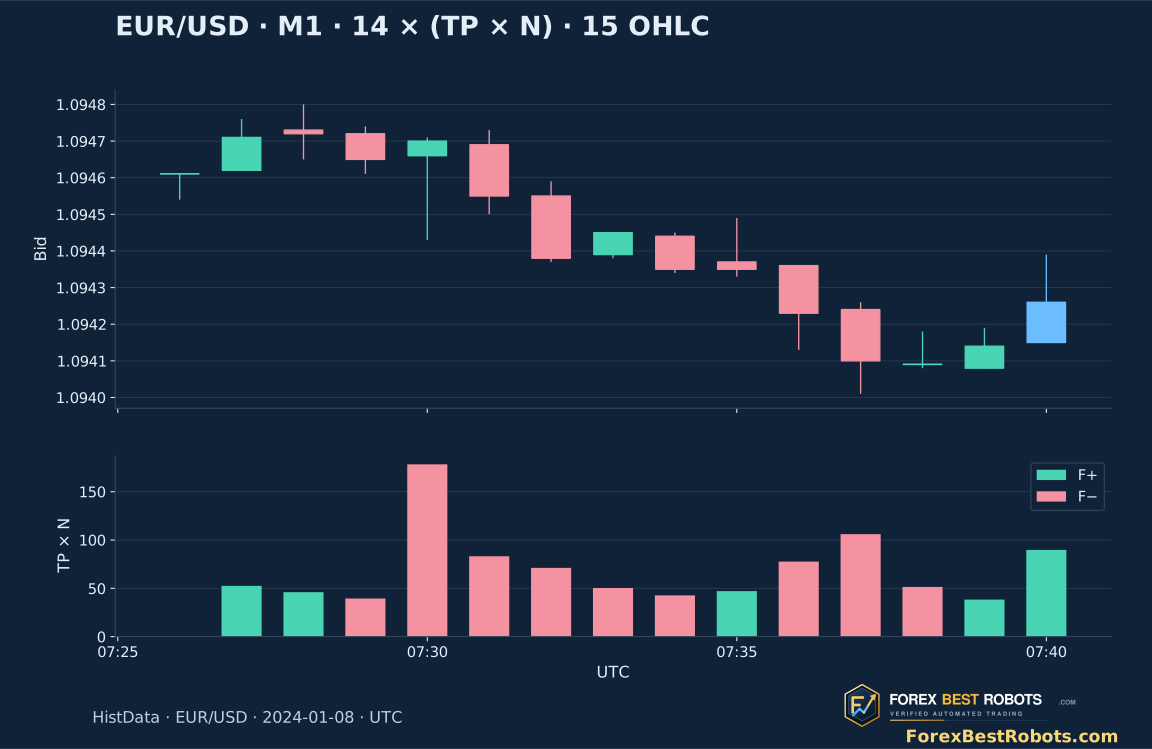
5. Keep L flows, L+1 candles and gaps consistent
Fourteen flows require 15 complete chronological candles because the first flow needs a preceding typical price. Two adjacent MFI readings for a crossing need 16 such candles. The chosen completed candle is included. The window advances one candle at a time; an old missing interval stops affecting the reading after all required bars have moved beyond it.
The study slice has 1 017 observed M1 candles and 204 M5 groups. Minutes starting 04:33, 05:29 and 06:19 UTC have no source records; three M5 groups have fewer than five observed minutes. We require every necessary interval and complete minute coverage within M5. For M5(14), the first available selectable candle starts 07:30 and finishes 07:35. Minute coverage does not guarantee that every market update was captured.
6. Read 20/80 as zones and allow persistence
The conventional reference levels are 20 and 80. Here values below the lower level are in the lower zone, values above the upper level in the upper zone, and exact boundaries belong to the middle classification. The alternative 10/90 setting changes the displayed zones and crossing labels while leaving the MFI calculation unchanged. All comparisons use unrounded values.
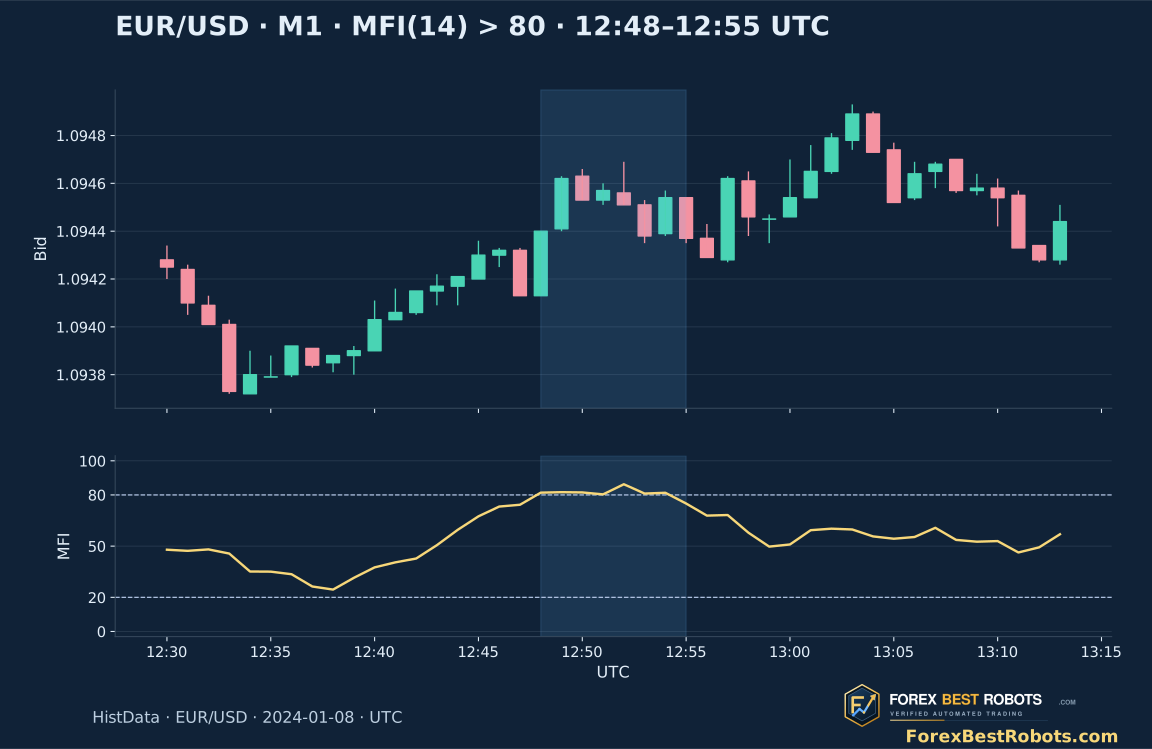
Within the fixed 600-candle M1 window, MFI(14) with N stays above 80 for seven consecutive candles starting 12:48 through 12:54 UTC, with the last closing at 12:55. This longest run was selected afterwards to illustrate persistence, without selecting on trade results. An extreme reading describes the indicator's balance and supplies no automatic deadline for a price reversal.
7. Distinguish a level visit from a confirmed return
A return above the lower level requires the previous available MFI to be at or below it and the current value strictly above it. A return below the upper level requires the previous value at or above it and the current one strictly below. Both readings must be available. A large one-bar jump can satisfy more than one event condition; the viewer lists all that apply.
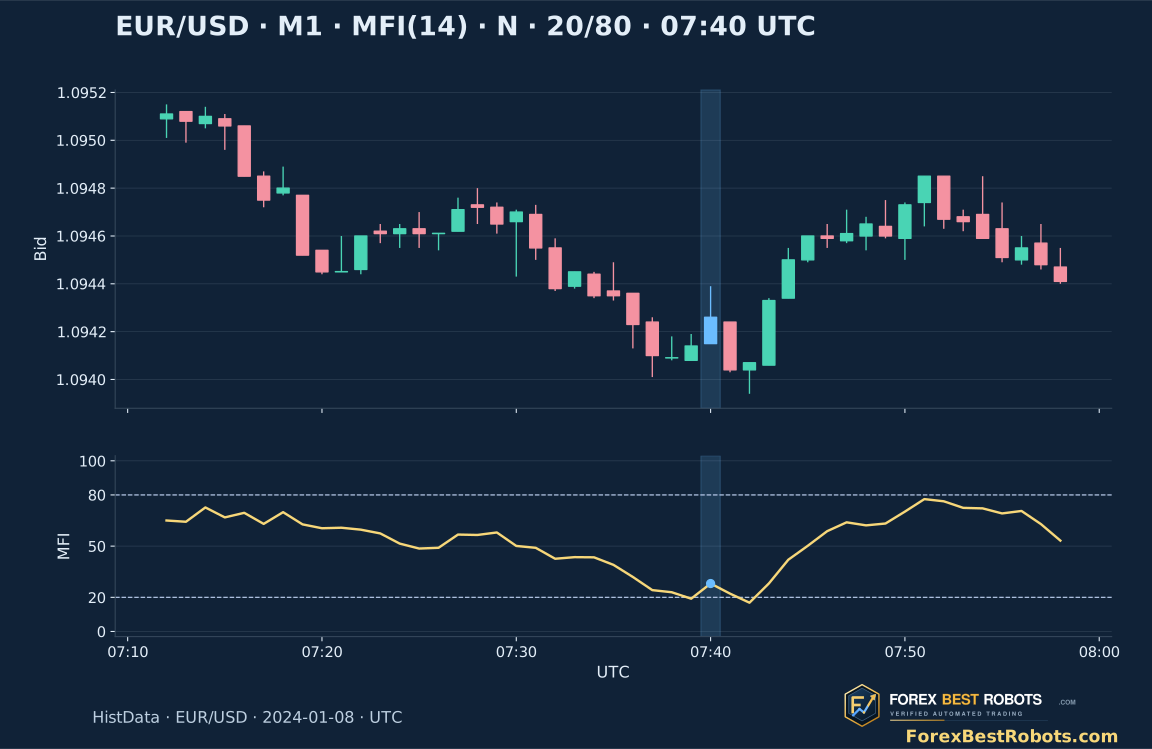
The first lower-zone return in the sample is the M1 candle starting 07:40 UTC: MFI moves from 19.2011 to 28.0901 and is known after 07:41. The first upper-zone return starts 09:53, moving from 81.6082 to 76.1594 and becoming known after 09:54. Both use L=14 and N. They are first-in-window historical examples, with no trade outcome used to choose them.
8. Change the period without calling it an optimisation
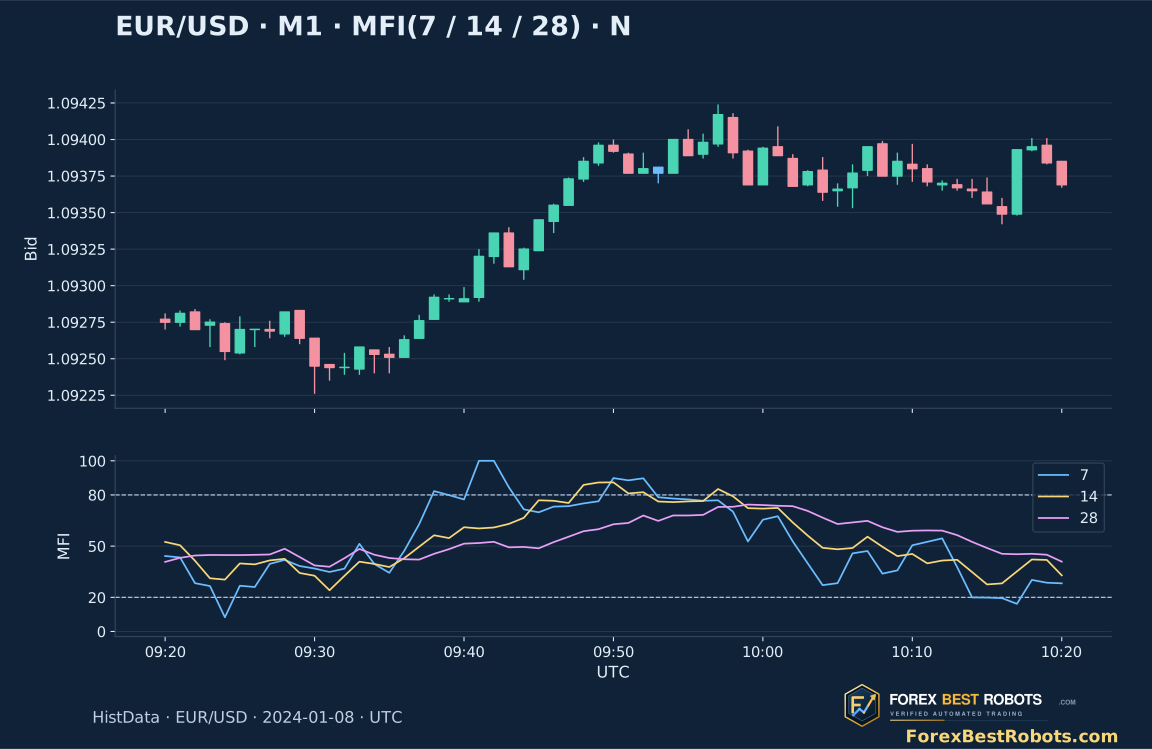
The viewer offers 7, 14 and 28 flows. A shorter window replaces its older contributions sooner and can react more sharply; a longer window retains a different mixture of earlier positive and negative contributions. The figure keeps the feed, timeframe and N weights fixed so that the effect of the period is visible.
These choices demonstrate sensitivity rather than identify a profitable setting. Evaluate the same predeclared opportunity set and costs if a later strategy compares them. MFI is a rolling sum ratio without Wilder smoothing; treating it as RSI with tick volume simply attached would reproduce a different calculation.
9. Compare N and Q using index points
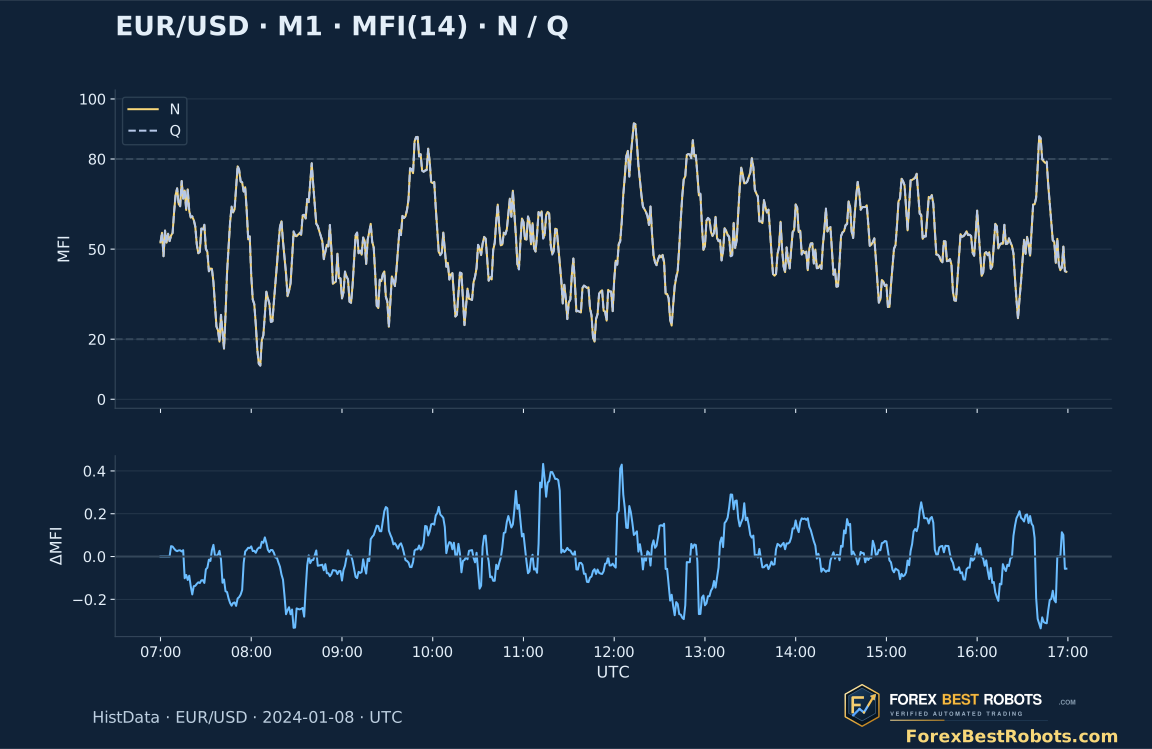
Switching N to Q keeps OHLC and typical-price direction fixed, but changes each contribution's weight. N includes unchanged Bid/Ask records, while Q excludes them according to the continuous-stream definition. Their effect depends on where those events fall within the rolling positive and negative groups, not only on the day's total count.
The difference panel uses MFI index points. It is neither a price change in pips nor a profit measure. A small numerical difference can still change a crossing very close to a threshold, so classify each version before rounding. This single day and feed do not establish which counter is more useful for trading.
10. Compare M1 and M5 at a common information cutoff
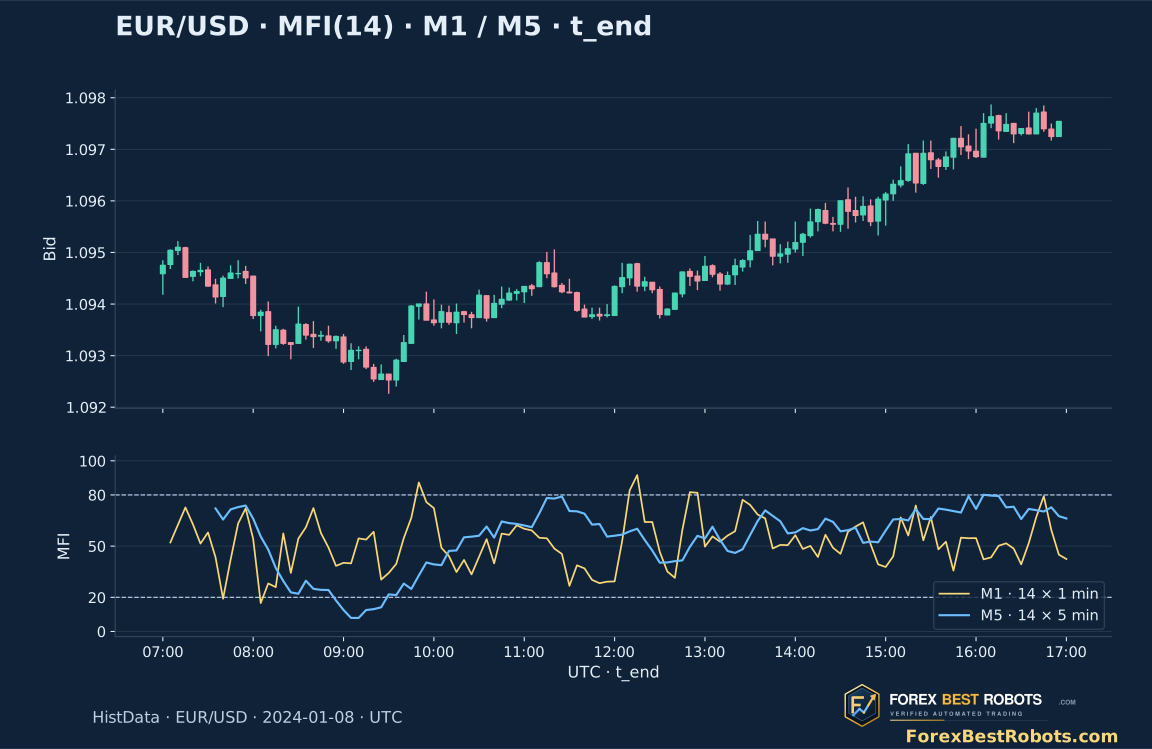
MFI(14) on M1 classifies 14 one-minute flows, while MFI(14) on M5 classifies 14 five-minute flows. Their elapsed windows and aggregated typical-price sequences differ. Additive quote counts do not make the resulting MFI values additive or interchangeable. The figure makes both the timeframe and the 14-period choice explicit.
For an M5 candle labelled 09:50, use its completed value at 09:55 and compare it with M1 through the candle labelled 09:54. Comparing the two 09:50 start labels would mix different information cutoffs. A signal identified after a close also needs a later executable quote; the historical Bid Close is not a guaranteed fill.
11. Inspect a completed MFI reading and its classified candles
Choose M1 or M5, a period, N or Q weights and reference levels. Select a candle or move one step at a time. The status line repeats the settings; the values and table show the calculation behind that closed candle.
Open a worked example · settings are applied automatically
Blue marks the selected candle; the pale price-panel region marks its L classified candles. The gold line is MFI and the dashed levels define the chosen zones. Only candles through the selected one are shown.
On a narrow screen, scroll inside the chart or table to read its full width.
Values of the selected completed reading
- UTC interval · end excluded
- —
- Bid Open / High / Low / Close
- —
- Selected typical price · TP
- —
- Selected candle weight
- —
- Positive sum · F+ · TP×count
- —
- Negative sum · F− · TP×count
- —
- Candles with rising TP
- —
- Candles with falling TP
- —
- Candles with unchanged TP
- —
- Total selected count in the L flows
- —
- Current MFI · 0–100
- —
- Previous completed MFI
- —
- Current zone · before rounding
- —
- Confirmed level events
- —
- Selected candle median spread · pips
- —
- Classified window · UTC starts
- —
Calculations and level tests use unrounded values. TP×count is a calculation unit; executed trade sizes are absent.
Show the selected formula
Inspect the L classified candles
| UTC start | Typical price | Previous typical price | TP change | Weight | Positive contribution | Negative contribution |
|---|
12. Match MT4 fields, timing and edge-case rules
In MQL4, iMFI(NULL, PERIOD_M1, 14, 1) requests the previous M1 candle's Money Flow Index for the current symbol. Shift 0 refers to the developing candle. Match symbol, source, timeframe, history coverage and weights when comparing with this reconstruction. Confirm how an implementation handles equal typical prices and a zero total of classified flows.
Money Flow Index is distinct from the Market Facilitation Index accessed through iBWMFI. The names share an abbreviation but the calculations differ. For an MFI divergence study, also define price and oscillator pivots and their confirmation delay; a pivot requiring later candles cannot be recognised on its centre candle.
13. Carry a precise observation into a separate strategy test
At 07:40 the calculation window contains 14 flows: five rising-TP candles and nine falling-TP candles, with total N weight 890. F+ is 273.6072 and F− is 700.4270 in the displayed TP×count units, giving MFI 28.0901. The predecessor is 07:26 and the classified candles run from 07:27 through 07:40. The expandable table exposes each contribution.
A strategy can now specify a return event, price context, recognition time, order type, stop and exit before examining a later period. Preserve all eligible events and include Bid/Ask, commissions, rejected orders and slippage. This final guide completes the cluster's three measurement guides; it contains no trade backtest or estimate of profitability.
Frequently asked questions
Does MFI measure money actually entering the Forex market?
With quote-count weights it measures a declared price–activity relationship in one feed. The records contain no executed trade sizes or signed transactions, so they cannot reveal market-wide cash inflows and outflows.
Why does a 14-period MFI need 15 candles?
Fourteen raw flows each need a typical-price comparison with the preceding candle. The first flow therefore needs one additional reference candle. A crossing between two adjacent MFI readings needs both readings to be available.
What happens when the typical price is unchanged?
That candle contributes to neither the positive nor the negative sum. The viewer still counts it as an unchanged-TP candle. If both sums are zero for the whole window, the reading is unavailable under this guide's declared rule.
Does MFI above 80 require an immediate sell?
It describes an upper-zone reading. MFI can stay there across several completed candles. Trading needs separate price context, recognition timing, execution and risk rules; this guide does not report trade performance.
Does changing 20/80 to 10/90 recalculate MFI?
No. The period, prices and weights determine MFI. Changing reference levels changes zone and crossing classifications only. Those comparisons use the unrounded indicator value.
Why can M1 and M5 MFI disagree?
The candle sequence, typical-price direction and elapsed window differ. Fourteen M1 flows span 14 minutes; fourteen M5 flows span 70. Compare completed values at the same information cutoff and preserve missing-history rules.
Data, timing and reproducibility
The downloads contain observed M1/M5 Bid OHLC, N/Q counts, spreads, minute coverage, source identification and a standard-library replay script. Integer prices use millionths; one EUR/USD pip equals 100 such units. Typical-price comparisons use the integer sum High+Low+Close before rounding. The source archive is identified by its download page and SHA-256; the raw monthly archive is not redistributed.
The input slice is 2024-01-08 00:00–17:00 UTC and the viewer selects 07:00–17:00. Missing minutes remain absent. The return examples are the first qualifying events in that fixed window; the above-80 run is its retrospectively selected longest run. Static figures show historical context, while the interactive chart ends at the selected candle. All charts carry the ForexBestRobots logo and domain.
- M1 OHLC, quote counts and coverage (CSV)
- M5 OHLC, quote counts and coverage (CSV)
- Input data, source details and MFI replay method (ZIP)