

A small target leaves little room for expensive execution. Before choosing a one-minute or five-minute chart, understand when a signal is known, which price can fill it and what remains after costs. This guide compares M1 and M5 through worked examples, with no assumed profitable strategy.
1. What is scalping in Forex?
Scalping is an intraday trading style that seeks relatively small price movements and usually keeps positions open for a short time. A scalper may trade a brief pullback, a range edge or a burst of momentum. The defining feature is the relationship between the intended move, the holding period and execution costs; there is no universal number of pips or seconds that makes a trade a scalp.
Scalping sits within day trading, but the terms are not interchangeable. A day trader can hold one position for several hours, while a scalper may make several separate attempts within that period. Frequency alone proves nothing: repeatedly entering a weak setup increases turnover and costs without creating an advantage. Some sessions can legitimately produce no trades.
Retail scalping on a broker platform is also different from institutional high-frequency trading. An M1 chart, a fast VPS or an Expert Advisor does not provide exchange colocation, queue priority or guaranteed fills. This guide explains how to assess the style before choosing entry rules. Its prices and calculations are fictional teaching examples, not results from a tested strategy.
2. M1 versus M5: what actually changes?
M1 condenses prices into one-minute candles; M5 uses five-minute candles. With aligned boundaries and complete data from the same feed, one M5 candle aggregates five M1 candles. M1 exposes more of the sequence between M5 boundaries. M5 compresses that sequence, so its high and low alone cannot tell you which came first or how the spread behaved between them.
A shorter chart interval does not require a shorter holding period. A position opened from an M1 signal may remain open through several M5 candles. Conversely, an M5 setup can exit within seconds if a protective order is triggered. The interval also does not prescribe stop distance, position size or the number of entries. Those are separate rules that must be written down.
M1 may provide earlier decision points and more opportunities to react to temporary noise. M5 may reduce the number of candle-close decisions, yet a wider candle can leave a less attractive entry price. Neither interval guarantees lower risk or higher net returns. Compare them using the same trading window, cost assumptions and cash-risk budget; then examine where the rules genuinely differ.
| Decision | M1 | M5 |
|---|---|---|
| Candle interval | One minute | Five minutes |
| Information retained | More detail inside each five-minute period | Five M1 candles compressed into one |
| Close-based decisions | More frequent opportunities to check a rule | Fewer scheduled candle-close decisions |
| Holding period | Separate exit rule; not fixed at one minute | Separate exit rule; not fixed at five minutes |
| Costs | Use current quotes and actual charges | Use the same accounting conventions |
| Risk comparison | Match cash budgets; disclose rule differences | No automatic reduction in execution risk |
3. The information clock: when is a signal known?
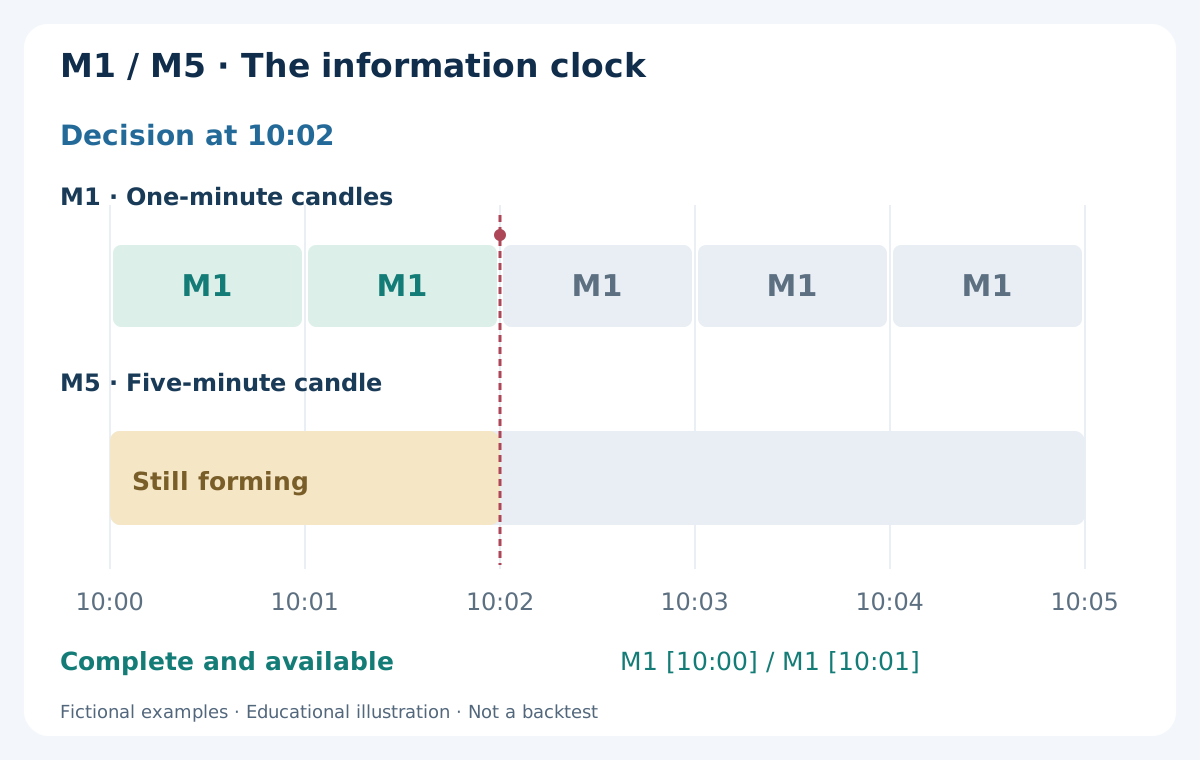
Suppose broker time labels an M5 candle 10:00. It covers the interval from 10:00 up to, but not including, 10:05; its final close is only available after that interval ends and the next tick arrives. At 10:02, the M1 candles starting at 10:00 and 10:01 can be complete, while the 10:00 M5 candle is still forming. Its final high, low and close are not yet known.
An M1 entry that uses the final close of that unfinished M5 candle contains future information. A legitimate multi-timeframe rule can use the most recently completed M5 candle instead, or explicitly use the live candle and accept that its values change. These are different methods and need separate records. A missing tick at the boundary can also delay the moment the platform recognises completion.
Write the observation time, the candle used, the order-request time and the actual fill time separately. A rule such as “enter after the M1 close” still needs a deadline: a fill several seconds later may have a different spread and price. A visually neat entry marker on historical candles cannot establish that the same entry was available live.
4. Why a small target makes costs more important
The same 1-pip cost consumes 25% of a 4-pip reference move and 5% of a 20-pip move. This arithmetic explains why small targets need careful execution analysis. It does not establish that a larger target is easier to reach or that an M5 approach has a larger edge. The probability of reaching each target, the stop distance and time spent exposed can also change.
A small candle is not evidence of low risk. An unexpected announcement, a sudden withdrawal of liquidity or a spread expansion can be large relative to the planned target. A quiet-looking Bid chart can conceal a changing Ask price. Treat the price path, the available quotes and the cost of completing a trade as related observations, not as interchangeable data.
Start with a plausible market behaviour and a defined reason to exit when it fails. Then ask whether the remaining movement can cover realistic costs. Choosing an extremely tight stop merely to display an attractive reward-to-risk ratio can place it inside normal quote variation. The stop-loss and take-profit guide explains why the invalidation point must come before position sizing.
5. Bid and Ask: the prices a scalper can trade
For a market BUY, the entry is on Ask and the closing sale is on Bid. For a market SELL, entry is on Bid and the closing purchase is on Ask. MT4 charts normally display Bid candles. A Bid candle touching a level therefore does not by itself prove that a SELL take-profit, which is checked against Ask, was executable at that level.
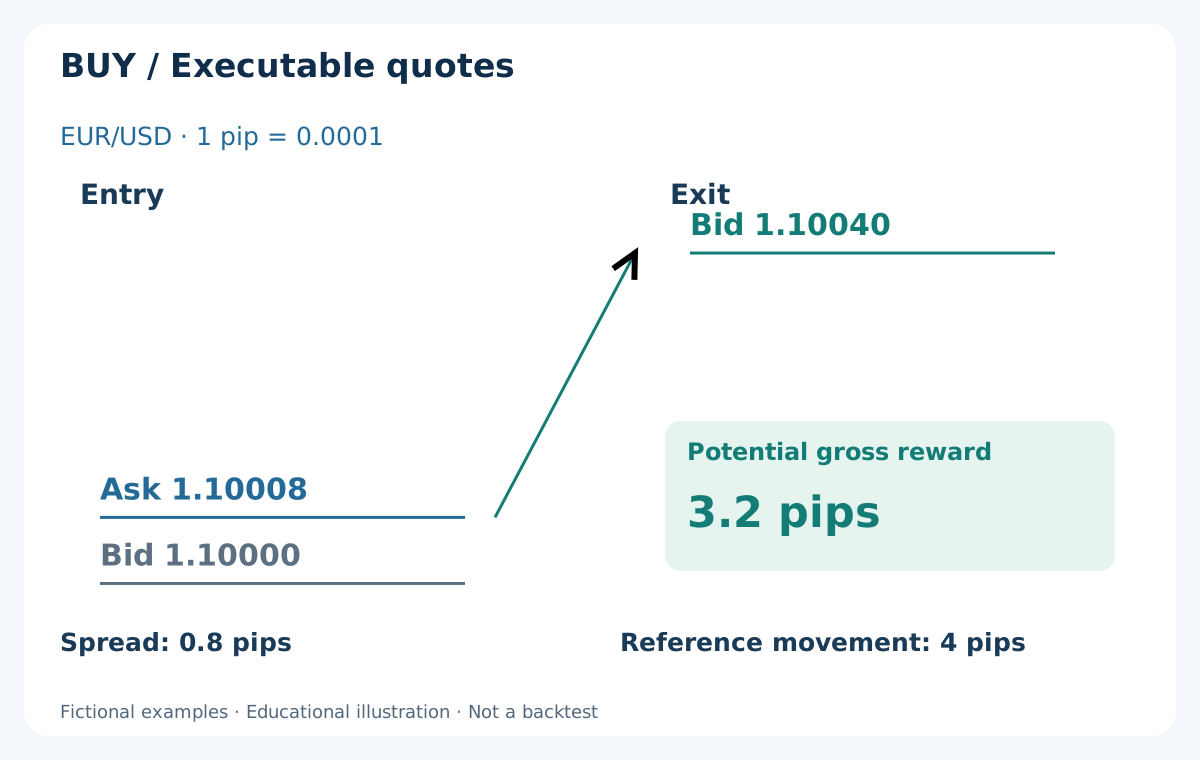
Consider EUR/USD with Bid 1.10000 and Ask 1.10008: the spread is 0.8 pip when 1 pip = 0.0001. If a BUY fills at 1.10008 and later closes at Bid 1.10040, the executable price gain is 3.2 pips. The Bid-to-Bid movement was 4 pips, but the position did not capture all of it. Commission has not yet been deducted.
On a five-decimal EUR/USD quote, 1 point = 0.00001, so that 0.8-pip spread is 8 points. A tick is a quote update or a minimum price increment, depending on context; it is not a synonym for a pip. Check the symbol specification instead of transferring decimal conventions to every instrument. See the pip, point and pip-value guide for other quote formats.
6. One cost ledger, without counting the spread twice
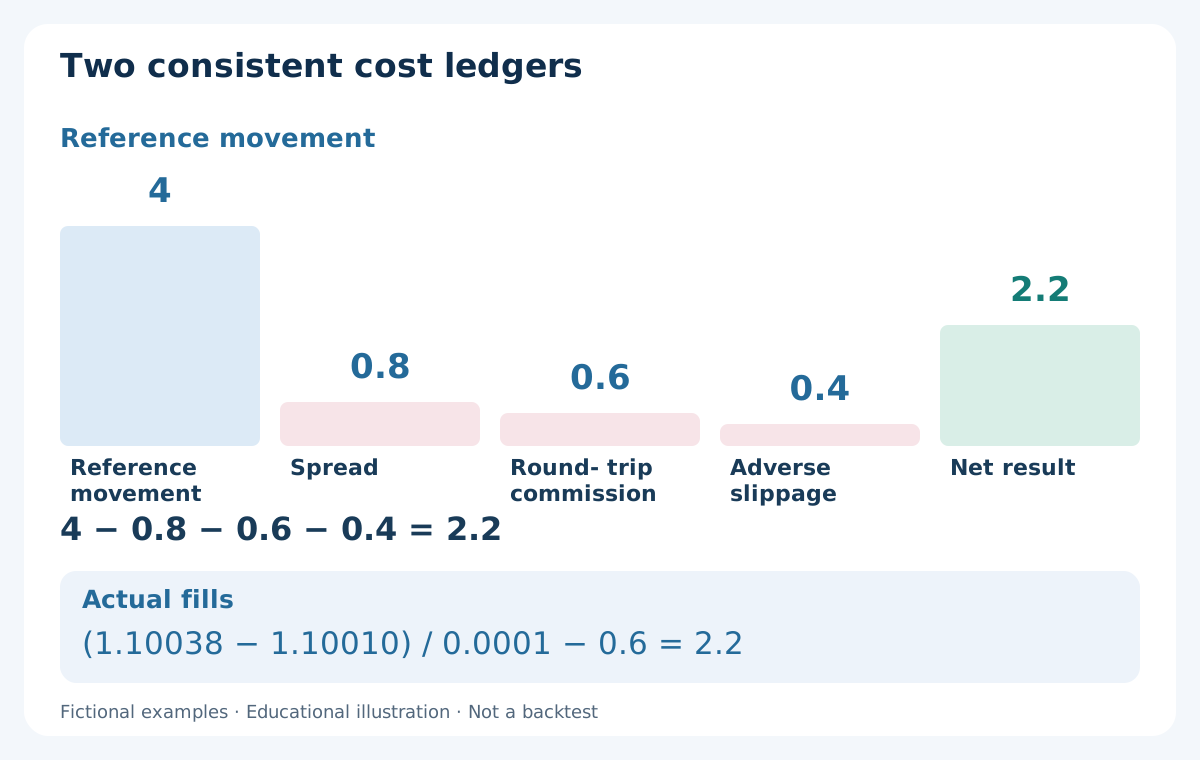
Two accounting views are useful, but they must not be mixed. Starting from a reference chart movement, subtract the spread adjustment, round-trip commission and any adverse execution difference not already included. Starting from actual entry and exit fills, calculate their price difference and subtract commission and other separately booked charges. Spread and realised slippage are already reflected in those fills.
In the same example, assume a round-trip commission equivalent to 0.6 pip and combined adverse entry-and-exit slippage of 0.4 pip. The reference calculation is 4 − 0.8 − 0.6 − 0.4 = 2.2 pips net. One matching pair of actual BUY fills is entry 1.10010 and exit 1.10038: 2.8 pips from the fills, less 0.6 pip commission, again gives 2.2 pips. Do not subtract the spread or that slippage a second time.
A round-trip charge covers both opening and closing; a per-side quote must be multiplied appropriately. Convert cash commission using the correct volume and pip value. Include financing if the trade crosses the broker’s rollover, even when the original intention was a brief scalp. The guide to spreads, commissions and swaps provides a fuller cost ledger. Favourable slippage can occur too; retain its sign in actual records.
7. Execution risk: market, limit and stop orders
A market order prioritises immediate execution subject to the broker’s execution rules; the displayed quote need not become the fill. A limit order restricts the acceptable entry price but can remain unfilled while the market moves away. A protective stop is a trigger for an exit process, not a promise of the displayed stop price. Fast conditions can produce a worse fill than the planned boundary.
Do not assess a limit-entry approach only on filled winners. Record eligible signals, requests, rejections, expired orders and fills separately. Missed trades can change the result: the subset that gets filled may behave differently from the opportunities that escape. Latency also matters in both directions, from receiving a usable quote to sending a request and receiving execution confirmation.
Before testing, inspect the account’s permitted trading methods, commission schedule, minimum volume, lot step, stop-distance restrictions and order-modification limits. There is no universal rule that every broker allows every scalping method. A low advertised spread is incomplete information. The market, limit and stop order guide explains how order choice changes execution obligations.
8. A BUY plan: gross distances and net outcomes
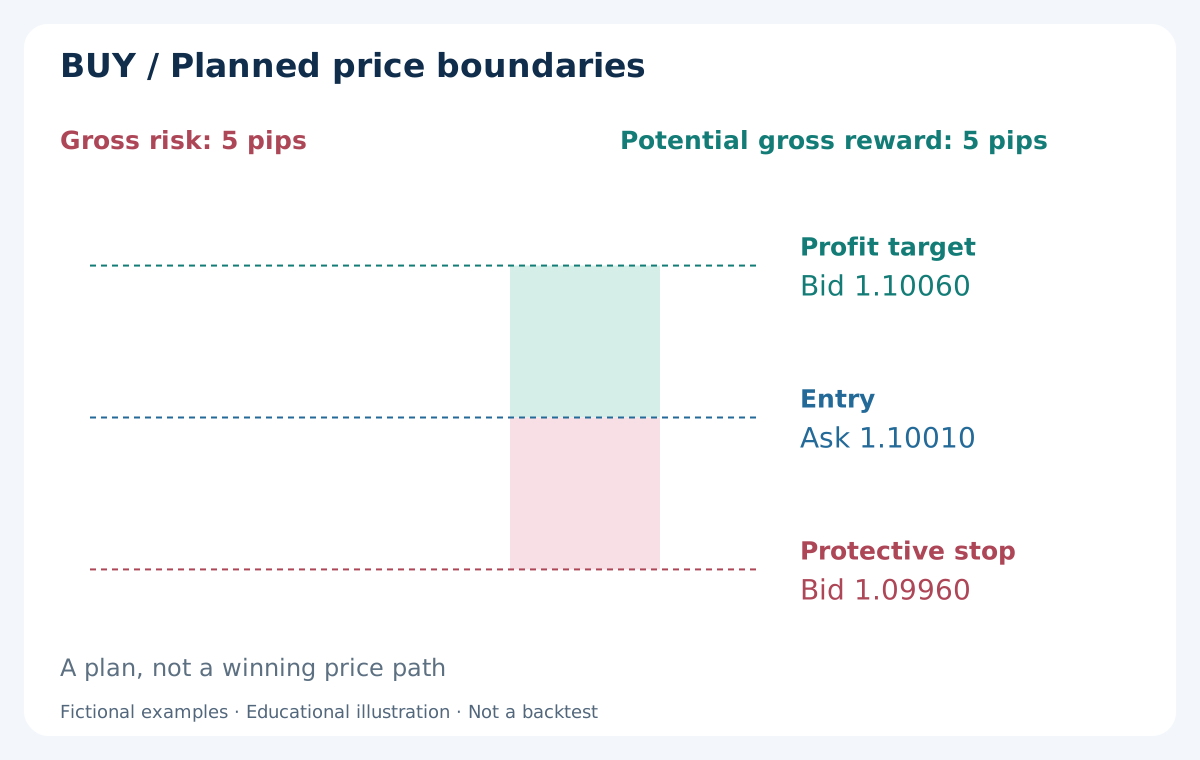
Now use a separate, fictional BUY plan with an actual Ask fill of 1.10010, a protective stop triggered at Bid 1.09960 and a profit target checked at Bid 1.10060. The entry-to-stop distance is 5 pips and the entry-to-target distance is also 5 pips. The diagram shows planned boundaries; it does not draw an invented winning route between them.
Assume 0.6 pip round-trip commission and an additional 0.4-pip allowance for adverse exit slippage. The entry is already an actual fill, so no further entry-spread deduction belongs in this calculation. A conservative target outcome is 5 − 0.6 − 0.4 = 4 pips; a conservative stop outcome is a 5 + 0.6 + 0.4 = 6-pip loss. The exit allowance is a planning assumption, not an observed fee.
The gross reward-to-risk ratio is 1:1, while the conservative net reward-to-loss ratio is 4:6, or about 0.67. The stop remains below the BUY entry and the target above it. For a SELL, the protective stop is above the entry and exits use Ask. Mirror the executable quote side as well as the drawing. Spread expansion and price gaps can exceed the loss allowed for here.
9. Win rate is incomplete without payoff size
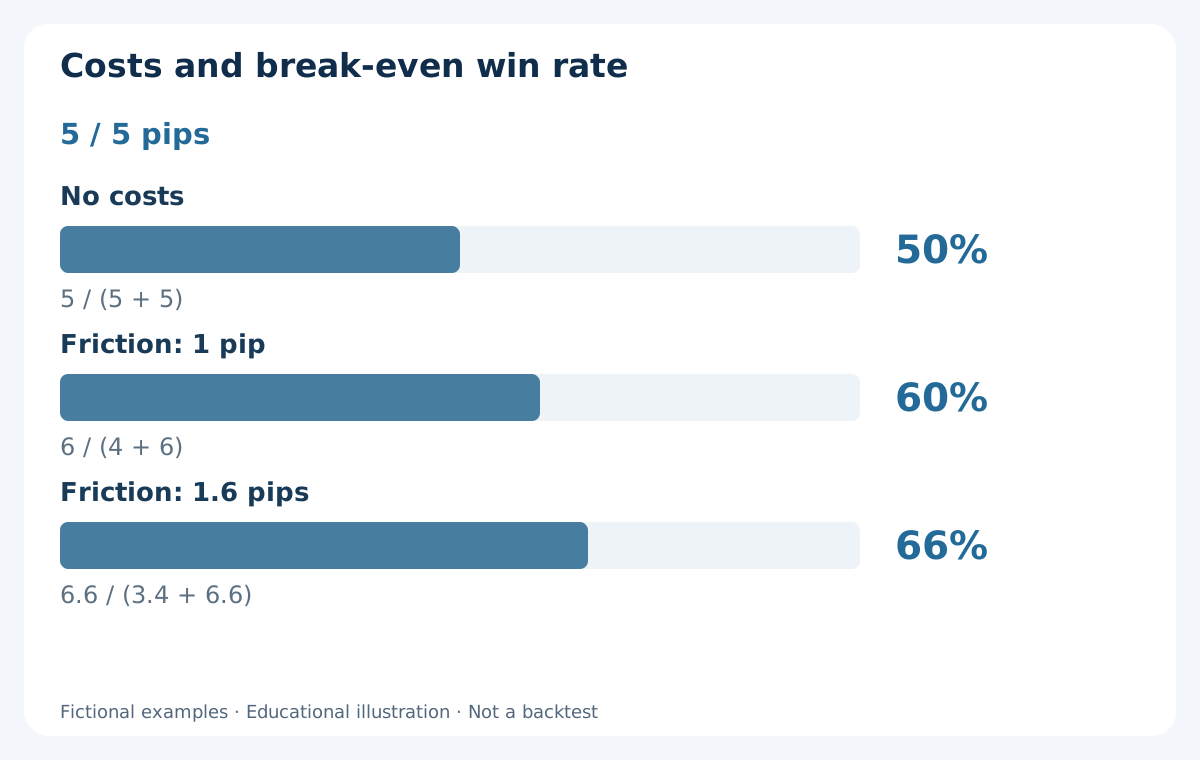
If every completed trade had exactly the illustrative 4-pip net win or 6-pip net loss above, the break-even win rate would be 6 / (4 + 6) = 60%. With no costs, symmetric 5-pip wins and losses would break even at 50%. This simplified two-outcome model illustrates a cost burden; it is not evidence that any real scalping method can achieve the required win rate.
If total friction per trade rose from 1 pip to 1.6 pips under the same gross 5/5 boundaries, the model would become a 3.4-pip win and a 6.6-pip loss. The break-even rate would rise to 66%. Actual trades can also have partial exits, time exits, variable charges and different volumes, so their cash outcomes will not fit two fixed numbers.
For real records, use net results after all charges. Estimate expectancy from the full outcome distribution, then inspect how concentrated the result is in a small number of trades, sessions or market conditions. A high win rate can coexist with a negative average result when occasional losses are much larger. A short profitable sample is also consistent with chance and does not establish persistence.
10. Position size follows cash risk, not candle size
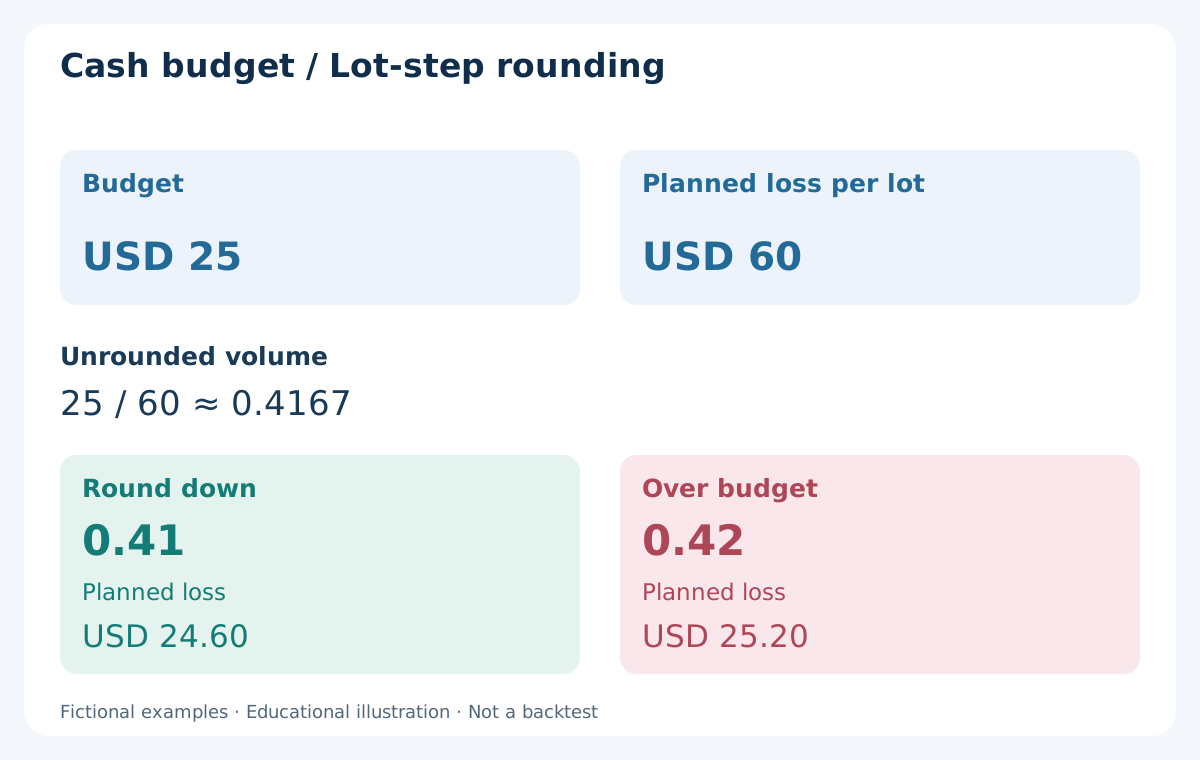
Assume a USD 5000 account, an illustrative planning budget of 0.5% or USD 25, and the BUY plan above. For this example only, one standard EUR/USD lot is EUR 100000 and each pip is USD 10 in the USD account. Five pips to the stop cost USD 50 per lot; commission adds USD 6 and the exit allowance USD 4, producing a planned USD 60 loss per lot.
The unrounded volume is 25 / 60 ≈ 0.4167 lot. If the permitted lot step is 0.01, round down to 0.41 lot: the planned loss is USD 24.60. Rounding up to 0.42 would plan USD 25.20 and exceed the budget. Do not enlarge a minimum-size trade when even the smallest permitted volume is too risky. Skip it instead.
Pip value in the account currency depends on the symbol, contract and conversion rates; USD 10 is not a universal constant. Check tick size, tick value, volume limits and available margin with the broker. A smaller stop can require a larger volume for the same budget, increasing sensitivity to execution error. The position-sizing guide covers conversion and rounding. Neither this budget nor a protective stop guarantees a maximum realised loss.
11. Repeated attempts create a separate daily risk problem
A small per-trade budget does not make unlimited attempts harmless. Re-entering the same idea can turn one failed thesis into several losses, and positions in correlated pairs can expose the account to the same currency move. Measure concurrent open risk and accumulated realised losses as well as the nominal risk of the next order. Margin capacity is not a suitable daily loss limit.
Define the trading window, maximum filled entries, maximum concurrent exposure, a daily loss rule and a time-based exit before collecting results. Specify whether a daily rule uses closed-trade losses or equity including open positions, when the day resets and what happens to existing orders. Thresholds are system assumptions to validate, not numbers to import from an unrelated profitable-looking example.
A time exit requests closure when the holding deadline arrives; it does not guarantee a fill at the candle’s close. Stop new entries after an execution anomaly or a loss limit, reconcile any open orders, and investigate before restarting. Record skipped opportunities too. Otherwise a discretionary pause after losses can disappear from the backtest while remaining essential to the apparent live result.
12. A cost filter should be fixed before the trade
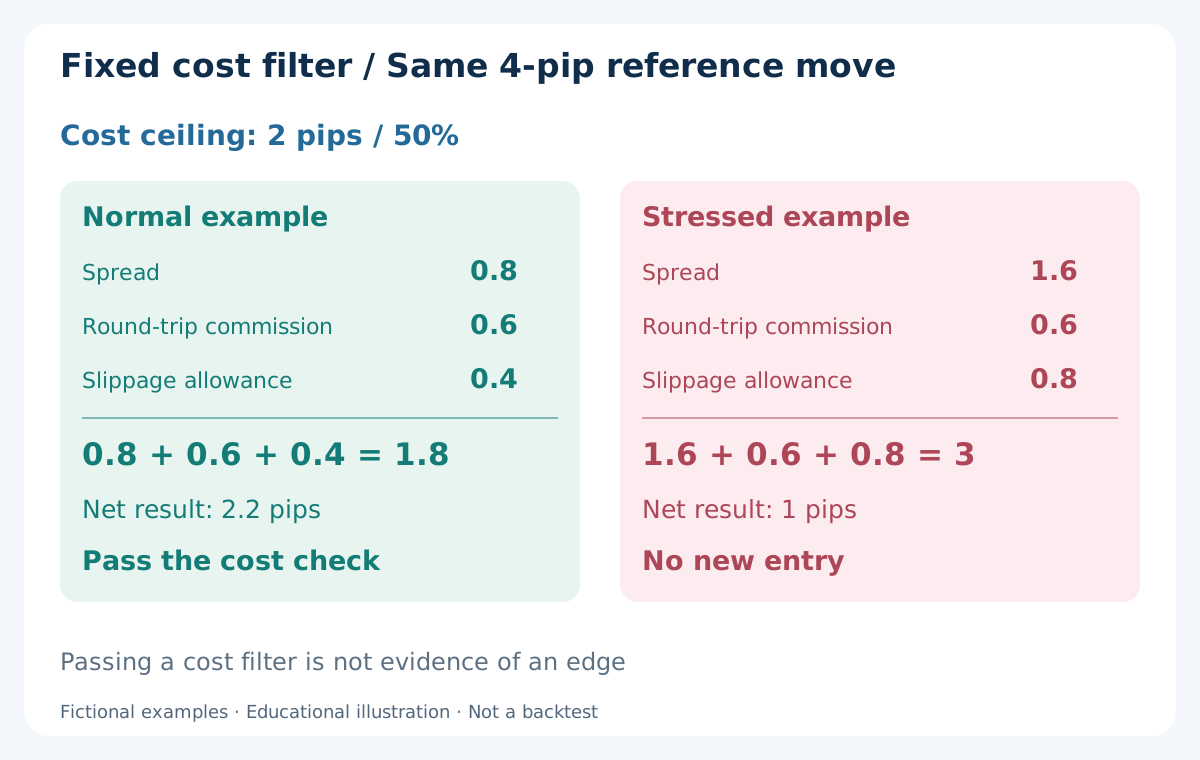
Use a second illustration to make a rejection rule concrete. Suppose a setup offers a 4-pip reference movement and the study permits estimated total friction of at most 50% of that move, or 2 pips. This threshold is deliberately an example, not a recommended universal setting. It also does not replace the need to estimate the probability and size of losses.
In normal illustrative conditions, 0.8 pip spread + 0.6 pip round-trip commission + 0.4 pip slippage allowance = 1.8 pips, leaving 2.2 pips from the reference move. The setup passes this cost test only. In stressed conditions, 1.6 + 0.6 + 0.8 = 3 pips, leaving 1 pip; it fails the 2-pip ceiling and no new entry is allowed by that rule.
Measure the spread on the candidate quote, not from an advertisement or a daily average. Predefine how stale quotes, scheduled announcements, rollover and abnormal execution disable entries. The ceiling must be applied to winners and losers alike and recorded when it rejects a signal. The economic-calendar and news-risk guide can support the event filter; a quiet calendar alone does not guarantee stable execution.
13. Manual and automated scalping need the same audit trail
Manual trading adds reaction time, attention limits and the temptation to chase an entry that has already moved. Automation can enforce timing and rejection rules consistently, but it can also repeat a programming error or send duplicate orders faster. Neither method removes spread, commission, slippage or uncertainty. Compare their observable decisions rather than treating an EA as a separate source of trading edge.
A useful record includes broker-server time, symbol and account specification, decision timeframe, signal-candle timestamp, Bid and Ask, quote age, requested and filled prices, volume, exit reason and all cash charges. Keep the data available before the decision separate from the eventual outcome. Also log disconnects, rejected modifications and orders whose status was uncertain when the program last checked.
A VPS can improve continuity, but geographic proximity does not guarantee a particular fill. Predefine how to stop and reconcile the system after a connection failure, stale quote or inconsistent order state. For ongoing operation, the live-monitoring guide explains how to compare observed behaviour with the tested rules without adjusting the method after every losing trade.
14. What would count as credible evidence?
A chart screenshot cannot show the executable quote sequence, missed fills or costs. Standard MT4 “Every tick” modelling can interpolate prices from lower-timeframe bars; its name does not establish that the test used recorded historical Bid and Ask ticks. Default Ask modelling can also use a fixed spread selected for the test. Verify the actual data and execution model instead of relying on the mode label.
If a candle contains both a stop and a target, OHLC alone cannot establish which was reached first. For very short holding periods, the assumed path and order of quote changes can materially alter results. Test the same frozen rules with defensible cost stresses, a separate out-of-sample period and a forward observation period. Do not select M1 or M5 merely because it won the same sample used to choose every other setting.
Report the number of eligible opportunities, fills and completed trades, the dates, data gaps, cost assumptions and net drawdown. Disclose changes between the research version and the forward version. The MT4 backtesting guide provides the general workflow; a trustworthy scalping evaluation also needs evidence that the small target survives the execution assumptions. This guide supplies no backtest and makes no profitability claim.
15. A practical pre-trade review
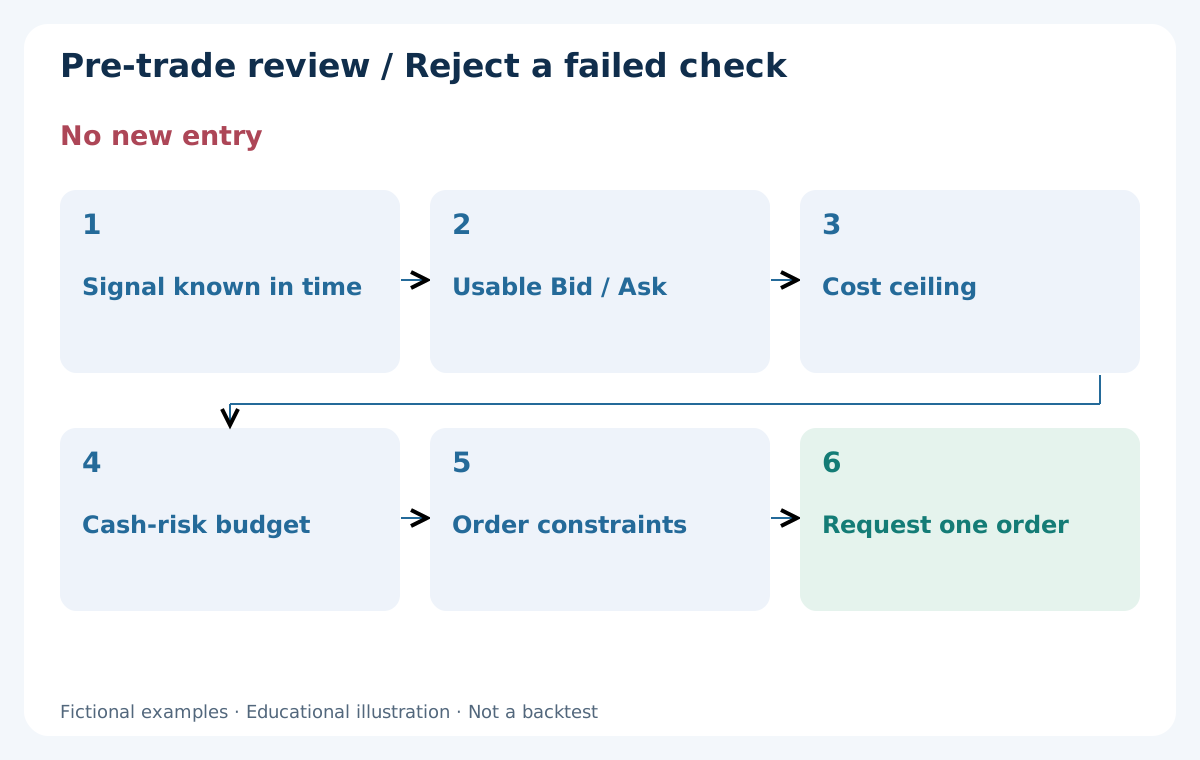
Before an entry, identify the exact rule, the completed information it uses and the deadline for acting. Check that the current quote is usable, the trading window is open and no event or daily rule blocks entry. Then inspect the executable entry side, stop side, target side and the current cost estimate. A signal without these checks is an observation, not yet an authorised order under the study rules.
Calculate volume from the cash budget, round it down to the permitted step and verify margin and order constraints. Reject the opportunity if the smallest feasible volume exceeds the budget, the target has already been consumed or the estimated execution cost violates the fixed limit. Do not widen the stop, increase the budget or relax the filter merely to rescue an attractive-looking signal.
After requesting an order, confirm its real status before another request can be sent. After exit, reconcile fills and cash charges with the broker statement. A skipped trade is a valid recorded outcome. Keeping these decisions visible makes it possible to distinguish a weak trading idea from a valid idea that could not be executed under the stated conditions.
16. How to choose between M1 and M5
Begin with the pace of decision-making you can actually sustain and a rule that can be described without hindsight. M1 is worth studying when the additional within-five-minute information is necessary to the hypothesis. M5 is worth studying when the method only needs five-minute confirmation. Neither is a sensible choice solely because an online example displays more winning markers or fewer candles.
Compare a small set of predeclared variants across the same dates and sessions. Keep account currency, cost accounting, risk budget and reporting conventions comparable; disclose when stop logic or exit timing differs. Examine net outcomes, execution failures, adverse price moves while open and dependence on a few exceptional days. Fewer trades with a credible cost model can be more informative than a large set of idealised fills.
The conclusion may be that one interval deserves further testing, that both remain unproven or that the intended move is too small for the account’s execution conditions. That is a useful result. Before moving to a specific scalping strategy, you should be able to explain when its information becomes available, which quotes can execute it, how costs enter the ledger and what makes an opportunity unacceptable.
Frequently asked questions
What is scalping in Forex?
Scalping is an intraday style aimed at relatively small price movements, usually with short holding periods. There is no universal pip target or required number of trades. Its viability depends on net outcomes after execution costs and losses, not on how frequently a trader presses Buy or Sell.
Is M1 better than M5 for scalping?
Neither is inherently better. M1 reveals more of the sequence within a five-minute interval and provides more candle-close decisions. M5 aggregates that information. Compare clearly defined methods under realistic quotes, costs and the same cash-risk framework; the chart interval alone does not determine holding time or profitability.
Should I subtract spread from the profit shown by actual fills?
Do not subtract it again if your price profit already uses the actual entry and exit fills. Their difference reflects the execution prices, including the spread effect and realised slippage. Deduct separately booked commission and financing as applicable. A reference chart-movement calculation uses a different starting point and needs its own spread adjustment.
Does a high win rate make a scalping strategy profitable?
No. The size of net wins and net losses matters as well. In the fictional two-outcome example here, a 4-pip net win against a 6-pip net loss requires a 60% win rate just to break even. Real trade distributions can be more complex, and no such win rate is established by this guide.
Can a tight stop guarantee a small loss?
No. The stop trigger and actual fill can differ, particularly during gaps or fast quote changes. Position size, commission and execution allowances also matter. A planning budget is useful for sizing, but it is not a guaranteed cap on loss and must be combined with daily and concurrent-exposure controls.
Can a Forex EA remove scalping execution risk?
An EA can enforce written timing and risk rules, but it cannot guarantee fills, a stable spread or a profitable edge. It needs reliable data, order-state checks and a procedure for connection failures. The strategy, implementation and account execution conditions all require separate evaluation.
Sources and execution notes
The official platform references below support the order-price conventions and the limits of standard MT4 modelling. All prices, cost scenarios and risk calculations in this guide are original fictional examples; the sources do not validate a scalping edge. Check current account and symbol specifications with the broker.
Educational content. All diagram prices and numerical trade examples are fictional, not backtest results. Forex trading involves risk; stops, cost filters and planning budgets do not guarantee a maximum loss.