

Two VWAP lines can disagree even when they use the same currency pair. The starting point, candle interval, price formula and volume field all matter. This guide makes those choices visible on real EUR/USD data. You can inspect a bar-weighted price proxy, compare it with the mean of recorded Bid quotes and see exactly when missing history makes a calculation unavailable.
1. What VWAP means on a spot Forex chart
VWAP divides a cumulative price–weight sum by the cumulative weight. With executed prices and transaction sizes, the weights describe traded volume. A spot Forex quote export can instead supply quote activity. Applying the same arithmetic to those counts produces a different measurement: a price average weighted by activity in that particular feed.
Here the displayed line is explicitly a bar-weighted VWAP proxy. It does not identify the average execution price of all Forex participants or reveal institutional inventory. Its practical value starts with a reproducible definition, rather than a claim that the line is a universal fair price.
2. The real EUR/USD sample and its clock
We use HistData's January 2024 Generic ASCII tick archive, identified by its SHA-256 in the downloads. The archive contains 2 176 113 Bid/Ask records. This study extracts 71 261 records from 2024-01-08 00:00 up to 17:00 UTC. The source uses fixed EST, UTC−05:00, so five hours are added without a daylight-saving adjustment.
The source Volume field contains zeros. The calculation reconstructs N and Q from the quote stream instead of treating those zeros as traded volume. There are 1 017 observed M1 bars and 204 observed M5 groups in the study slice; three M5 groups have fewer than five observed minutes. The selectable 07:00–17:00 window contains 600 M1 or 120 M5 bars.
3. Choose N or Q before comparing weighted averages
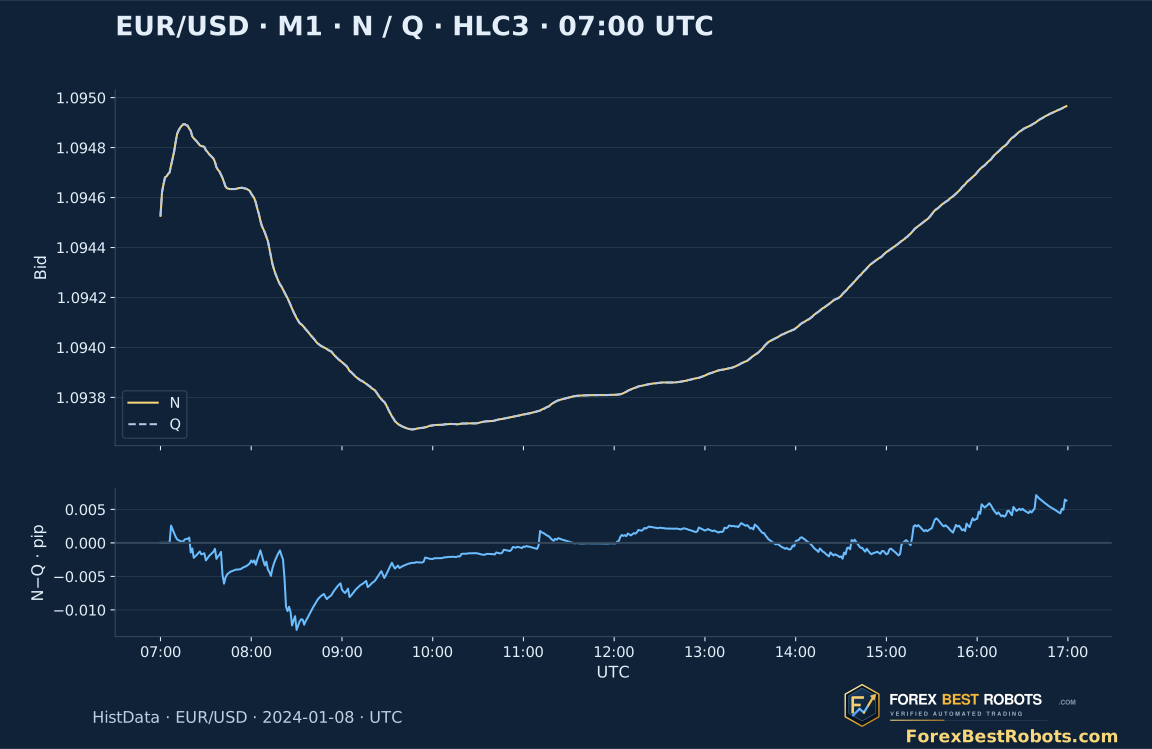
N counts every original quote record. Q counts a record when Bid or Ask differs from the preceding archive record; the first archive record counts once. The comparison continues across minute boundaries. The study slice contains 70 929 such changing records. These definitions match the preceding tick-volume guide.
A bar with more selected events receives more weight. Switching N to Q changes the weights, not the historical prices. The difference can be small in this sample, which is itself useful evidence: show the difference on a pip scale rather than enlarging the price axis and implying a large effect. Neither field is executed lot size.
4. Read the cumulative formula without using future bars
For HLC3, the bar price P is (High + Low + Close)/3; the alternative here is Bid Close. W is that bar's N or Q count. Starting at anchor a, add P×W and W through the selected completed bar t, then divide. The current completed bar belongs in this cumulative average. That differs from the earlier guide's activity baseline, which deliberately excluded the selected bar.
The label is the interval start. A 07:30 M1 value uses observations in [07:30,07:31) and becomes available after that interval has ended. On M5, the same label covers [07:30,07:35). The viewer shows historical closed bars; changing a setting does not make the final value available earlier.
P[i] ∈ {(H[i] + L[i] + C[i]) / 3, C[i]}
W[i] ∈ {N[i], Q[i]}
VWAP_proxy[a:t] = Σ(P[i] × W[i]) / ΣW[i]
5. Change the anchor and keep the rest fixed
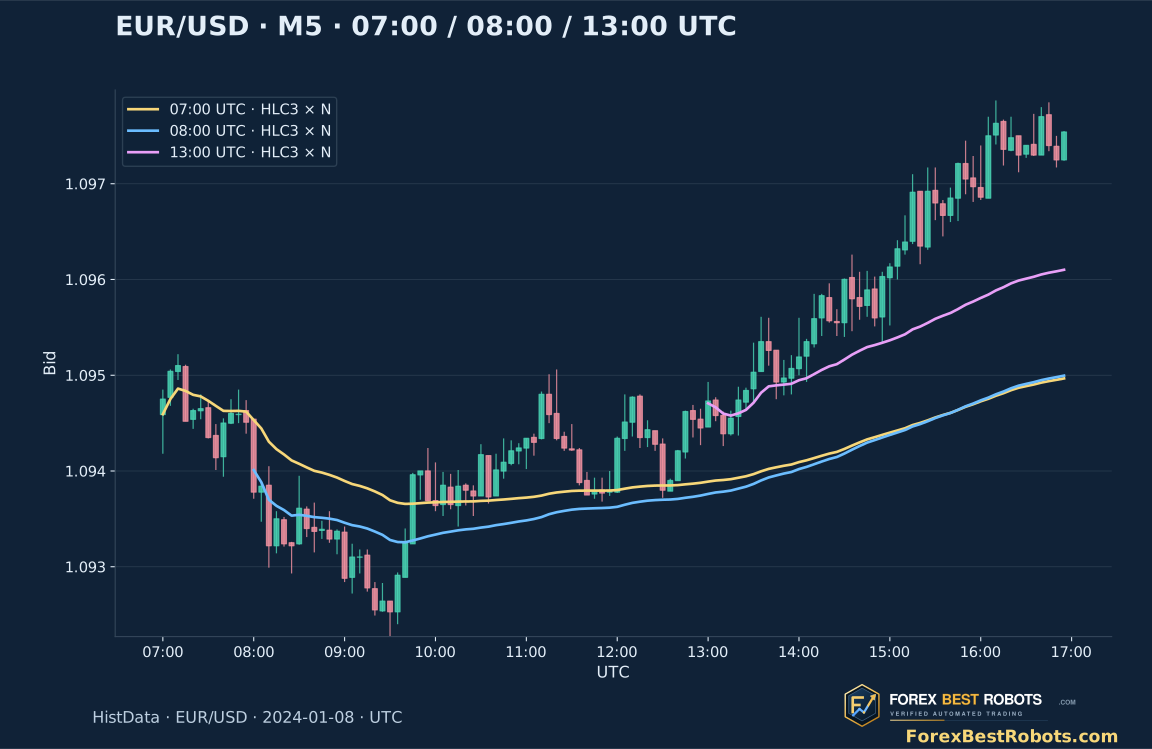
The examples compare fixed 07:00, 08:00 and 13:00 UTC anchors on the same day. Each starts a new cumulative sum at that exact candle boundary. The chart shows how retaining earlier observations changes the line, especially after price moves away from the older average. These UTC choices are research settings, not universal London or New York opening times.
A daily reset, a session reset and a manually selected event anchor are different conventions. State the broker's clock and any daylight-saving conversion when reproducing a session-based indicator. Moving an anchor afterwards to make a historical bounce look precise is a retrospective selection; a trading study needs an anchor rule that was knowable at the time.
6. Check the first anchored candle by hand
At 13:00 UTC on 2024-01-08, the first M1 candle after a 13:00 anchor has 102 records. Its HLC3 is 1.0945667 when rounded to seven decimals. With only that bar in the sum, (P×102)/102 equals P. It does not have to equal the Open or Close because HLC3 is a different price formula.
At 07:30 with the 07:00 anchor, M1, HLC3 and N, the sum contains 31 completed bars and 2 349 records. The proxy is 1.0947893. These are fixed clock examples for checking the arithmetic, not entries selected for a profitable outcome. The calculation keeps full precision; displayed values are rounded.
7. Separate the price source from the event weights
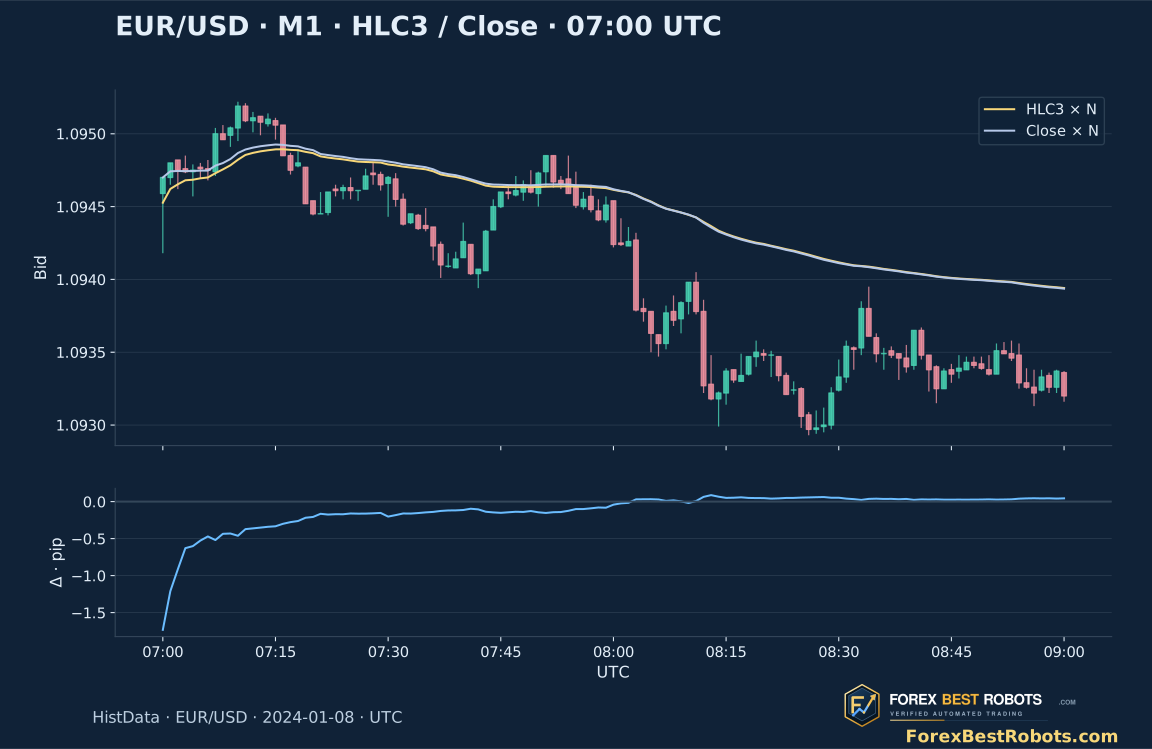
Changing HLC3 to Close keeps the same anchor and event counts but assigns a different representative price to each candle. HLC3 uses the completed candle's High, Low and Close; it is not an average of every observed quote inside that candle. A platform's source menu therefore affects the result even when its volume field is unchanged.
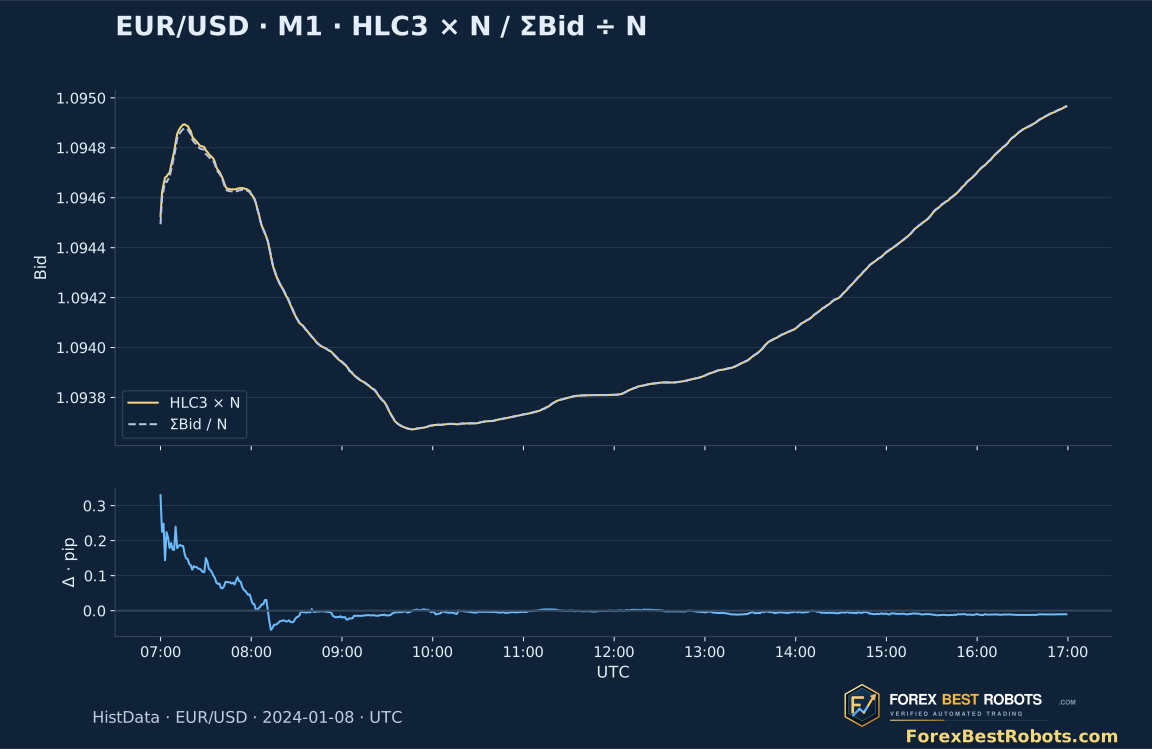
The figure compares both formulas and plots their difference in pips below the price panel. All OHLC values here use Bid. The average does not include an Ask entry, commission or slippage, so a distance from Close to the proxy is a price distance, not an estimated net profit.
8. Why M1 and M5 proxies can disagree
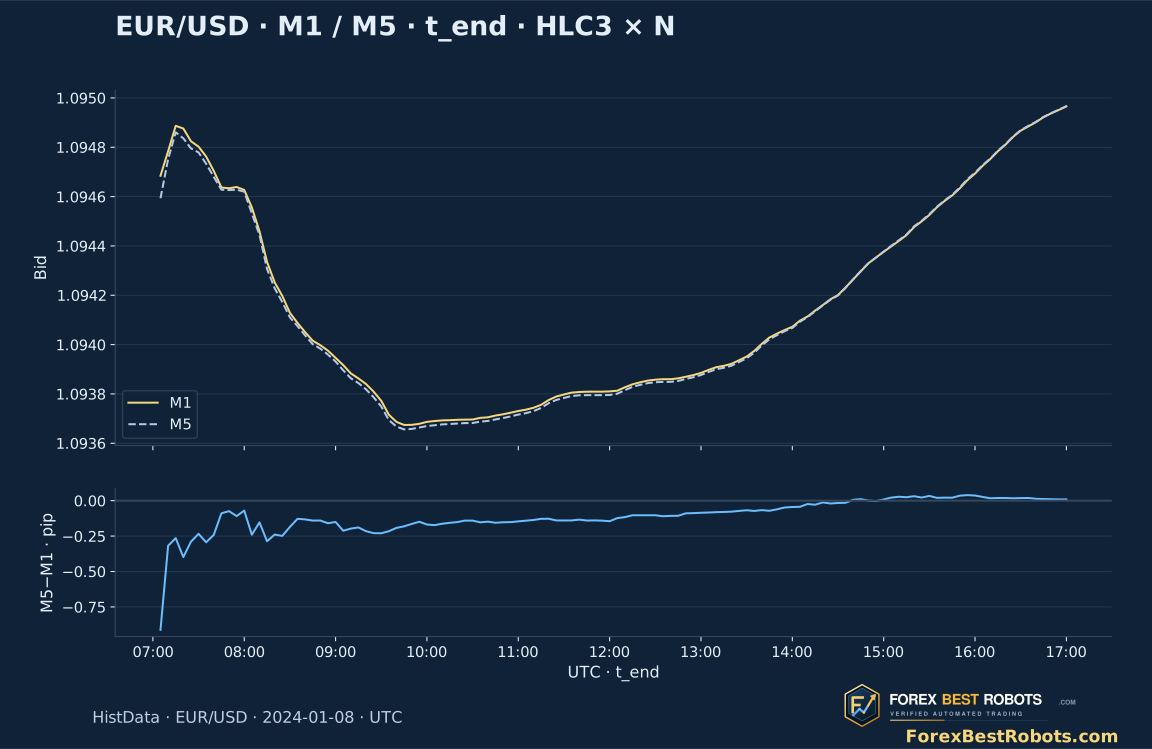
N and Q add across aligned M1 bars, but HLC3 does not preserve every quote's price when five candles are merged. A single M5 High, Low and Close replace five M1 price representatives. Consequently, an HLC3-weighted M5 proxy need not equal the M1 proxy even at the same interval end.
The comparison uses common M5 ends: the value for an M5 candle starting 15:00 is compared with the M1 accumulation through the 15:04 candle, both available at 15:05. Comparing the two candles labelled 15:00 would mix different information cutoffs. The direct recorded-quote mean does remain equal at common ends when it uses the same records and event convention.
9. Compare the bar approximation with actual recorded Bid quotes
The dashed reference adds the Bid price of each selected quote record and divides by the selected record count from the same anchor. For N, every record gets one observation; for Q, only Bid/Ask-changing records contribute. This is an event-weighted quote mean, not a time-weighted mean or transaction VWAP.
At the 07:30 example, the N quote mean is 1.0947743, while the HLC3×N proxy is 1.0947893: a difference of about 0.150 pip. That gap comes from representing an entire minute by HLC3. The lower panel makes the approximation visible without treating either quote-based average as an execution benchmark.
10. Inspect a closed candle and change one setting at a time
Select M1 or M5, an exact UTC anchor, a price formula and N or Q weights. Then choose a candle or step through the history. The status line repeats your settings; unavailable values explain whether the anchor is later or the history contains a gap.
Open a fixed example · settings are applied automatically
Blue marks the selected candle. The gold line is the bar-weighted proxy; the dashed line is the mean of recorded Bid quotes under the same event convention. Only bars through the selected candle are shown.
On a narrow screen, scroll inside the chart to read its full width.
Values through the selected closed candle
- UTC interval · end excluded
- —
- Bid Open / High / Low / Close
- —
- Selected representative price · P
- —
- Selected candle weight · W
- —
- Cumulative event count · ΣW
- —
- Complete candles since the anchor
- —
- Bar-weighted VWAP proxy
- —
- Mean of recorded Bid quotes
- —
- Bid Close − proxy · pips
- —
- Proxy − quote mean · pips
- —
- Selected candle median spread · pips
- —
Calculations keep full precision; displayed prices and differences are rounded. The quote averages contain no executed trade sizes.
Show the cumulative calculation
11. Keep missing history visible instead of bridging it silently
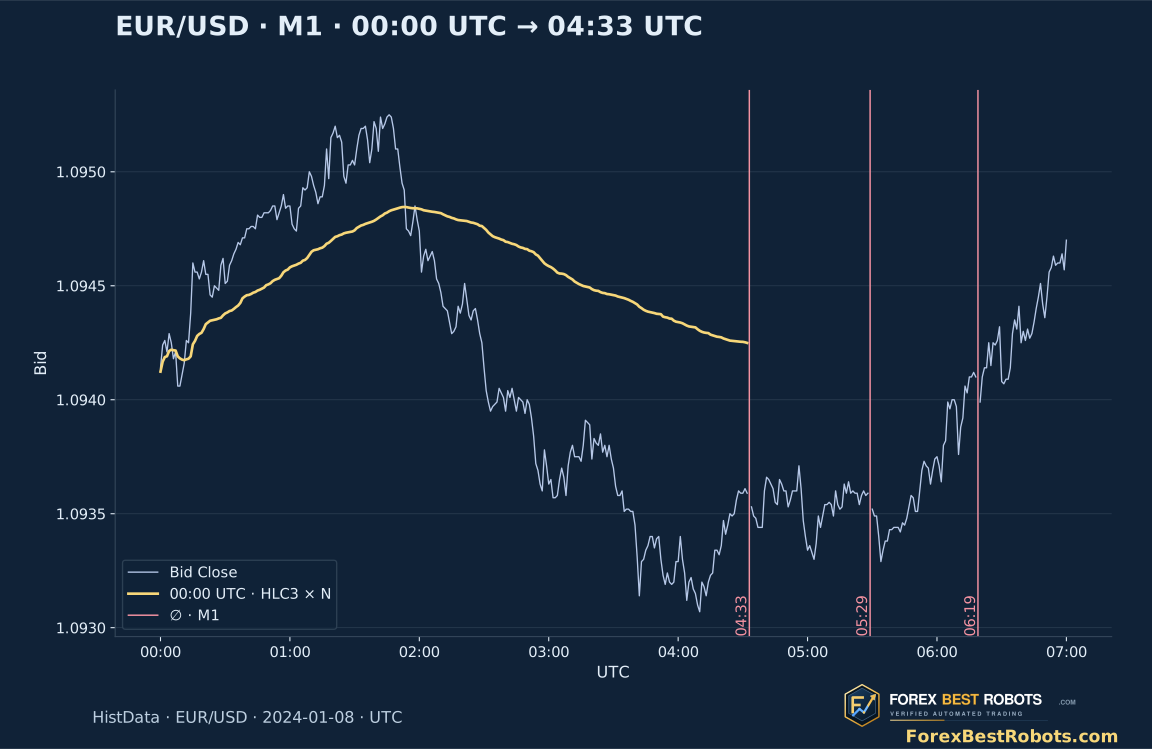
There are no source records in the minutes starting 04:33, 05:29 and 06:19 UTC. Their cause cannot be established from these quotes alone. Under this guide's strict coverage rule, a 00:00-anchored calculation stops at the first missing interval and stays unavailable afterwards. On M5, a group with fewer than five observed minutes also breaks coverage.
The 07:00, 08:00 and 13:00 anchors avoid those earlier gaps, once the selected candle has reached the chosen anchor. Each required minute then has observations. This checks minute coverage; it does not certify that every market update was captured. Another indicator may deliberately skip gaps, but that policy should be named before comparing its line with this one.
12. Match the platform settings before judging a mismatch
Record the symbol and feed, server-to-UTC conversion, reset rule, timeframe, source price and applied volume. In MT4, Volume[] and iVolume expose tick-volume values; this article's N and Q are declared reconstructions from HistData, rather than an export of a broker's native MT4 field. A zero-filled M1 file cannot supply the missing quote sequence.
Check whether the indicator updates the developing candle, whether it uses an offset and how it handles absent or zero weights. Resetting on broker midnight may differ from 00:00 UTC. Match all settings on a few completed bars before calling a chart or an indicator incorrect.
13. Turn a line crossing into a separately testable rule
A close above the proxy describes a relationship between two calculated prices. To study a reclaim strategy, first specify the anchor, source and weights, then define the crossing, recognition time, order type, invalidation and exit. Preserve every eligible event and account for Bid/Ask, commissions, rejected orders and slippage.
Freeze those choices before the later test period and compare alternatives on the same opportunity calendar. This guide validates the measurement and shows its sensitivities. It supplies no trade backtest or profitability estimate; a later strategy must evaluate those questions with explicit execution rules.
Frequently asked questions
Is a Forex tick-weighted VWAP the market's average execution price?
No. A line weighted by quote counts measures the chosen feed and counting convention. Without executed prices and transaction sizes, it cannot establish the market-wide average execution price.
Why does a new anchor change the line?
An anchor determines which earlier candles belong in the cumulative sums. Changing it adds or removes historical price–weight contributions. Keep the other settings fixed to see that effect.
Should the first anchored HLC3 value equal the candle's Close?
Not necessarily. With one positive-weight candle, the weighted average equals that candle's HLC3. It equals Close only when the chosen price formula or that candle's prices make them equal.
Should M1 and M5 VWAP proxies match?
Not generally when each candle is represented by HLC3 or Close. Compare them at the same interval end. The direct quote mean does match when the selected records, anchor and event convention are identical.
Why is the 00:00 anchor unavailable in the viewer?
The input contains missing minutes at 04:33, 05:29 and 06:19 UTC. The declared rule requires complete interval coverage from the anchor, so it does not bridge those gaps. A later anchor can have complete coverage.
Does a close above the proxy validate a long scalp?
It describes a price relationship. A trading rule still needs recognition timing, execution, risk and exit conditions, followed by evaluation with costs. This guide does not report trading performance.
Data, timing and reproducibility
Downloads include the observed M1/M5 OHLC, event counts, sums of recorded Bid quotes, spreads, UTC timestamps and a replay script for the declared proxies. Prices use integer millionths; one EUR/USD pip is 100 such units. The source archive is identified by its public download page and SHA-256; its raw monthly contents are not republished in the data kit.
The study covers 2024-01-08 00:00–17:00 UTC; the viewer selects 07:00–17:00 and retains earlier inputs for the anchors. Three missing minutes remain absent. The examples are fixed clock observations, not selected trades. All original and interactive charts carry the ForexBestRobots logo and domain.
- M1 prices, quote counts and quote sums (CSV)
- M5 prices, quote counts and quote sums (CSV)
- Input data, source identification and calculation method (ZIP)