

Smart Money Concepts groups several price-action ideas into one vocabulary. This guide separates what a chart actually shows from what a trader infers, then follows one fictional sequence from a known reference to two price zones and the later invalidation of the FVG. It is a guide to reading and testing conditions, not a complete trading strategy.
1. What SMC describes, and what it cannot establish
SMC is a family of chart-reading conventions, rather than a single standardised model. Common terms include market structure, liquidity, displacement, order blocks and fair value gaps. Two educators can use the same name for different boundaries or confirmation rules. A useful explanation therefore states its actual price conditions.
A retail candle records prices from a particular feed. It does not identify the trader behind a move, reveal a bank’s unfilled orders or prove why a reversal occurred. In this guide, an institutional interpretation remains an inference. The observable objects are completed bars, previously known levels and later quotes.
2. Separate direction, location, trigger and execution
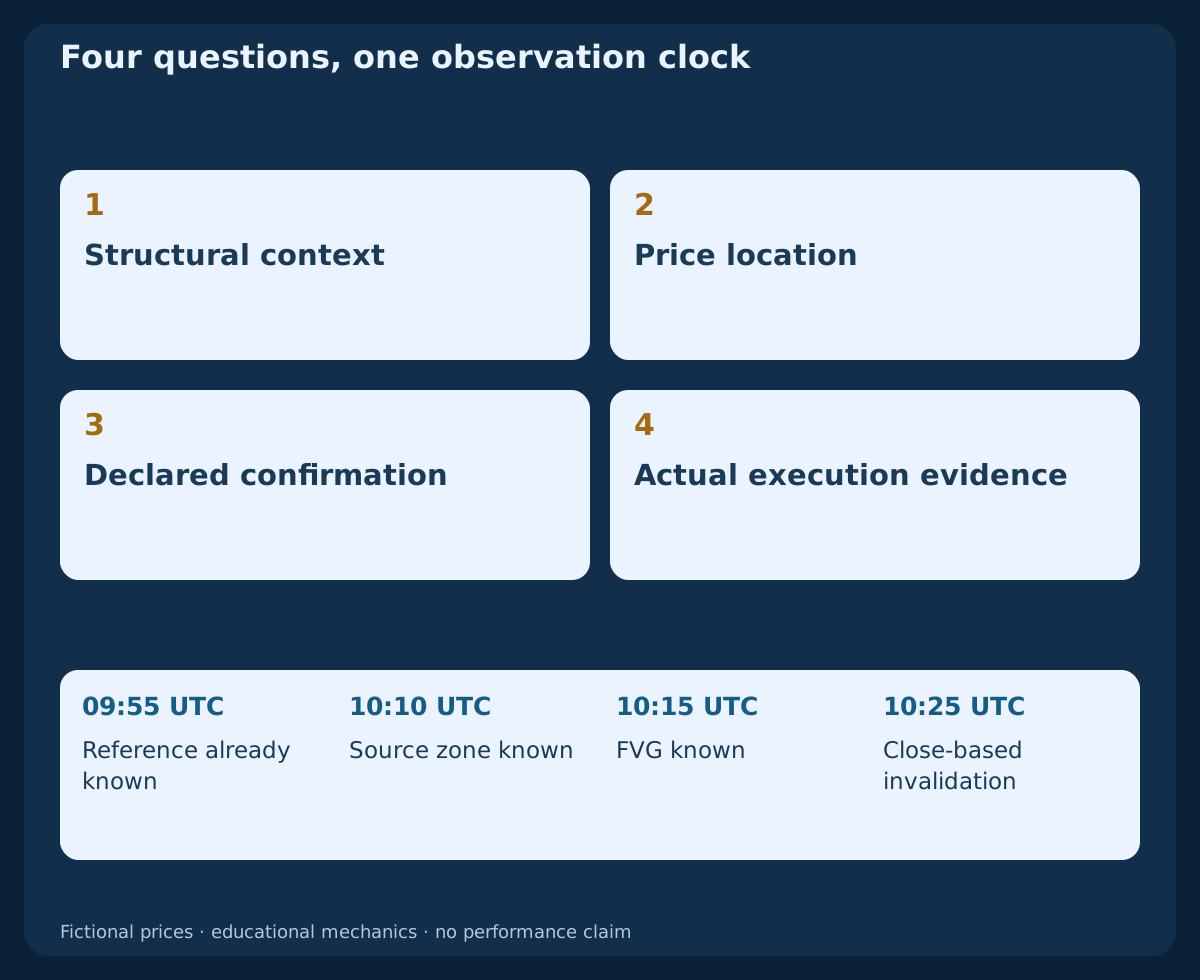
Start with four questions: what is the current structural context; where is the area of interest; which later observation would qualify; and what price could actually be executed? Combining those roles is a way to organise research, not evidence that a setup has an edge.
For example, bullish structure can supply context while a bullish zone supplies a location. A defined completed-bar response could be a trigger in a separately specified strategy. Acceptance, fill and exit still need their own evidence. A zone touching a line on a chart does not answer all four questions.
3. Use only structure that was already knowable
Higher highs and higher lows describe one upward sequence; lower highs and lower lows describe a downward one. If a swing definition requires two later candles, its pivot becomes usable only after those candles close. Do not move its recognition time back to the candle at the extreme.
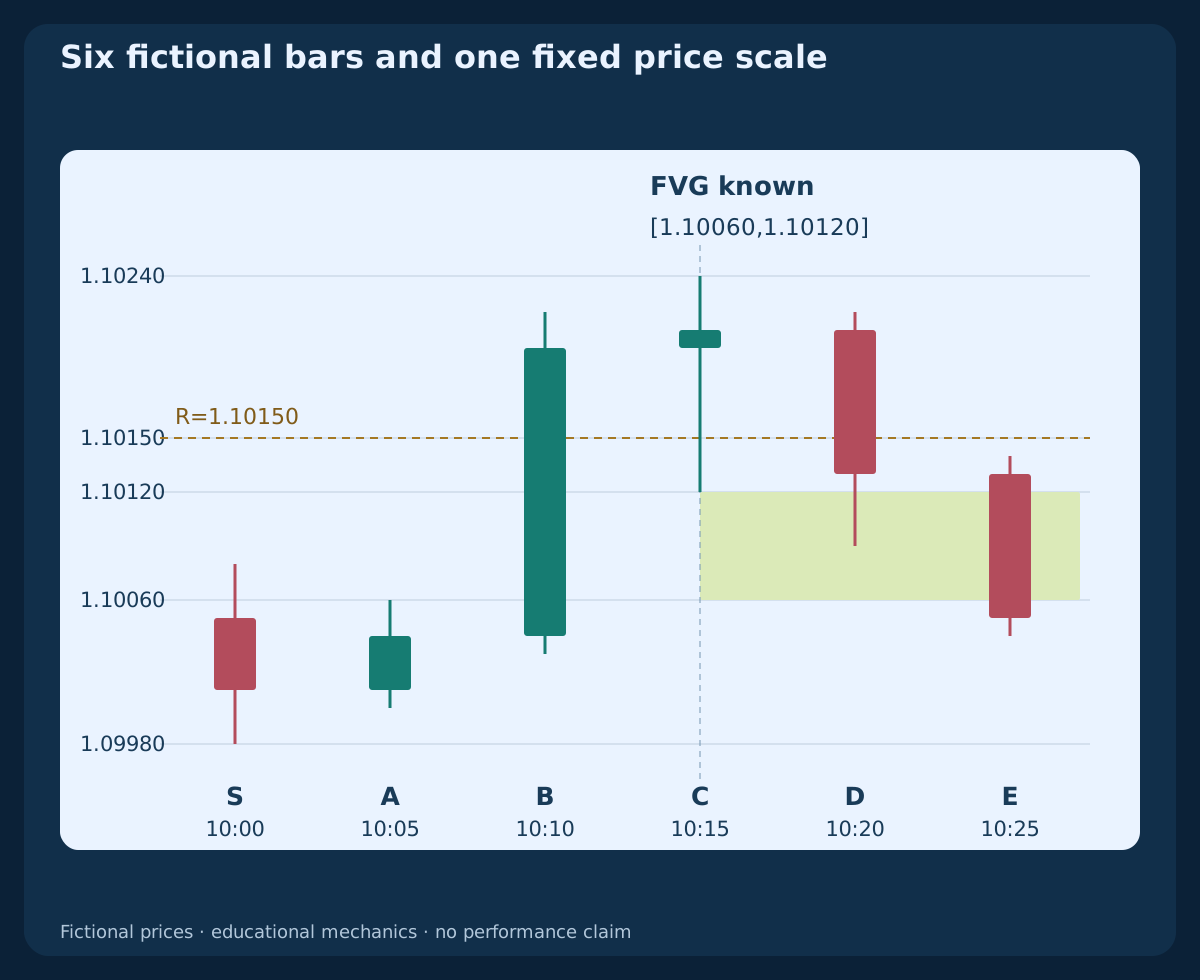
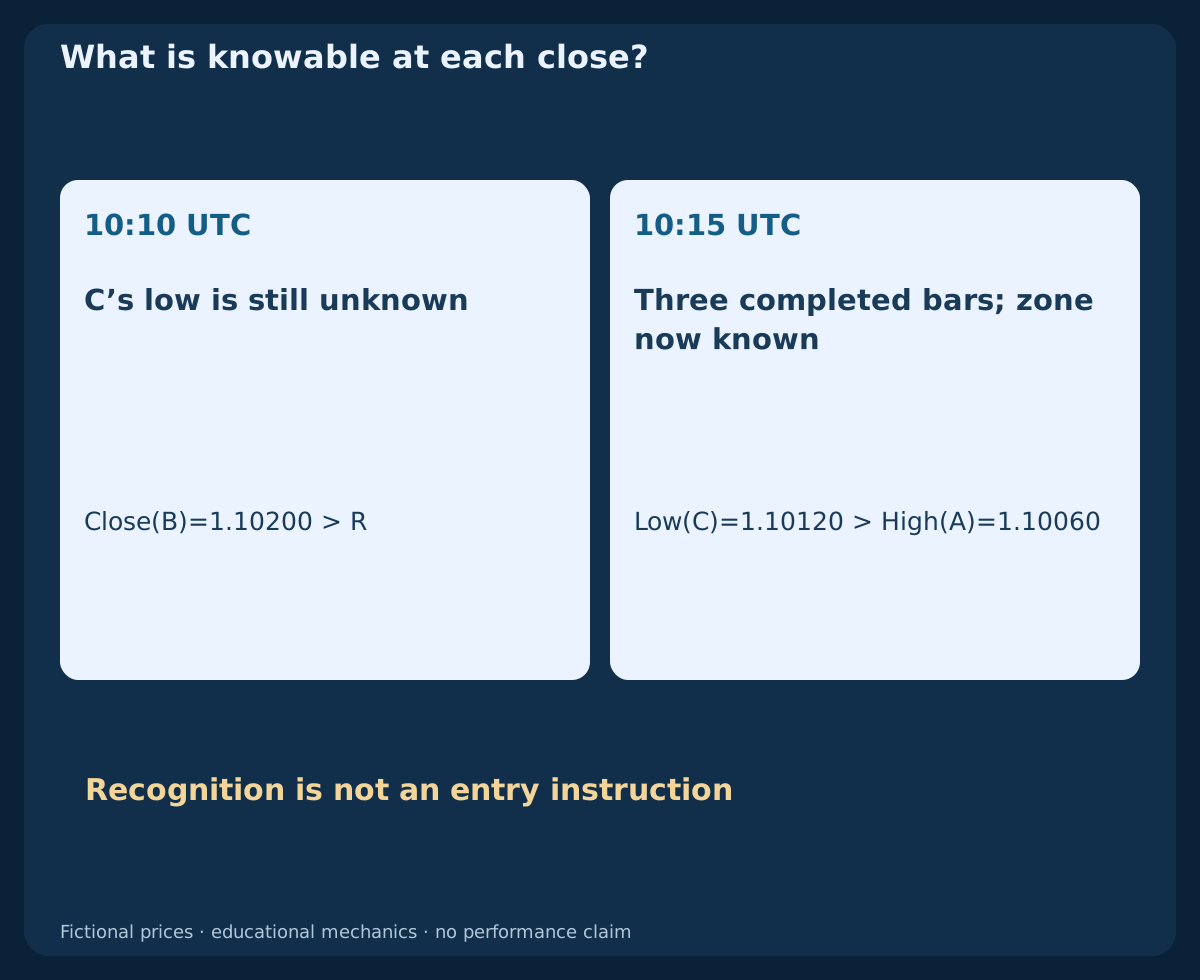
The worked M5 sequence uses R=1.10150 as a reference already known before 09:55 UTC. At 10:10 UTC, B closes at 1.10200>R. That is an observable reference break under this guide’s close rule. Whether a model calls it BOS or CHoCH additionally depends on its previously declared structural state.
4. Distinguish a sweep from a confirmed break
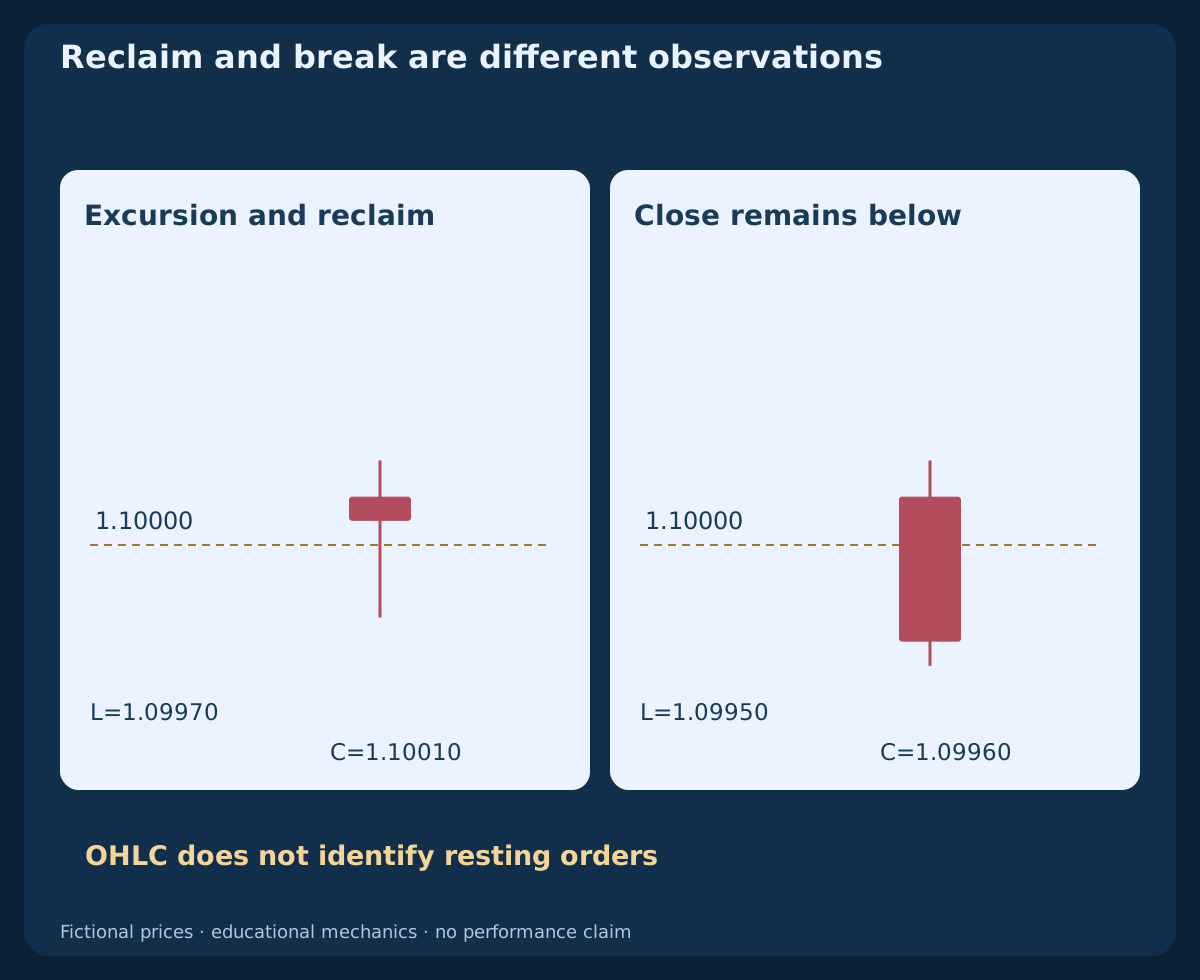
For a separate illustration, freeze a known low at 1.10000. A bar with Low=1.09970; Close=1.10010 trades below the level and closes back above it. A bar closing at 1.09960 instead remains below. These observations describe different outcomes under a close-based definition.
Calling the first observation a liquidity sweep does not establish that specific stops were filled, or that a large participant deliberately caused it. OHLC does not contain that evidence. Declare whether equality counts, which price feed is used and when the reclaim must occur; otherwise the label can be fitted to almost any later reversal.
5. Define displacement before selecting a zone
A large candle is noticeable only relative to a declared comparison. A research rule might compare body size with a fixed earlier window, or require a close beyond an already known reference. Different choices create different eligible samples. Do not choose the threshold after seeing the best-looking move.
Our small fixture uses the explicit break Close(B)>R to demonstrate timing. B’s body is 16 pip, from 1.10040 to 1.10200. That number is descriptive; it is not an optimised displacement threshold, and the six supplied bars are not enough to estimate a historical edge.
6. Recognise an order block under a stated convention
Here S is the last bearish source candle before the illustrated upward sequence: Open=1.10050; High=1.10080; Low=1.09980; Close=1.10010. A and B then rise, with B providing the declared reference break. This example labels S’s full high-low range as the bullish order-block zone only when B’s close is known.
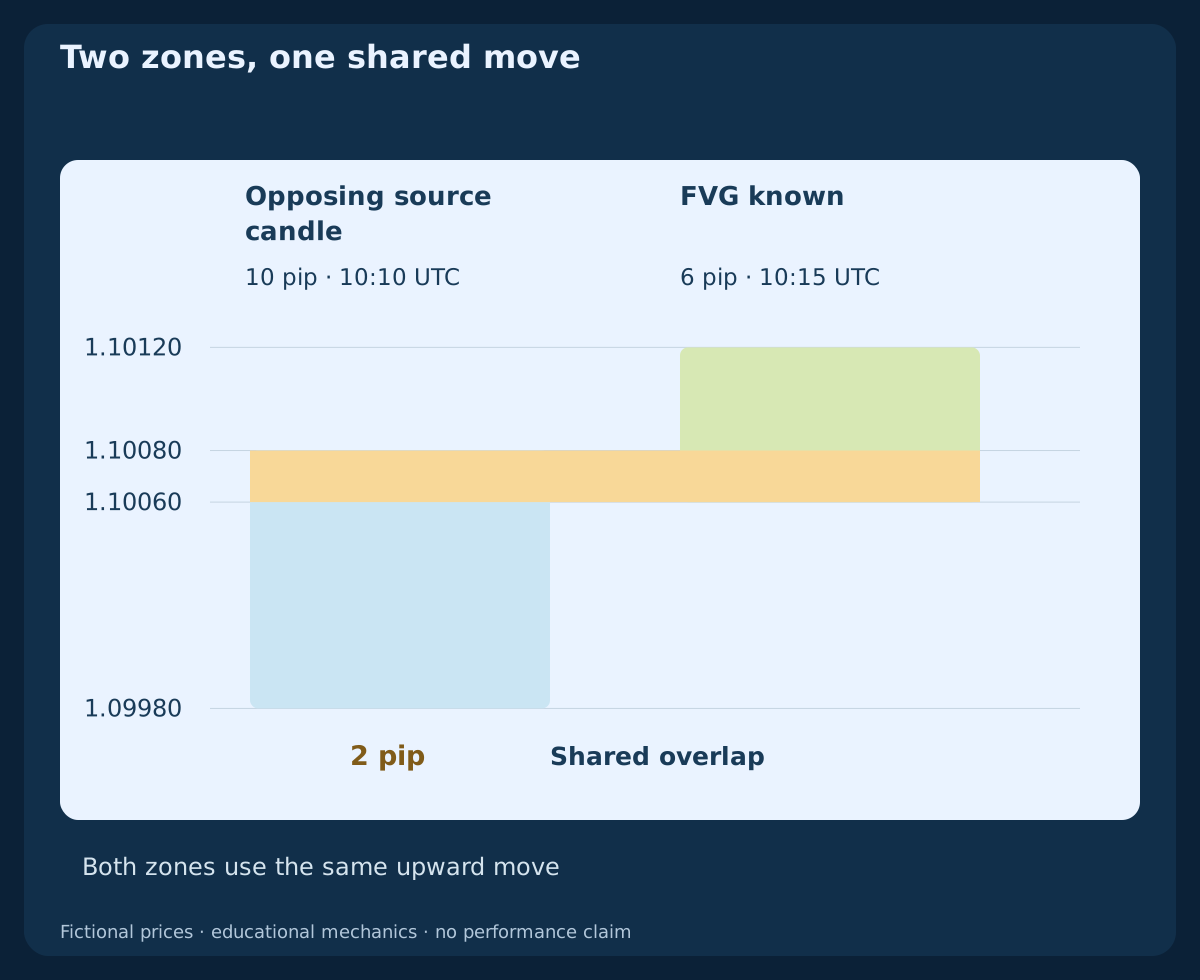
The resulting frozen interval is [1.09980,1.10080], with width 10 pip, recognised at 10:10 UTC. A body-only convention would be a different object. Keep that distinction explicit, and avoid treating the zone as proof of orders waiting there. The existing Order Block strategy gives a separate complete first-return specification.
7. Recognise a three-candle fair value gap
For the consecutive completed bars A, B and C, this guide defines a bullish FVG by Low(C)>High(A). With High(A)=1.10060; Low(C)=1.10120, the interval is [1.10060,1.10120] and the width is 6 pip. The bearish mirror uses High(C)<Low(A). Equality creates zero width and fails this strict-gap definition.
C closes at 10:15 UTC, so this FVG is not yet known at B’s 10:10 UTC close. This three-bar non-overlap is also different from a session opening gap: B has traded through the interval. It does not establish that no transactions occurred there or that price must return to fill it.
8. Do not count shared information twice
The order-block zone and the FVG in this example come from the same upward sequence. Their overlap is [1.10060,1.10080], which is 2 pip. They became knowable at different closes, but both depend on that same move. Adding the two labels does not produce two independent pieces of evidence.
An overlap can be recorded as a narrower area of interest if that rule is declared in advance. It does not automatically justify a smaller protective stop or a larger position. Test whether the overlap filter changes the event sample, misses valid cases or merely makes hindsight drawings look more precise.
9. Measure partial returns without redrawing the original
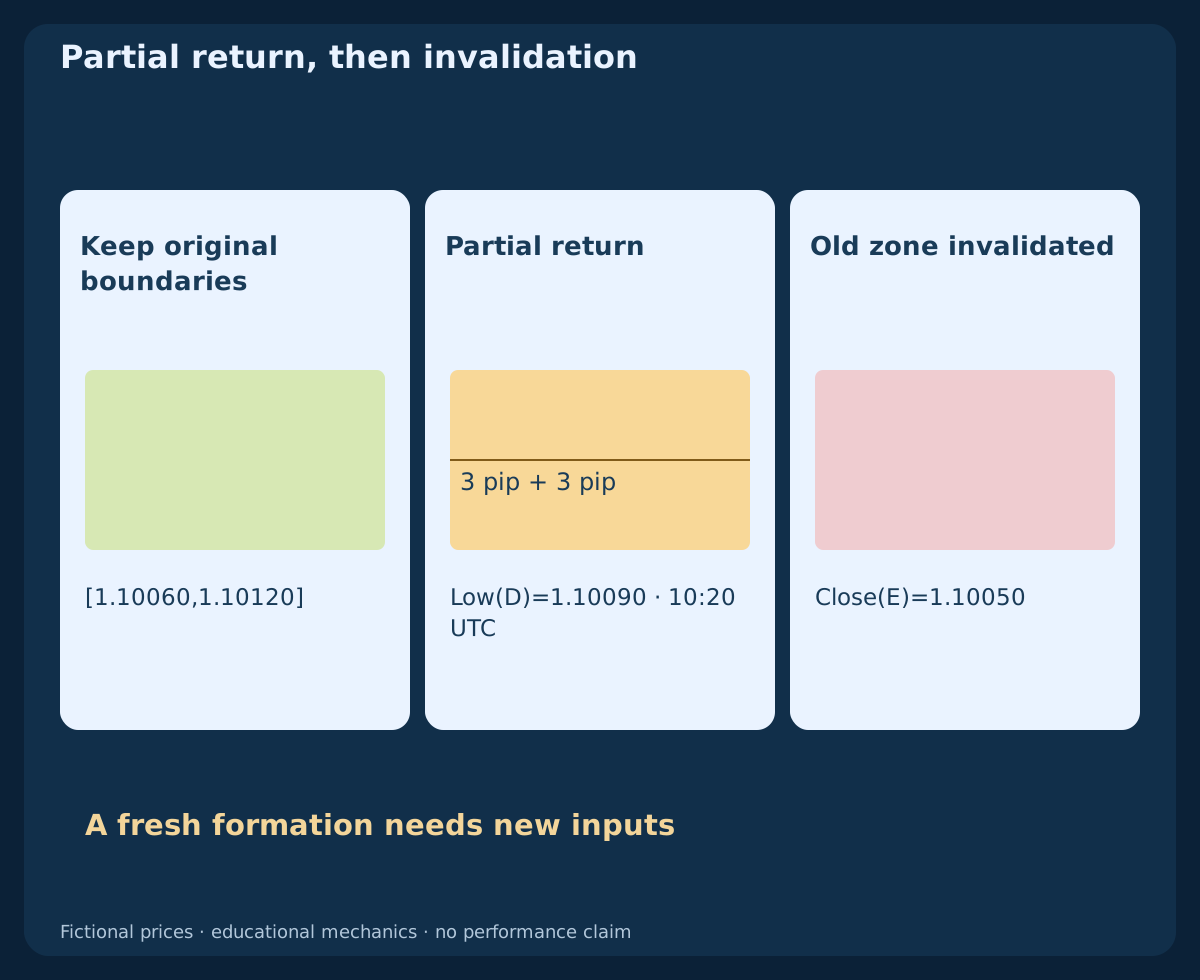
D’s completed bar at 10:20 UTC records Low=1.10090, after the FVG has been recognised. From its upper edge at 1.10120, that covers 3 pip of the original 6 pip interval. The lower 3 pip remain unvisited by the supplied Bid lows at that stage. Keep the original boundaries and mark the visited portion separately.
Some traders call such a return mitigation or a partial fill. Those terms describe price revisiting an area in this context; they are not broker execution reports. If a study changes the remaining zone after each touch, document that as a new dynamic rule rather than quietly replacing the original fixed interval.
10. Give the zone an expiry and an invalidation rule
A location can expire before an entry occurs. A complete model must state its maximum age, first-return policy and invalidation condition. A wick-based failure and a close-based failure are different rules, with different recognition times. Neither can be swapped in afterwards to preserve a winning example.
For this guide’s illustrative bullish FVG, invalidation requires a completed close below 1.10060. E closes at 1.10050 at 10:25 UTC, so the example zone fails then. A later rally cannot restore that old hypothesis. A new candidate would require a newly completed formation under its own rules.
11. Keep Bid, Ask and an actual fill separate
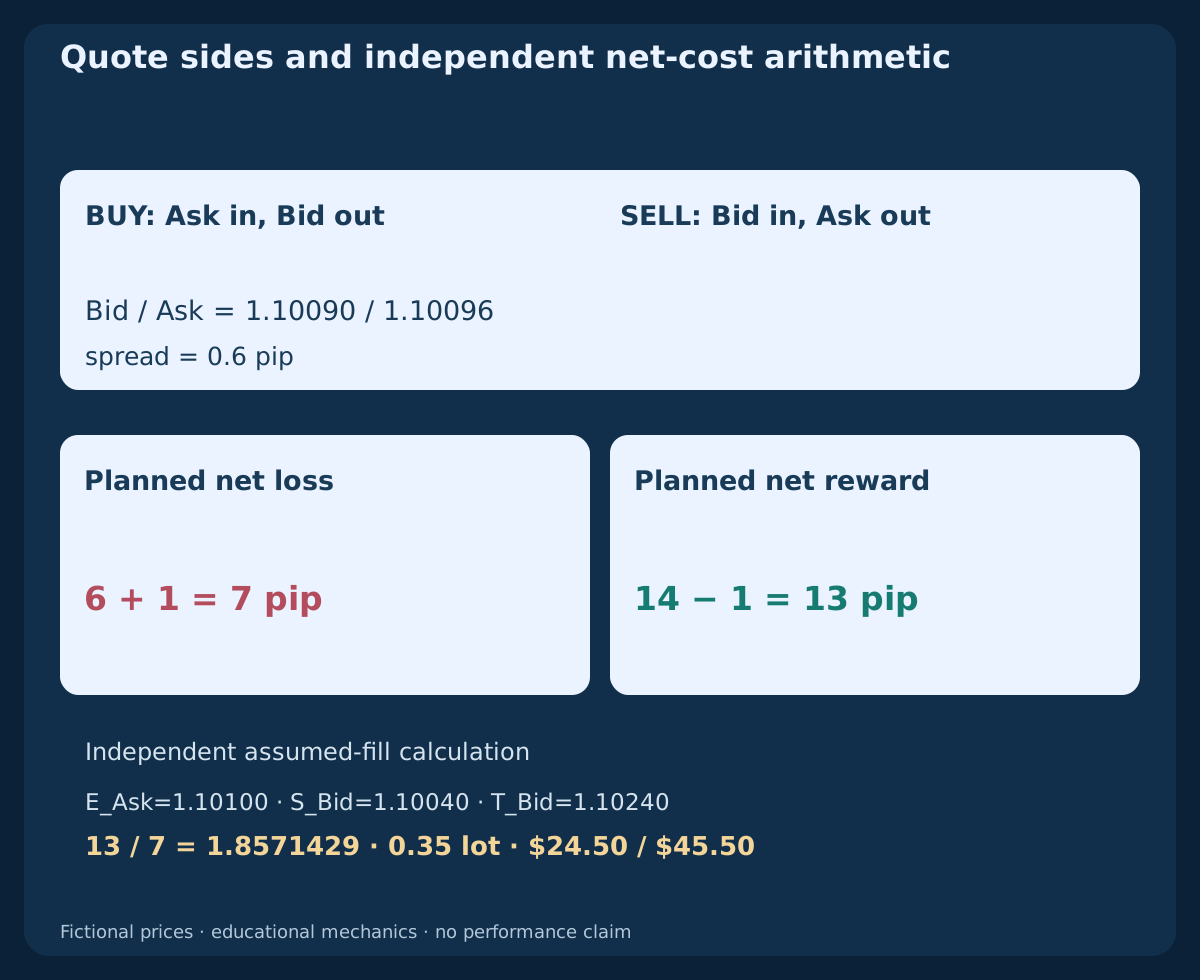
In the declared EURUSD contract, pip=0.0001; point=tick=0.00001. The example assumes contract=EUR100,000/lot; account=USD. Suppose a paired observation is Bid=1.10090; Ask=1.10096. The spread is 0.6 pip. Bid has reached a level at 1.10090, but Ask has not. A Buy Limit at that level cannot be inferred to have triggered from this Bid touch alone.
MT4 history charts use Bid prices. BUY opens on Ask and its protective exits are checked on Bid; SELL opens on Bid and its protective exits are checked on Ask. A quote reaching a trigger still does not independently supply a broker fill report. Record price observations and execution evidence in separate fields.
12. Translate a price idea into net cost arithmetic
Use a separate, independent BUY arithmetic example: an assumed fill at Ask=1.10100, stop at Bid=1.10040 and target at Bid=1.10240. The raw distances are 6 pip of loss and 14 pip of reward. They are not an entry instruction for the earlier bar sequence.
Assume a 0.4 pip worse-exit allowance and 0.6 pip linear round-trip commission: c=1.0 pip; L=6+c=7; W=14−c=13; W/L=13/7=1.8571429. Entry and exit already use their proper quote sides, so do not add spread again. The allowance is an assumption, not a cap on slippage or gaps.
13. Size risk from the stop rather than the zone’s label
With equity=$10,000; risk=0.25%; budget=$25 and an assumed $10/pip/lot, the independent arithmetic example gives lots=floor_step(25/(7×10),0.01)=0.35. Planned net loss is $24.50 and planned net target is $45.50. These calculations assume compatible lot limits, adequate margin, linear commission and no additional fees.
A two-pip overlap between drawings is not a two-pip account risk. The protective level, executable quote, contract and costs determine the plan. A wider actual fill, a worse exit or different fees can exceed that budget. SMC terminology does not change these mechanics.
14. Compare SMC with ordinary price-action descriptions
Several SMC ideas can be translated into observable price-action language: a reference break, a failed breakout, an opposing source candle or a three-bar non-overlap. This translation helps compare models without assuming that a newer label contains more information.
A fair comparison uses the same eligible dates, price feed, execution assumptions and risk budget. Record what an additional structural or zone filter changes. A method that takes fewer trades can appear cleaner while omitting difficult cases; its selected winners cannot stand in for the full original sample.
15. Keep a chronological research record
The downloadable fixture contains six fictional M5 Bid bars, S through E, with UTC open and close times. It reproduces the declared break, the ten-pip source zone, the six-pip FVG, the two-pip overlap, the three-pip partial return and the later close-based failure. It contains no orders, historical Ask candles or performance sample.
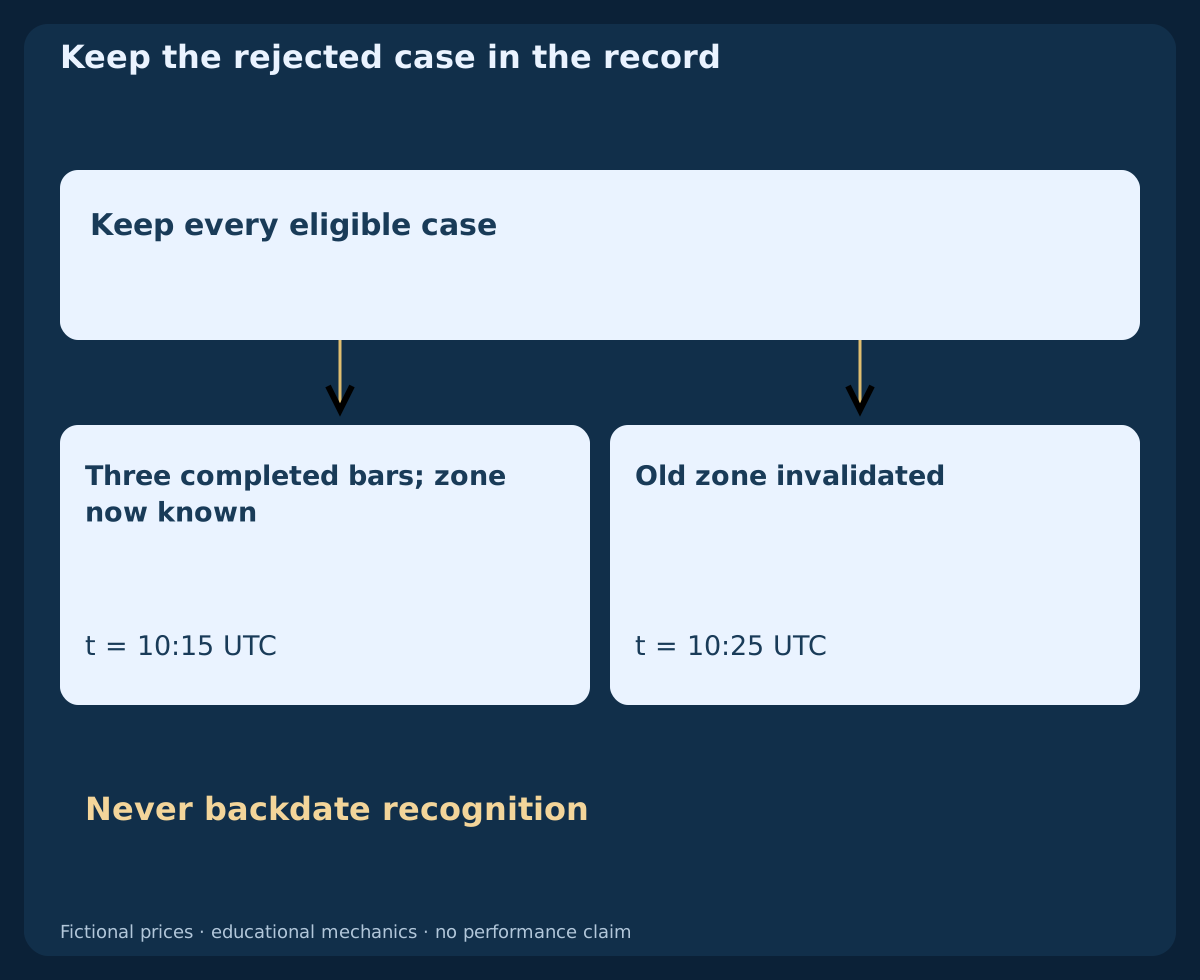
For research, retain the recognition time, original boundaries, expiry, first return, invalidation, usable quote and any actual report. Include zero-width formations, late signals and expired zones. If later candles are needed to recognise a condition, log the observation then. Do not backdate it to make an earlier entry seem possible.
Download the six fictional M5 Bid bars (CSV)
| Bar | Open UTC | Close UTC | Open | High | Low | Close |
|---|---|---|---|---|---|---|
| S | 09:55 | 10:00 | 1.10050 | 1.10080 | 1.09980 | 1.10010 |
| A | 10:00 | 10:05 | 1.10010 | 1.10060 | 1.10000 | 1.10040 |
| B | 10:05 | 10:10 | 1.10040 | 1.10220 | 1.10030 | 1.10200 |
| C | 10:10 | 10:15 | 1.10200 | 1.10240 | 1.10120 | 1.10210 |
| D | 10:15 | 10:20 | 1.10210 | 1.10220 | 1.10090 | 1.10130 |
| E | 10:20 | 10:25 | 1.10130 | 1.10140 | 1.10040 | 1.10050 |
16. Turn one question into a separately testable model
Choose one precise question, such as whether a declared first return after a closed reference break changes outcomes relative to the same unfiltered events. Freeze the definitions before testing, reserve unseen chronological periods and keep rejected cases. Sensitivity to small parameter changes is part of the evidence.
This guide supplies a map of roles and a reproducible price example. A complete strategy still needs independent entry permission, invalidation, protection, exits, exposure limits and uncertain-response handling. The next materials will develop those questions separately. Clear labels and attractive diagrams do not themselves establish profitability.
Frequently asked questions
Does SMC reveal institutional orders?
No. A retail OHLC chart shows price observations from its feed. An institutional explanation is an inference, and a marked order block is not evidence of a bank’s unfilled order.
Are an order block and a fair value gap the same zone?
No. This example uses an opposing candle’s range for the block and a strict three-candle non-overlap for the FVG. Their boundaries and recognition times differ, even when they overlap.
Must a fair value gap be completely filled?
No. Price may return partly, cross the zone, expire under a model’s time rule or never return. A complete fill is not guaranteed by the drawing.
Can I use the FVG at the middle candle’s close?
Not under this three-completed-candle definition. C’s later low is required, so the zone is only knowable after C closes.
Does a liquidity sweep prove that stops were triggered?
No. The supplied OHLC can establish an excursion and reclaim under a chosen rule. It does not identify actual resting orders or their fills.
Is this guide a ready-to-trade SMC strategy?
No. It explains distinct analytical roles, timing and cost mechanics. A complete executable strategy and evidence from realistic unseen data are separate requirements.
Sources and research notes
SMC labels are chart conventions whose boundaries must be declared. Broker documentation establishes quote-side and order mechanics, not the profitability of these patterns.
- CMC Markets: order-block conventions and limitations
- MetaTrader 4: order types, Bid/Ask and protective triggers
Educational price-action guide. Fictional bars and independent cost arithmetic; no actual orders, historical backtest or measured profitability.