

Does ADX strength improve a fresh DI crossover? We froze the rules before replaying January–February 2024 USD/JPY quotes. At a hypothetical 1.2-pip allowance, the ADX≥25 run takes 7 trades and totals −3.616221R; the control takes 13 and totals −7.182880R. The filter reduces the loss in this sample, but neither run demonstrates an edge.
1. The question this replay tests
We compare fresh DI crosses alone with the same crosses requiring ADX(14)≥25. Both independent runs start at index 27, use identical risk and exit rules and allow one position at a time. Periods, threshold, risk, holding cap and cost scenarios were fixed before the first replay. No parameter search was performed.
2. Actual quotes, group boundaries and warm-up
The source has 61 972 original two-decimal USD/JPY minute records from 60 Forexite daily archives. Winter CET is converted to UTC. Timestamps are grouped in (end−4 h,end], ending at 00:00, 04:00, 08:00, 12:00, 16:00 and 20:00 UTC. The 266 observed H4 groups include 17 short or sparse groups; missing quotes are never filled.
The replay uses 61 792 minute records through 2024-02-29 20:00 UTC; the later source-boundary fragment is excluded. DI first exists at index 14 and ADX at index 27. Both runs wait until index 27, even though the control needs no ADX filter. Broker H4 boundaries can differ.
One pip is 0.01 JPY per USD. The original quotes have two decimal places; a broker platform point can follow a different convention.
3. Build DMI and identify a fresh cross
Up = current High−previous High; Down = previous Low−current Low. Keep +DM=Up only if Up>0 and Up>Down; keep −DM=Down only if Down>0 and Down>Up. Otherwise use zero. Equal positive extensions give both zero. TR=max(High−Low, |High−previous Close|, |Low−previous Close|).
At index 14, seed the smoothed TR and DM sums with transitions 1–14. Then S=previous S−previous S/14+new value. +DI=100×smoothed +DM/smoothed TR and −DI likewise. Zero smoothed TR gives both DI values zero. A long requires previous +DI≤−DI and current +DI>−DI; a short reverses the inequalities. Current equality is not a crossing.
+DI = 100 × WilderSum(+DM) / WilderSum(TR)
−DI = 100 × WilderSum(−DM) / WilderSum(TR)
Long: previous +DI ≤ −DI; current +DI > −DI
Short: previous +DI ≥ −DI; current +DI < −DI
Filter: current ADX(14) ≥ 25
4. Apply ADX at the crossover endpoint
DX=100×|+DI−−DI|/(+DI+−DI); a zero denominator gives zero. Seed ADX at index 27 with the mean of DX[14..27], then use (previous ADX×13+current DX)/14. Arithmetic is unrounded; displayed values have six decimals. Scrolling never restarts smoothing. Platform initialization can differ.
The filtered run requires current ADX≥25 for either direction. Equality passes. ADX need not be rising or cross 25 on that group. If strength fails at the DI cross, discard the event; do not enter later merely because ADX rises above 25. No EMA, pullback, price pattern or extreme-point breakout condition is added.
ADX measures smoothed directional imbalance, not bullish direction. A high reading can persist while DI changes sides. The two runs have independent position schedules; a filtered ledger need not be a subset of the control. Match events by signal timestamp, not row number.
5. Enter on the next observed minute and freeze risk
At the signal endpoint, the variant must be flat. Entry is the Open of the first observed minute strictly after that endpoint, at most five minutes later. An older signal is discarded; it is not queued for a later group. A signal occurring while a position is open is rejected even if that position exits in the next minute.
Wilder ATR(14) is seeded at index 14 with mean TR[1..14], then updated as (previous ATR×13+current TR)/14. Initial risk is ceil(1.5×ATR in pips), rounded upward to a whole pip on the original two-decimal grid. Freeze it at the signal endpoint. Place a 1R stop and a 2R target relative to the next-minute Open. No trailing or break-even adjustment is used.
risk_pips = ceil(1.5 × ATR14_pips)
Long: S = E − risk; T = E + 2 × risk
Short: S = E + risk; T = E − 2 × risk
6. Resolve gaps, minute touches and the holding cap
For each observed minute, an Open beyond the stop exits at that Open; an Open through the target exits at the target without favorable gap improvement. Next, if the holding cap is due, exit at Open. Otherwise inspect the minute High and Low: touching a level counts; if both levels occur in the same minute, assume the stop first. Entry-minute touches also count. Stop/target timestamps identify a minute record, not an observed execution second.
The cap is the first observed minute strictly after the sixth H4 endpoint following the signal. Six observed groups can span more than 24 elapsed hours across a market closure. If a position survives the study boundary, close at the last included minute Close and flag sample_end. This sample has no such exits and no both-level minutes. The model has no signal-based exit, scaling or simultaneous positions within a variant.
7. Separate transaction allowance from observed costs
We deduct a hypothetical round-trip allowance once per closed trade: 0.0, 1.2 or 2.4 pips. Net R = (gross pips − allowance pips)/initial risk pips. The journal also permits 0.0–5.0 pips in 0.1 steps. Changing it updates net accounting only; the trades, entry quotes, stop and target remain fixed.
The allowance is not a reconstructed spread or commission. No historical Ask, spread, slippage or broker fills are supplied, and holding financing is excluded. A weekend position could therefore incur an additional unmodeled cost. A live evaluation must supply its own execution and financing data; these results are after the selected transaction allowance, not after every possible trading cost.
8. Read the complete result
At 1.2 pips, the control has 13 trades and 3 positive net outcomes: −394.6 net pips and −7.182880R. The ADX-filtered run has 7 trades and 2 positives: −247.4 net pips and −3.616221R. The smaller loss is descriptive; neither run has positive mean net R.
Filtered profit factor is 0.288799 and maximum closed-trade drawdown is 3.914056R. The sum is already −3.503964R at zero allowance and falls to −3.728478R at 2.4 pips. No target is reached in either run: control exits comprise 8 stops and 5 holding caps; filtered exits comprise 5 stops and 2 caps.
| Rule set | Round-trip transaction allowance (pips) | Closed trades | Trades with positive net R | Net pips | Sum of net R | Profit factor in net R | Maximum closed-trade drawdown (R) |
|---|---|---|---|---|---|---|---|
| Fresh DI cross only | 0.0 | 13 | 3 | -379.0 | -6.886633 | 0.238990 | 7.212215 |
| Fresh DI cross only | 1.2 | 13 | 3 | -394.6 | -7.182880 | 0.226585 | 7.480715 |
| Fresh DI cross only | 2.4 | 13 | 3 | -410.2 | -7.479127 | 0.214799 | 7.749215 |
| Fresh DI cross + ADX≥25 | 0.0 | 7 | 2 | -239.0 | -3.503964 | 0.299207 | 3.829545 |
| Fresh DI cross + ADX≥25 | 1.2 | 7 | 2 | -247.4 | -3.616221 | 0.288799 | 3.914056 |
| Fresh DI cross + ADX≥25 | 2.4 | 7 | 2 | -255.8 | -3.728478 | 0.278731 | 3.998567 |
9. Interpret a smaller loss correctly
Filtering removes some opportunities and changes when each run is busy. Comparing the complete ledgers shows a smaller loss here, not proof that ADX predicts profitable trades. ADX≥25 can coexist with an immediate stop. The first filtered example illustrates that failure.
R divides each trade’s outcome by its own initial stop distance. The table sums closed-trade R without compounding. Profit factor uses positive versus negative net R; drawdown is measured from the cumulative closed-R peak starting at zero. Neither statistic is an account percentage return.
10. Inspect month splits and rejected signals
At 1.2 pips, the filtered run has 5 January-entry trades totaling −2.749510R and 2 February-entry trades totaling −0.866711R. These are descriptions of the same sample, not held-out validation.
There are 23 fresh cross events per run. The filtered run accepts 7, rejects 13 for strength and 3 while busy; the control accepts 13 and rejects 10 while busy. Busy is checked before strength, so a busy event is not counted twice. There are no stale-quote or warm-up rejections among these observed events.
| Entry month | Closed trades | Sum of net R |
|---|---|---|
| 2024-01 | 5 | -2.749510 |
| 2024-02 | 2 | -0.866711 |
11. Follow two examples selected by chronology
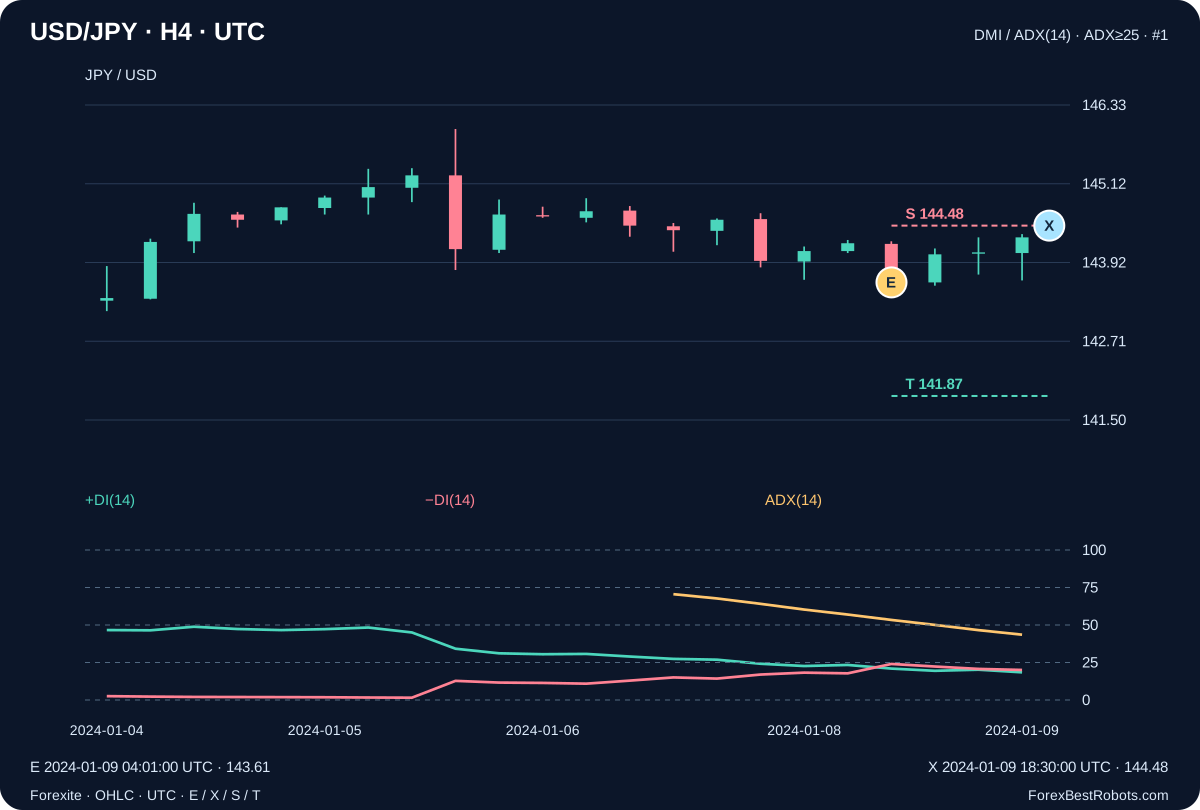
The first filtered trade is a short signaled at 2024-01-09 04:00 UTC. +DI=20.947929, −DI=24.017192 and ADX=53.382941. Entry is 143.61 at 04:01 UTC; ATR=57.446338 pips gives 87-pip risk, stop 144.48 and target 141.87. The stop is touched on 2024-01-09 18:30 UTC: −87 gross pips and −1.013793R after 1.2 pips. High ADX did not prevent a loss.
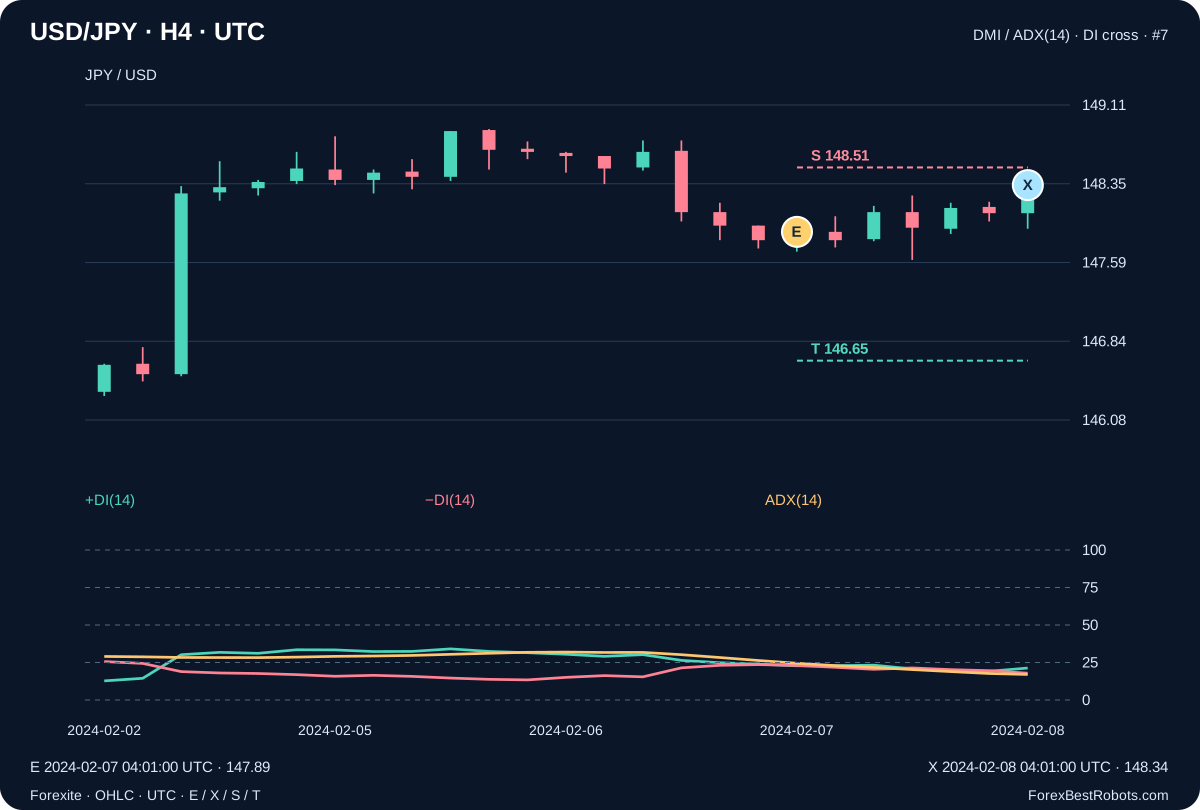
The second chart shows the first accepted control trade whose matching filtered event failed the ADX filter. At 2024-02-07 04:00 UTC, ADX=24.494596. The control shorts 147.89 at 04:01 UTC with 62-pip risk, stop 148.51 and target 146.65. The cap exits at 148.34 on 2024-02-08 04:01 UTC: −45 gross pips and −0.745161R after 1.2 pips. The filtered run has no entry at this event.
12. Inspect every trade and change the transaction allowance
Start with a rule set and an allowance. The totals describe that entire variant; the trade selector and Previous / Next choose one row of its journal. The chart marks that row's fixed E, X, S and T. Changing the allowance recalculates net values and leaves trade selection and model fills unchanged.
The number field changes a hypothetical transaction allowance in pips. It does not move an entry or stop. Use the trade date to identify what you are inspecting. On narrow screens, scroll the chart or journal horizontally; the page itself stays within the screen.
Complete selected variant
- Closed trades
- —
- Trades with positive net R
- —
- Net pips
- —
- Sum of net R
- —
- Profit factor in net R
- —
- Maximum closed-trade drawdown (R)
- —
Selected trade details
- Entry minute record (UTC)
- —
- Exit minute record (UTC)
- —
- Direction
- —
- Entry quote
- —
- Exit quote
- —
- Fixed stop: S
- —
- Fixed target: T
- —
- Initial risk (pips)
- —
- Exit rule
- —
- Gross pips
- —
- Selected trade: net R
- —
Show the signal, minute record and net-R calculation
- Completed signal-group end (UTC)
- —
- Previous +DI(14)
- —
- Previous −DI(14)
- —
- Signal +DI(14)
- —
- Signal −DI(14)
- —
- Signal DX(14)
- —
- Signal ADX(14)
- —
- Signal-group Close
- —
- Signal ATR(14), pips
- —
- Up movement (pips)
- —
- Down movement (pips)
- —
- Signal TR (pips)
- —
- Signal +DM (pips)
- —
- Signal −DM (pips)
- —
- Wilder TR sum (pips)
- —
- Wilder +DM sum (pips)
- —
- Wilder −DM sum (pips)
- —
- Sixth following H4 endpoint (UTC)
- —
- Exit-minute quote OHLC
- —
Net-R calculation
Show every trade in this variant
| Trade number | Direction | Entry minute record (UTC) | Exit minute record (UTC) | Exit rule | Gross pips | Selected trade: net R |
|---|
13. What remains unproven
A separate Decimal70 calculation and causal minute ledger agree on all decisions and 20 trades across the two runs. This checks implementation, not trading merit. More periods, other feeds, observed execution and financing, realistic sizing and a separate forward test are needed. Retuning this sample and calling it independent validation would be misleading.
Frequently asked questions
Did ADX≥25 make this strategy profitable?
No. At 1.2 pips the filtered 7 trades total −3.616221R; control 13 trades total −7.182880R. A smaller loss in one sample does not establish an edge.
Can I enter when ADX later rises above 25?
Not under these frozen rules. ADX is checked at the fresh DI cross only. A rejected event is discarded; a later ADX rise alone creates no entry.
Does changing the allowance rerun entries?
No. It changes only the net accounting of the same recorded trades. The base comparisons use 0.0, 1.2 and 2.4 pips; historical spread and financing are not reconstructed.
Are the displayed exit times exact broker fills?
No. Stop/target times identify the source minute record. The model handles gaps and assumes stop first if both levels occur in one minute. Its quotes do not reveal tick order or actual broker execution.
Data, timing and reproducibility
The download preserves 61 972 original two-decimal USD/JPY minute records and provenance for 60 Forexite archives, including URLs and original hashes. This release checked 13 saved source-kit hashes and replayed its unchanged CSV. The 60 original daily ZIPs were not downloaded again.
The replay uses 61 792 minute records through 2024-02-29 20:00 UTC, forming 266 H4 groups including 17 short or sparse groups. Signals, rejection reasons, both ledgers, fixed protocol and indicator history are included. No historical Ask or spread is claimed.
The rules were frozen before the first replay. The ZIP includes offline reproduction and a separate Decimal70 minute ledger. The CSV lists all 20 trades from two independent runs, not a combined portfolio or a broker statement.
- All trades from both variants (CSV)
- Minute quotes, fixed rules, signals and offline reproduction (ZIP)