

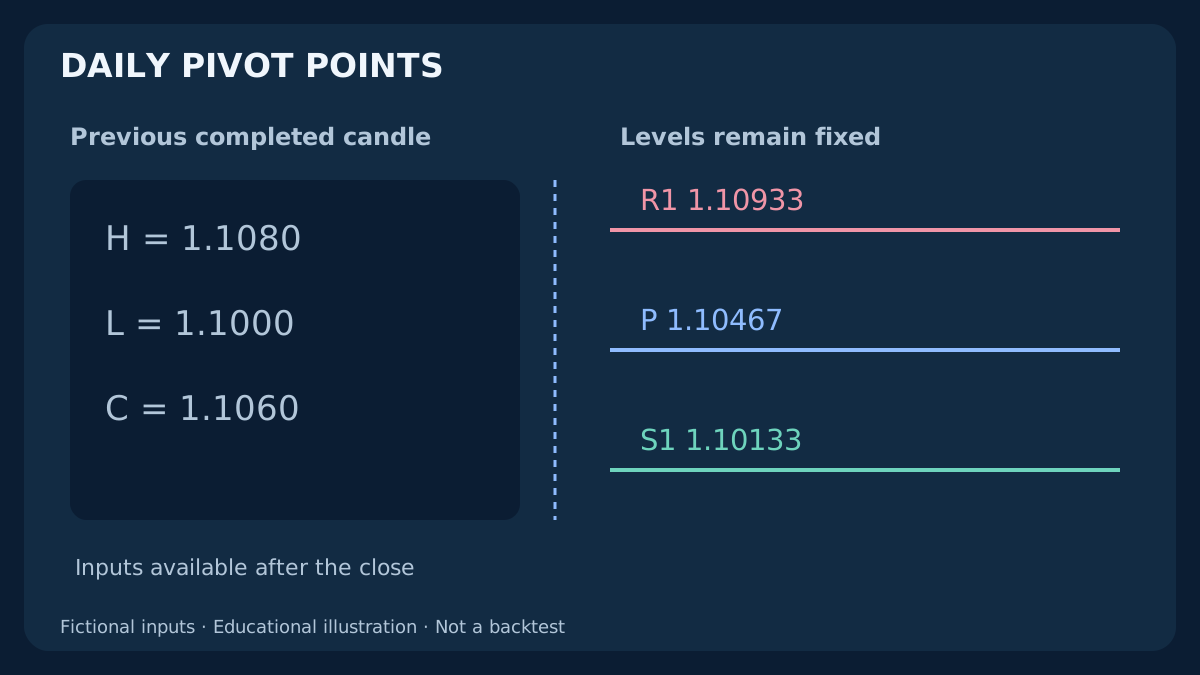
Two traders can select daily pivot points on EUR/USD and still see different prices. They may be using different formulas, different daily closing times or different source candles. Before interpreting a reaction, make the calculation reproducible. This guide follows a completed daily candle through the formulas, timezone checks and executable BUY/SELL prices. All prices are fictional teaching examples; no trading edge or historical performance is claimed.
1. What a pivot point is — and what it does not tell you
A pivot point is a calculated price reference. In the Traditional method, the central pivot P is the average of the previous reference period’s high H, low L and close C. Additional support levels S1, S2 and S3 and resistance levels R1, R2 and R3 are derived from those inputs. These labels describe a formula family, not a promise that price must reverse or reach the next line.
A daily pivot uses a completed daily reference period. It can be displayed on M5, M15 or H1 without becoming a five-minute or hourly pivot. A weekly pivot uses the previous completed week; a monthly pivot uses the previous completed month. The display timeframe and calculation timeframe are separate choices. An indicator’s Auto setting may change the reference period when the chart timeframe changes.
Calculated pivots differ from manually selected swing levels. Several traders can reproduce a pivot if their formula, input data and period boundaries match. That reproducibility does not establish predictive value. Compare the calculated levels with price structure, costs and a predefined observation rule; do not interpret a dense cluster of indicator lines as several independent confirmations.
For fixed round-number grids and timed reaction labels, see the guide to psychological Forex levels and false breakouts.
2. Declare the input candle before calculating anything
Record the exact symbol, broker or data feed, price side, reference timeframe, formula name and session boundary. EURUSD and a suffixed broker symbol may have different histories. A standard MT4 Forex chart is based on Bid prices. Its current Ask line does not reconstruct historical Ask highs, lows or closes, and a third-party feed may use another convention.
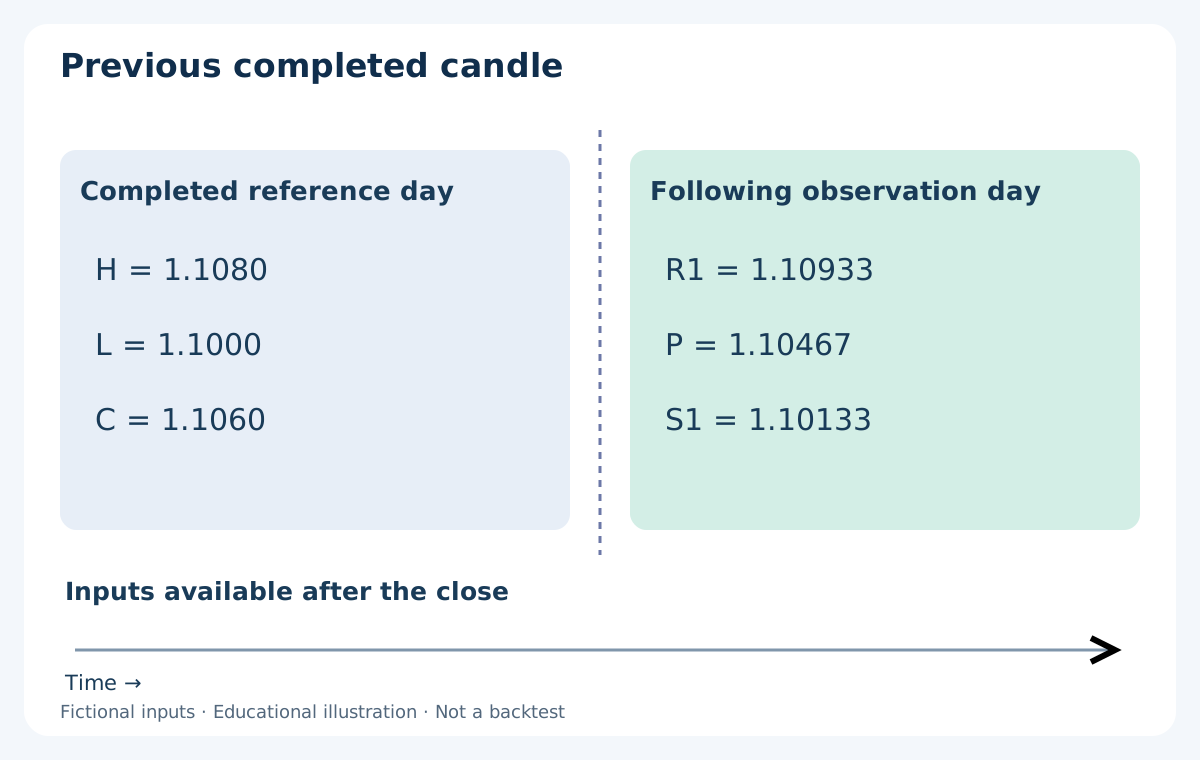
For this guide, the reference is the last completed D1 Bid candle on one declared broker feed. Its fictional inputs are H = 1.1080, L = 1.1000 and C = 1.1060. The range H − L is 0.0080, or 80 EUR/USD pips. These inputs belong to the earlier completed day; the levels are used only during the following calculation period.
Validate that L ≤ C ≤ H, that H ≥ L and that the candle exists in a continuous, usable history. Do not replace a missing daily candle with zeros. A weekend stub, holiday-shortened period or newly listed symbol needs an explicit handling policy. The sessions and time zones guide explains why a calendar label alone is not enough to identify a trading window.
3. Traditional pivot formulas: use one consistent definition
Let D = H − L. Calculate P = (H + L + C) / 3, then R1 = 2P − L and S1 = 2P − H. The second levels are R2 = P + D and S2 = P − D. Keep full precision during the calculation. A rounded P should not become the input to the next formula unless that rounding convention is explicitly part of the implementation being reproduced.
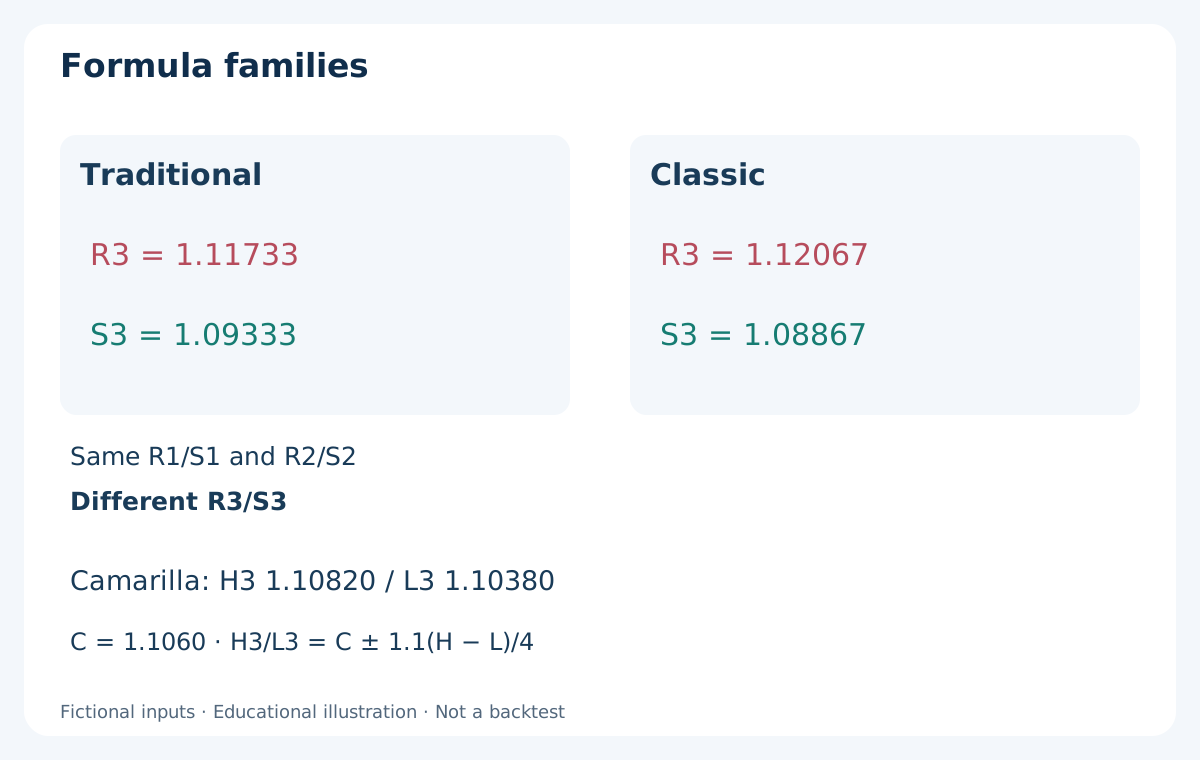
For the Traditional definition used here, R3 = H + 2(P − L) and S3 = L − 2(H − P). Some platforms use the name Classic for a different third-level formula: R3 = P + 2D and S3 = P − 2D. The two definitions agree through R2/S2 but can disagree at R3/S3. Compare the actual equations rather than relying on an indicator’s name.
P is not generally the midpoint of H and L; C affects it. R1 can lie above the previous high, and S1 can lie inside the previous range. A new period can also open beyond R1 or S1. None of these situations is a calculation error. The order in which market price meets the levels depends on the opening price and subsequent path.
4. A complete EUR/USD calculation, with unrounded inputs
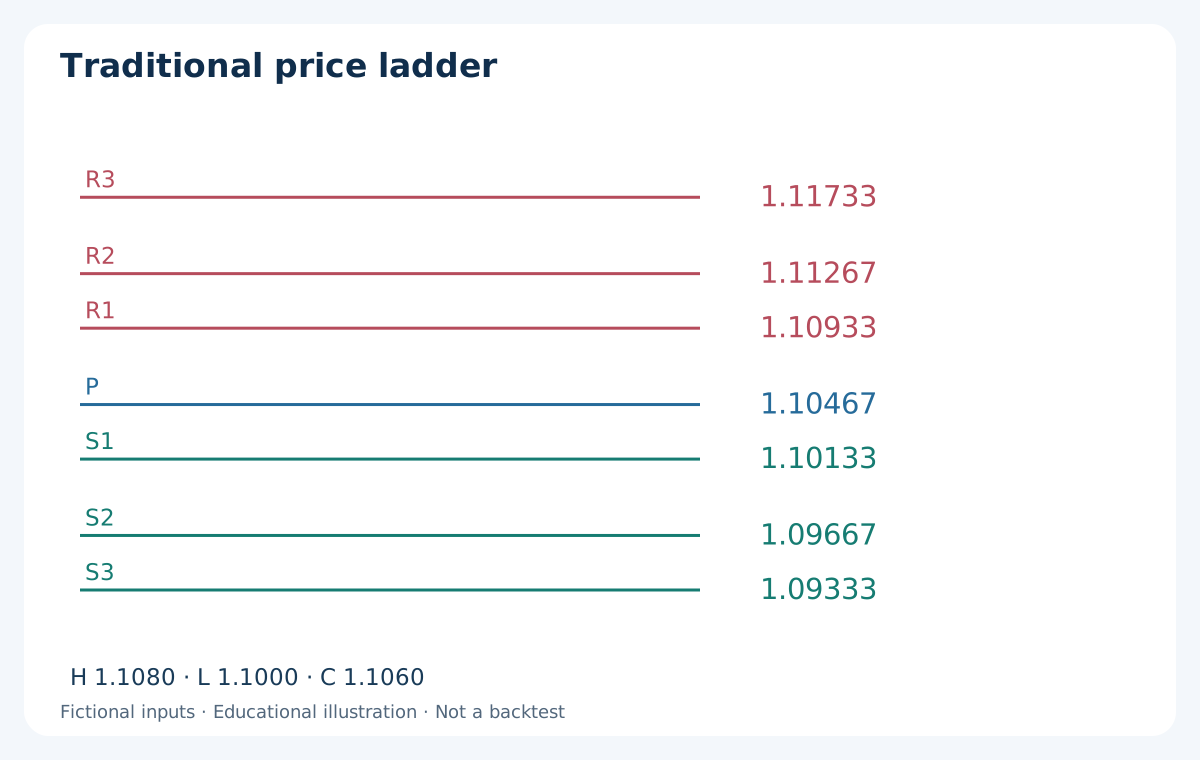
Using H = 1.1080, L = 1.1000 and C = 1.1060 gives P = 3.3140 / 3 = 1.104666… . On a five-decimal display, show 1.10467. Compute R1 from the unrounded P: 2 × 1.104666… − 1.1000 = 1.109333… , displayed as 1.10933. S1 is 1.101333… , displayed as 1.10133.
R2 is 1.112666… → 1.11267 and S2 is 1.096666… → 1.09667. Traditional R3 is 1.117333… → 1.11733; Traditional S3 is 1.093333… → 1.09333. Under the alternative Classic third-level equations, R3 becomes 1.120666… → 1.12067 and S3 becomes 1.088666… → 1.08867. Mixing these third levels with a differently named preset can create a false discrepancy.
The ladder in the diagram is a price scale, not a time path or forecast. Its numbers are rounded for display only. When checking an indicator, export or record its inputs and compare values at a declared tolerance. A one-point display difference should be investigated as a precision issue before it is treated as evidence of a different market signal.
5. Fibonacci, Camarilla, Woodie and DM are different calculations
Fibonacci pivots retain P = (H + L + C) / 3 and place the first three levels at P ± 0.382D, P ± 0.618D and P ± D. With our inputs, R1/S1 are 1.10772 / 1.10161 and R2/S2 are 1.10961 / 1.09972 after five-decimal rounding. These are multipliers applied to a past range; they are not probabilities.
Camarilla’s commonly labelled H3/L3 are C ± 1.1D / 4, and H4/L4 are C ± 1.1D / 2. Here H3 = 1.10820, L3 = 1.10380, H4 = 1.11040 and L4 = 1.10160. H3 corresponds to an upper resistance label, often R3; L3 corresponds to a lower support label, often S3. The H and L in those labels are not additional input candle highs and lows. These bands are centred on C, not on P.
The TradingView Woodie definition uses the current period’s open together with the previous high and low: P = (H + L + 2 × current open) / 4. DM, also called DeMark in some interfaces, requires the previous open and compares it with the previous close. These methods therefore need more information than our H/L/C example. Do not fill the missing open with C or treat all presets as interchangeable. Record the platform-specific definition and its availability time.
| Method | Input or centre | Difference to verify |
|---|---|---|
| Traditional | Previous H, L, C | R3 = H + 2(P − L) |
| Classic | Previous H, L, C | R3 = P + 2(H − L) |
| Fibonacci | P and previous range | 0.382 / 0.618 / 1.000 |
| Camarilla | Previous C and range | H3/L3: C ± 1.1D / 4 |
| Woodie / DM | An open is also required | Verify the specific implementation |
6. Why the daily closing time changes the levels
A daily high, low and close are measurements over a particular time window. Changing that window can change all three. A broker’s midnight and 00:00 UTC need not mark the same instant. A daily-based feed can also differ from a daily candle assembled from the intraday bars currently loaded on the chart. First compare exact UTC start and end timestamps, then compare OHLC values.
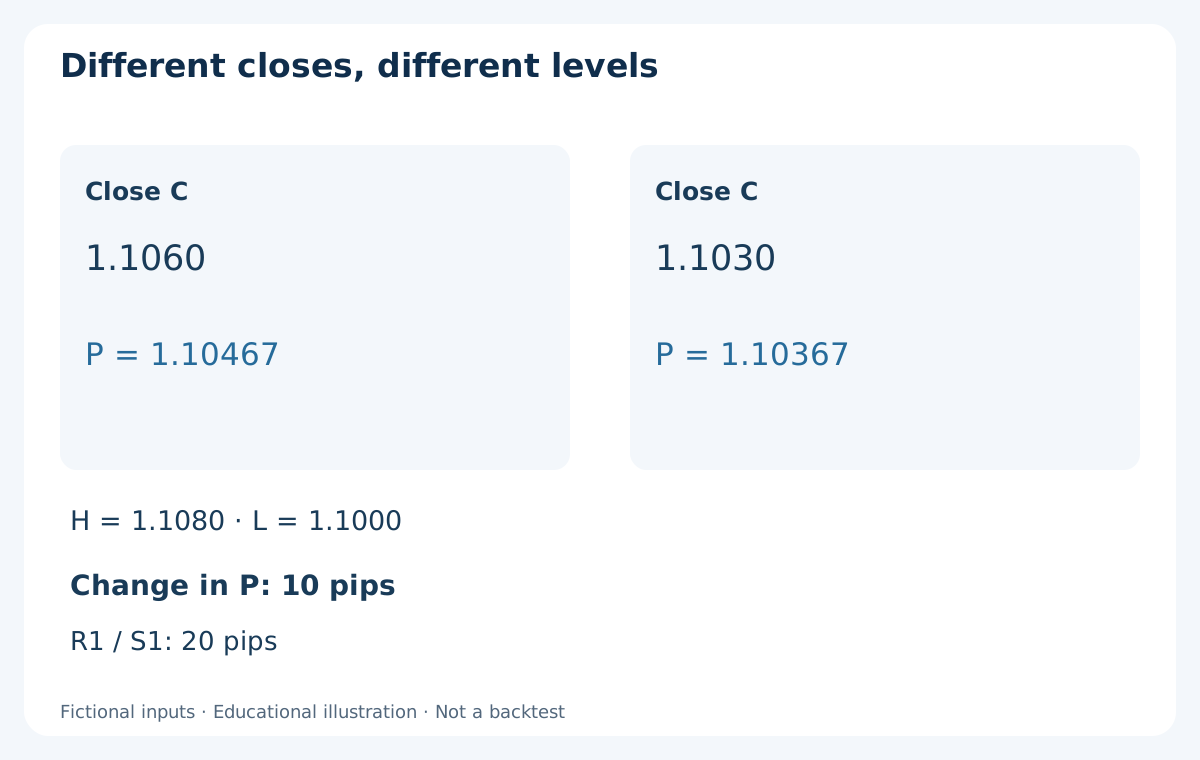
To isolate one effect, keep H = 1.1080 and L = 1.1000 but change the fictional close from 1.1060 to 1.1030. The second P is 1.103666… , or 1.10367. The central pivot moves down 10 pips; R1 and S1 each move down 20 pips because their formulas contain 2P. This is an arithmetic illustration with invented inputs, not a claim about two actual broker candles. In real data, H and L may change too.
A disagreement between two pivot indicators is not automatically a broken indicator. Check, in order: symbol and feed; calculation timeframe; session cut-off and historical offset; completed versus current candle; daily-based versus intraday source; formula family; rounding. Changing the session boundary after seeing which levels worked introduces a selection bias.
7. Broker time, New York close and daylight saving
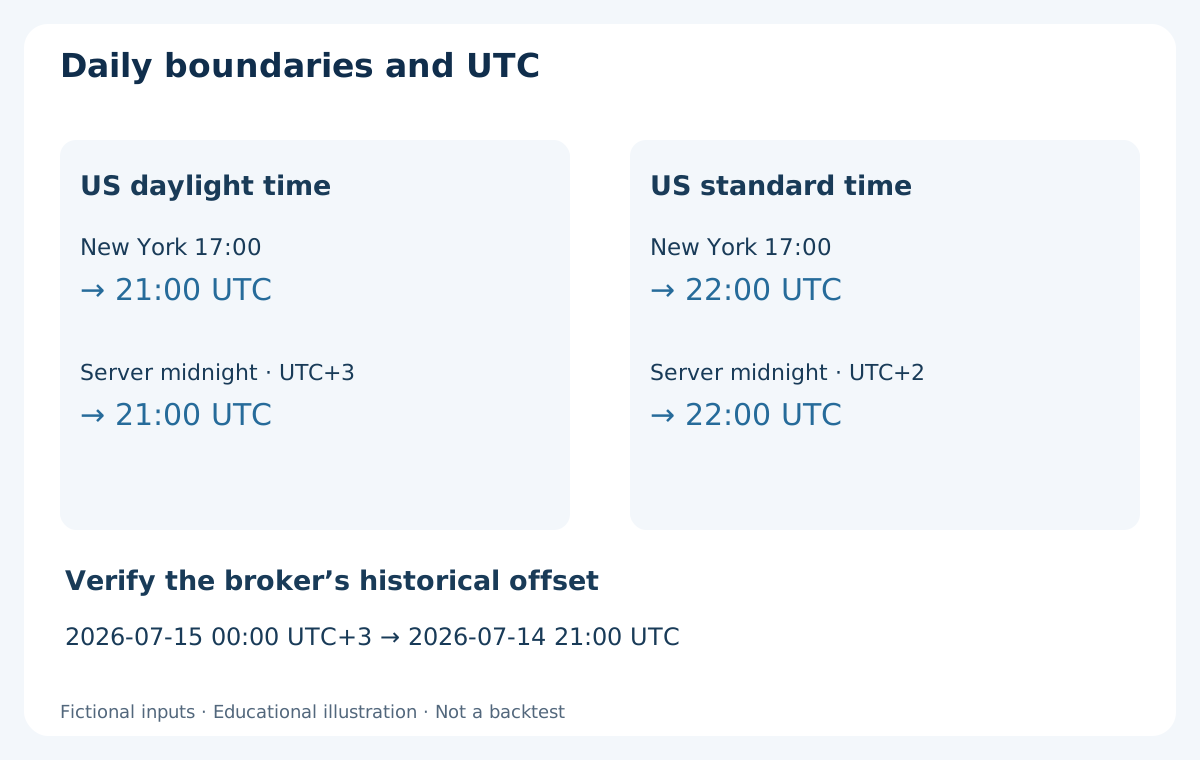
At a UTC+3 server offset, server midnight corresponds to 21:00 UTC on the preceding UTC date. At UTC+2 it corresponds to 22:00 UTC on the preceding date. Separately, 17:00 in America/New_York corresponds to 21:00 UTC during US daylight time and 22:00 UTC during US standard time. These conversions explain common schedules; they do not establish which schedule your broker follows.
Do not hard-code “New York close = 22:00 UTC” for every historical date. Use a date-aware timezone conversion, then compare it with the broker’s documented historical server offsets. A broker may follow a different daylight-saving policy or use a constant offset. The weeks when regional clock changes do not align deserve explicit checks. The local computer clock is not an authoritative record of a broker’s historical calendar.
For a repeatable daily calculation, store the reference candle’s start and end in UTC as well as its server-time label. Decide in advance whether a short Sunday candle is accepted as the last completed D1 bar or merged under a defined session calendar. Using the last five full trading sessions is a different policy from blindly taking the preceding five calendar dates. Never silently delete or merge a candle to improve a historical result.
8. Check the calculation in MT4 without using future data
On standard desktop MT4, pivot points may require an installed custom indicator or manually drawn horizontal lines; do not assume a built-in Pivot Points menu exists. Inspect the indicator’s inputs for method, reference timeframe, session adjustment and source data. Take a screenshot and record the actual values before comparing reactions. A chart template can carry old settings that are not obvious from the line labels.
In MQL4 timeseries, shift 0 denotes the unfinished current candle and shift 1 the preceding candle. For our daily Traditional method, read D1 high, low and close from the same shift 1 candle, after confirming that the history is available and valid. A missing iHigh value can return zero. Validate the data and error state before calculation; a plausible-looking line produced from incomplete history is not usable.
Freeze the levels for the declared new daily period once the previous candle is complete and its data are available. The first actionable quote may arrive after the nominal boundary. A backtest cannot fill an order at midnight merely because the final daily candle is visible later. Woodie’s current-open input has its own availability requirement. The final close of the current day must never be used to trade earlier within that day.
9. Rounding, points, ticks and the quote side
For five-decimal EUR/USD, a point is 0.00001 and the conventional pip is 0.0001. A displayed five-decimal price is not automatically the instrument’s valid order-price grid. Check the symbol’s minimum price increment. In MQL4 MarketInfo, MODE_TICKSIZE is expressed in points; multiplying it by MODE_POINT gives a price distance. Do not import the units of a different API without checking its specification.
Our raw R1 is 1.109333… . A display of 1.10933 is below that exact number. If the allowed grid is 0.00001, the first grid price above raw R1 is 1.10934. A rule using greater than or equal to the displayed line can differ from a rule using the raw level. Record the comparison operator and precision. Broker stop-distance, freeze-level and order restrictions are separate checks.
Specify whether a test uses Bid, Ask or another price source. A Buy Stop normally triggers on Ask and can activate while a Bid candle is still below a pivot. A closed Bid candle beyond R1 is a different condition. A chart touch does not prove an order could be entered, filled or exited at that line. See market, limit and stop orders for the execution distinctions.
10. BUY illustration: a pivot is context, not an execution price
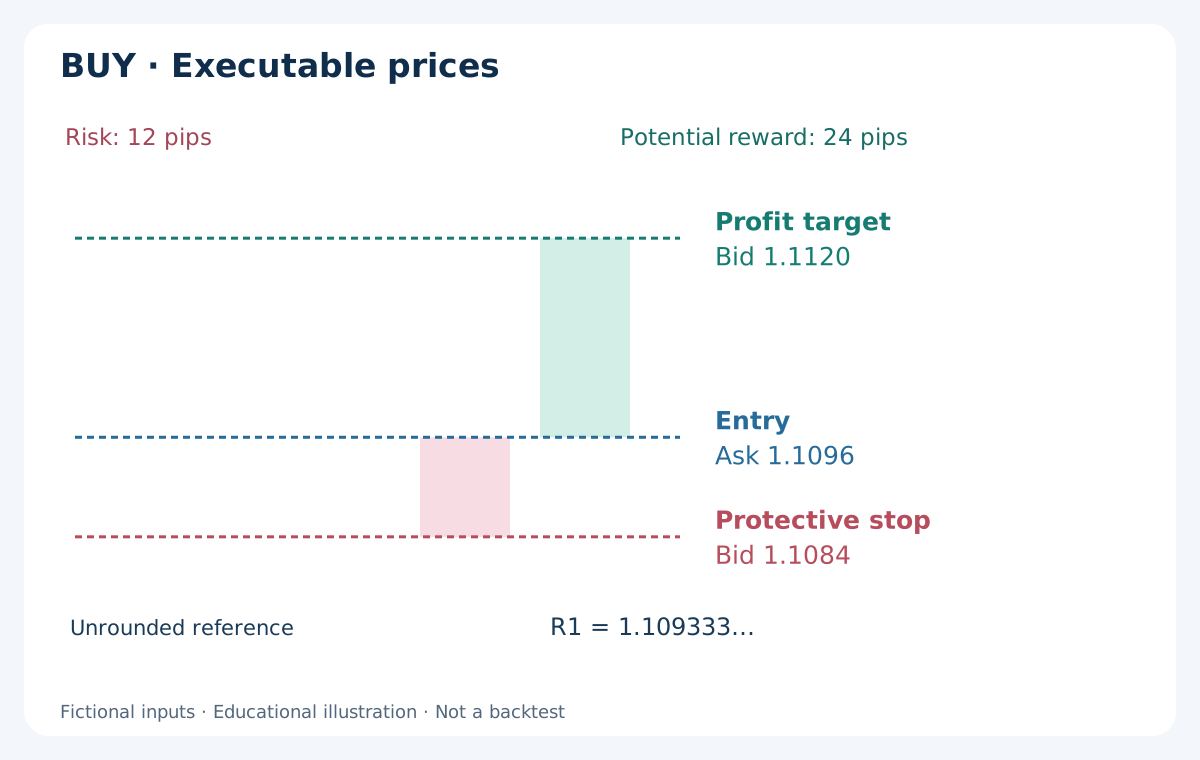
Suppose a declared observation rule waits for a completed Bid candle strictly above the unrounded R1 of 1.109333… . Only after that close, a new executable quote is Bid 1.1094 / Ask 1.1096. A hypothetical market BUY fills at Ask 1.1096. This example assumes that fill; a real fill can differ. The earlier candle’s close is neither the entry quote nor permission to backdate an order.
For illustration, choose a protective exit at Bid 1.1084 and a profit exit at Bid 1.1120, below R2 = 1.112666… . The executable distances are 12 pips of loss and 24 pips of gross gain. Both long exits use Bid. The stop and target are separately declared teaching prices, not distances prescribed by the pivot formula. A later move to R2 is not guaranteed.
The diagram shows a target above entry and a stop below entry. It does not show a successful trade or a tested entry framework. A spread increase can alter the next Ask entry and achievable reward-to-risk ratio. If the actual quote makes the remaining room too small under your prewritten limits, the appropriate recorded outcome is no trade.
11. SELL illustration: do not read Ask exits from Bid candles
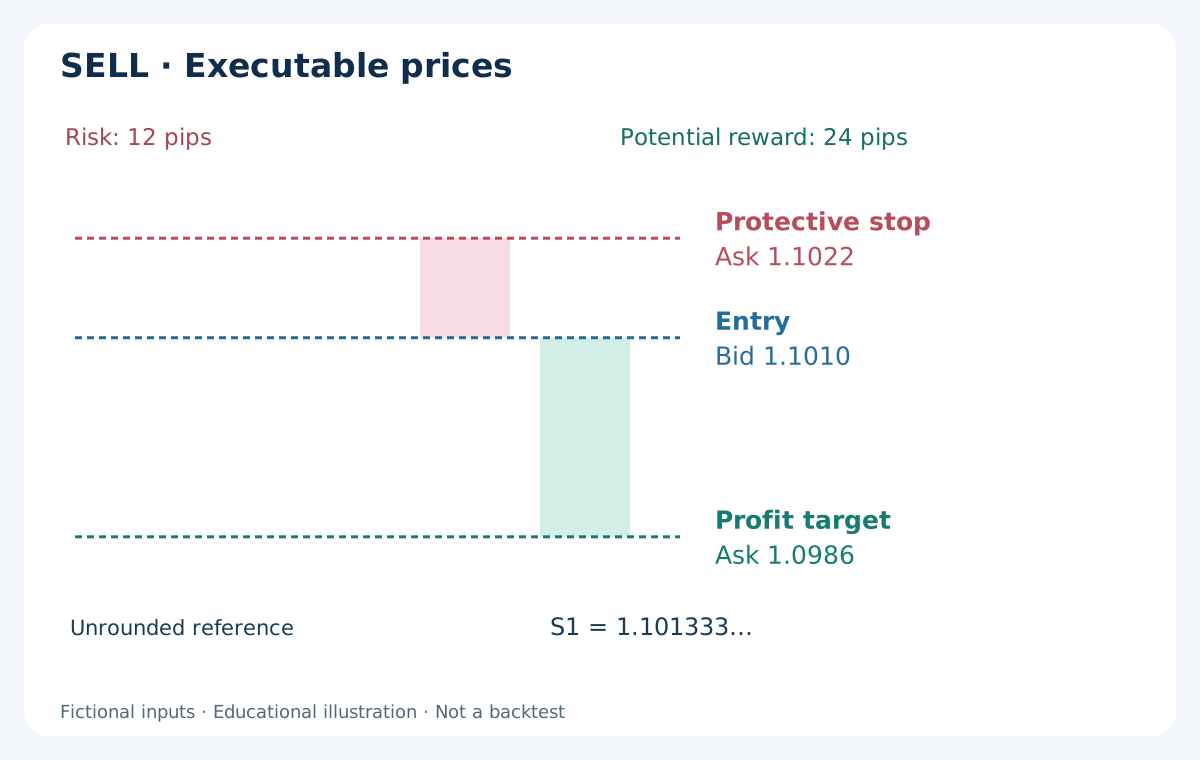
In an independent example, a completed Bid candle closes strictly below raw S1 = 1.101333… . The subsequent quote is Bid 1.1010 / Ask 1.1012, and the hypothetical market SELL fills at Bid 1.1010. The protective exit is Ask 1.1022 and the profit exit is Ask 1.0986, above S2 = 1.096666… . This gives the same 12-pip loss distance and 24-pip gross gain distance.
For a short position, the stop is above entry and the profit target below it. Both exits use Ask. At a constant illustrative spread of 2 pips, those Ask prices correspond to Bid 1.1020 and Bid 1.0984. That conversion is an assumption for the illustration, not a fixed relationship when spreads vary. A historical Bid low touching 1.0986 does not prove the Ask profit exit was available.
A rejection of S1 and a close below S1 are different observations and can support different research rules. Keep them in separate logs. Do not turn a failed breakout into a bounce trade after seeing the outcome, or reuse the same candle to claim a fill before confirmation. For reproducible swing-based boundaries, compare the support and resistance drawing guide.
12. Costs and position size belong to the trade, not the indicator
Assume EUR/USD, a USD account, a 100,000 EUR standard lot and a position of 0.10 lot. One pip is then about USD 1 for this instrument and account setup. A USD 0.70 round-trip commission changes the illustrated USD 12 gross loss to USD 12.70 and the USD 24 gross gain to USD 23.30, before any swap or further execution difference. The net reward-to-risk ratio is about 1.83, not 2.
Spread is already reflected in the executable entry and exit prices used above. Do not subtract it again from those same price distances. If a study starts from chart prices instead, it must model the missing quote side and costs consistently. Account-currency conversion, contract specifications and swap can change the monetary result. A USD quote currency does not mean every account is denominated in USD.
Size the position from the chosen protective distance and an explicit monetary risk budget, including your cost and slippage assumptions. Round volume down to the broker’s lot step and reject a trade if the minimum permitted lot exceeds the budget. A pivot level does not determine a safe lot size, and a stop does not cap losses during gaps or poor execution. Use the stop-loss and reward-to-risk guide for the sizing workflow.
13. Validate a pivot hypothesis without selecting the winning settings
Turn a visual idea into a testable statement before inspecting outcomes: which formula and session calendar, which candle establishes a touch or close, when an order may be sent, where exits are placed and when a setup expires. Define missing-data, weekend and spread filters in advance. A daily pivot alone is not a complete strategy and a close beyond R1 alone is not evidence of an edge.
Use chronological development, out-of-sample and forward observation periods. Include commissions, realistic variable spreads, slippage assumptions and the correct Bid/Ask sides. Save failed and skipped setups as well as completed trades. Compare results across reasonable predeclared calendar and cost assumptions; do not search dozens of cut-offs and publish only the best one without accounting for that search.
For auditability, retain the reference OHLC, UTC boundaries, formula version, full-precision calculated levels, displayed values, signal timestamp and subsequent executable quote. Recalculate a sample independently and test a daylight-saving transition plus a weekend boundary. The MT4 backtesting guide explains why a clean report is insufficient when the inputs or timing cannot be reproduced.
14. A compact daily preparation checklist
Before the session, confirm that the reference candle is complete, valid and from the intended feed. Verify its UTC start and end, the formula family and the calculation timeframe. Recalculate P and one resistance/support pair. Note nearby swing zones without moving the pivot to fit them. Fix a policy for overlapping levels instead of counting each line as another vote.
During observation, keep the saved daily levels fixed. Record price behaviour and the quote side before deciding whether a predefined condition occurred. Check spread, available room, monetary risk and broker restrictions at the actual decision time. If one requirement fails, log the reason for skipping. Do not redraw the past when the next daily set becomes available.
After the period, compare the saved inputs and levels with the log and order history. Separate calculation errors, timezone errors, execution differences and ordinary losing outcomes. Accurate arithmetic makes an experiment interpretable; it cannot make the market obey the lines. Start with a reproducible daily reference before adding weekly levels, more formulas or automated rules.
Frequently asked questions
What is the daily pivot point formula?
For the Traditional definition in this guide, P = (H + L + C) / 3 using the previous completed daily candle. R1 = 2P − L and S1 = 2P − H. Other formula families and third-level definitions differ, so record the actual equations and the session boundary.
Why do my broker and another platform show different pivots?
Compare the symbol, price feed, reference timeframe, daily cut-off, historical daylight-saving offset, source candle and formula. A daily-based feed can differ from intraday aggregation. Rounding may explain a small difference. Neither platform is automatically wrong merely because the displayed values disagree.
Do daily pivot points change during the day?
Traditional daily levels calculated from one fixed, completed previous daily candle should remain fixed for the new daily period, unless the provider corrects that history. An indicator using the current unfinished candle or an automatically changing reference timeframe can move. Such behaviour must be identified before testing.
Are Classic and Traditional pivot points identical?
Not necessarily. The definitions compared here share P, R1/S1 and R2/S2, but Traditional R3 = H + 2(P − L), while Classic R3 = P + 2(H − L); their S3 formulas also differ. Platform naming is not universal. Check the implementation instead of assuming the labels guarantee identical levels.
Can I trade pivot points directly on MT4?
You can display calculated levels with horizontal objects or a suitable installed indicator, then define and test a separate execution rule. Standard MT4 does not imply a built-in Pivot Points preset. Confirm input data, method, period and Bid/Ask execution; a visible line is not an order or a verified strategy.
Which pivot method is most profitable?
This guide does not establish that any method is profitable. A fair comparison requires complete rules, identical eligible data, realistic costs and chronological out-of-sample and forward checks. Selecting a formula or daily closing time after seeing the best historical result overstates the evidence.
Sources and calculation notes
Formula definitions and platform behaviour were checked against primary documentation. The numerical examples, comparisons and diagrams are original educational constructions, not observed trades or backtests.
Educational content. All diagram prices and trade examples are fictional. Forex trading involves risk; stops do not guarantee a maximum loss.