

MACD and RSI can describe the same price move in different ways. Their agreement can be useful to investigate, but two agreeing indicators do not prove that a trade has an advantage. This guide separates what each reading measures, when a fresh event occurs and what an added condition changes. A fully specified fictional H1 series lets you check the arithmetic instead of trusting a polished chart.
1. Start with the question the combination must answer
MACD relates a faster price average to a slower one. RSI compares smoothed gains with smoothed losses. A trader might ask whether a change in the first relationship also meets a chosen momentum condition in the second. Write that question before selecting a convincing example. Direction, an entry event and a decision to stay out are separate jobs; an oscillator reading does not supply all three automatically.
The useful starting point is a declared comparison, not a claim about the best indicator combination. This guide uses an observation rule so its timing can be inspected without inventing trade results. A complete strategy would additionally need price context, entry execution, protection, exits, position sizing and exposure limits. Those choices remain consequential even when both indicators point the same way.
Continue with the EMA, ADX and ATR guide to direction, strength and risk for a reproducible comparison of distinct indicator roles, conflicting states and volatility-based position sizing.
2. Set up matching MT4 inputs before comparing screens
For the usual reference settings, specify MACD 12/26/9 and RSI 14 on the same symbol, H1 timeframe and Close input. In native MT4, the MACD signal is an SMA of the main series. A platform or custom indicator using an EMA signal can give different crossings with the same displayed periods. Record the actual implementation, quote feed and candle boundaries; a familiar indicator name is insufficient to reproduce an observation.
Use the Data Window to identify the values you are comparing. In MQL4, MODE_MAIN and MODE_SIGNAL identify separate MACD series, while PRICE_CLOSE fixes the applied price. Keep the symbol and timeframe explicit in both calls. Check history availability and initialization before reading a value as valid. The defaults are a reference for this lesson, not settings shown to be optimal for every pair or trading horizon.
3. Distinguish the MACD main, signal and difference
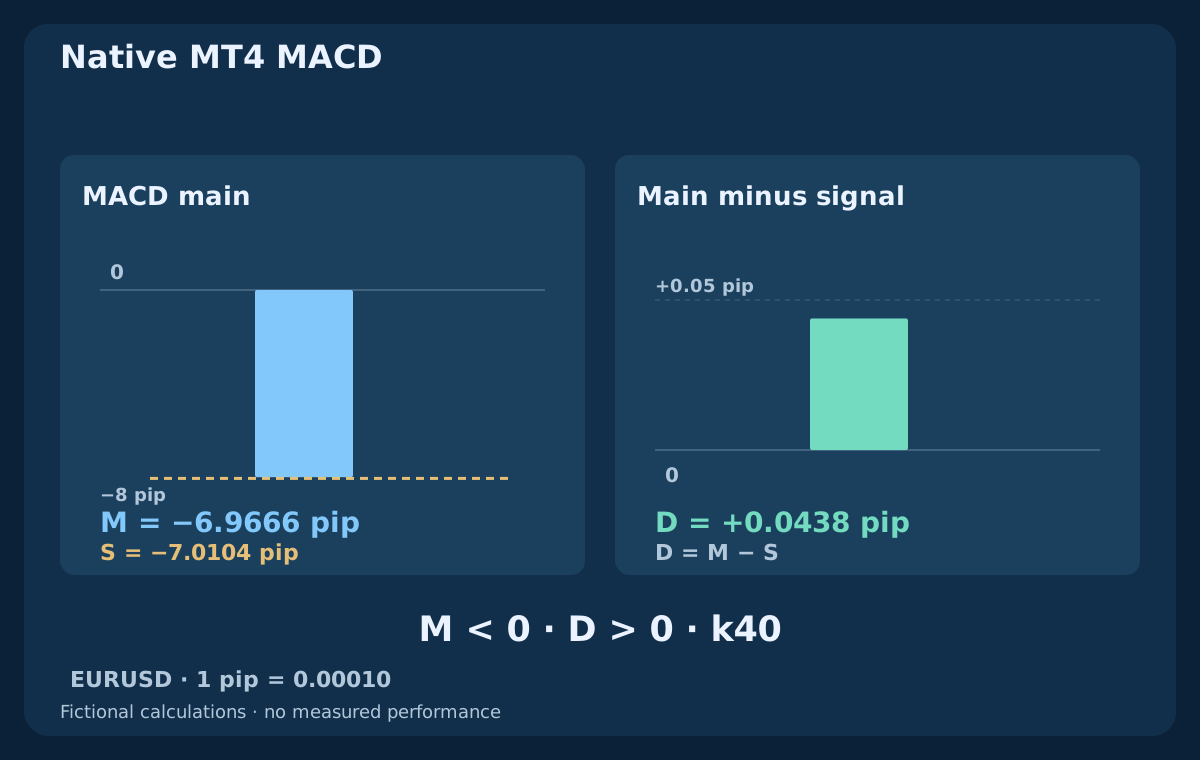
Let M = EMA(Close,12) − EMA(Close,26) and S = SMA(M,9). Native MT4 draws M as bars and S as a signal line. Many other displays draw two lines plus bars for D = M − S. These are different bar series. A positive native main bar means M is above zero; a positive difference bar means M is above S. One statement can be true while the other is false.
The sign of M describes the ordering of the two averages. The sign of D describes the ordering of main and signal. A rising negative M remains below zero; a rising D can still be negative. Keep those comparisons separate in notes, diagrams and code. M, S and D are in price units, so a raw value cannot be compared across instruments as if it were a universal strength score. The table names each series before any crossing rule is introduced.
| Series | Declared definition | Interpretation |
|---|---|---|
| M | EMA(Close,12) − EMA(Close,26) | Price-unit difference of two EMAs; native MT4 bars |
| S | SMA(M,9) | Nine-value simple average of valid main readings |
| D | M − S | Distance between main and signal; a separate bar display |
| R | RSI(Close,14) | Bounded gain/loss transformation, not a price-unit value |
4. Read RSI as a bounded transformation, not a command
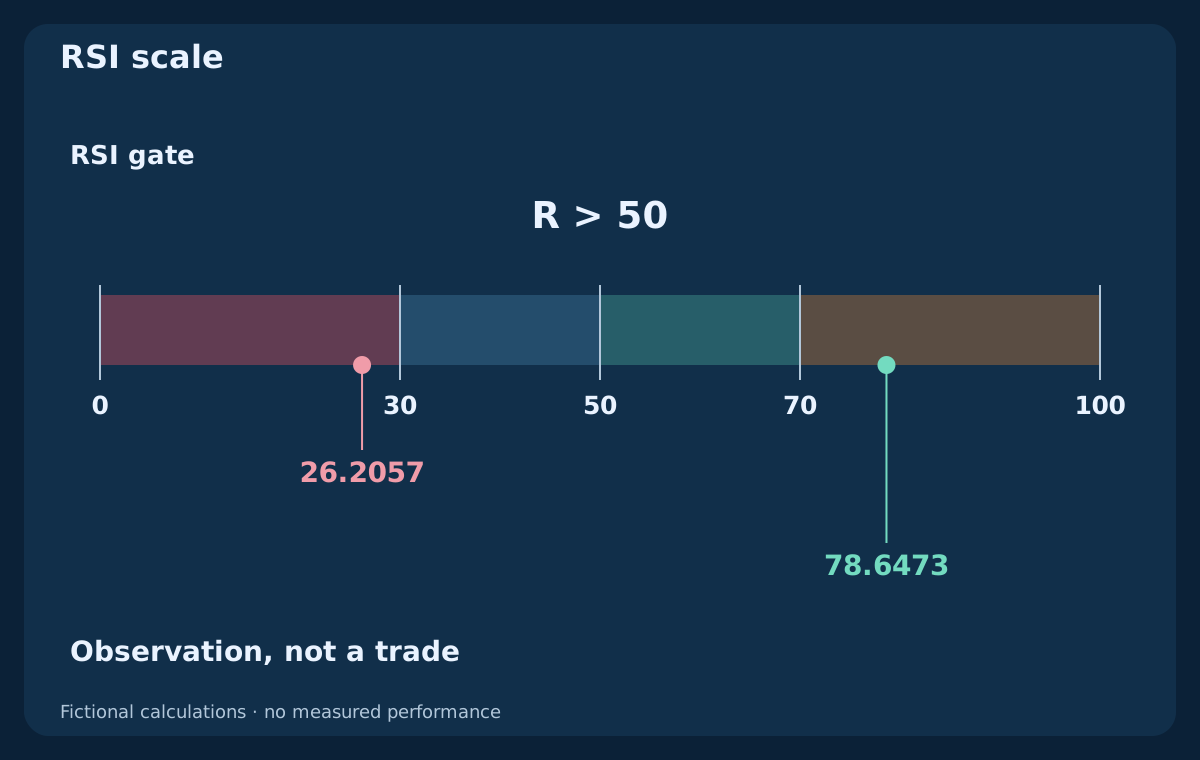
RSI 14 is commonly expressed as R = 100 − 100 / (1 + G/L), where G and L are smoothed average gains and loss magnitudes. Its scale is 0–100. Levels 30, 50 and 70 describe different reference questions: an extreme, a midpoint and another extreme. A value above 50 does not establish a price uptrend by itself, and a value above 70 is not an instruction to sell immediately.
During persistent buying pressure, RSI can stay high while price continues rising. In a decline it can stay low while a supposed bargain becomes cheaper. The formula is undefined if both gain and loss averages are zero unless an implementation supplies a convention. If only L is zero and G is positive, the limiting reading is 100. State the platform's convention and skip unavailable data instead of manufacturing a crossing from an assumed zero.
5. Understand why agreement is not independent evidence
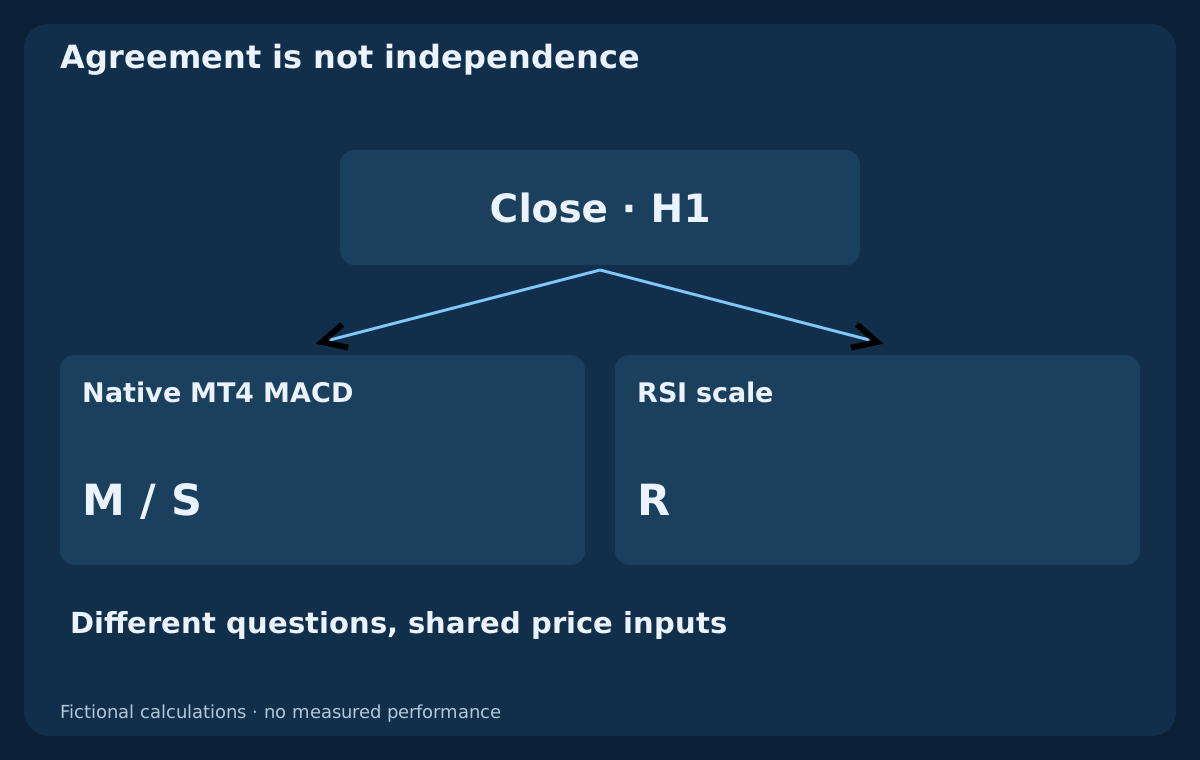
Both indicators transform overlapping price history. MACD and RSI can respond differently because their calculations and smoothing differ, yet agreement is not equivalent to two independent witnesses. Adding a moving-average crossover as a third vote can repeat information already embedded in MACD. Label each tool by the decision it changes, and distinguish a different-looking display from an additional testable condition.
A useful comparison asks which MACD events an RSI gate removes, which events survive and what happens after costs under fixed trade rules. A filter may remove losing opportunities, winning opportunities or both. Fewer signals and a cleaner-looking chart do not establish better performance. Nor does a disagreement prove one indicator is broken: a shorter-term recovery can coexist with a still-negative average relationship. The difference itself is information to interpret.
6. Define a state, a fresh event and an observation flag
For one teaching rule, define a fresh upward MACD/signal event as X(k) = 1 when D(k−1) ≤ 0 and D(k) > 0. Define the RSI gate as R(k) > 50. Set O(k) = X(k) AND [R(k) > 50] on that same completed bar. O is an observation flag. It does not mean buy, filled, profitable or safe. This rule does not additionally require M to be positive.
If D remains positive on the next bar, the above-signal state persists but X returns to 0. If RSI equals 50, the strict gate fails. If any necessary value is unavailable, there is no valid decision; missing data must not become a numerical zero. The corresponding downward comparison would use previous D at or above zero, current D below zero and an explicitly chosen bearish gate. It requires its own tests rather than an assumed performance symmetry.
7. Fix the completed-bar clock and comparison precision
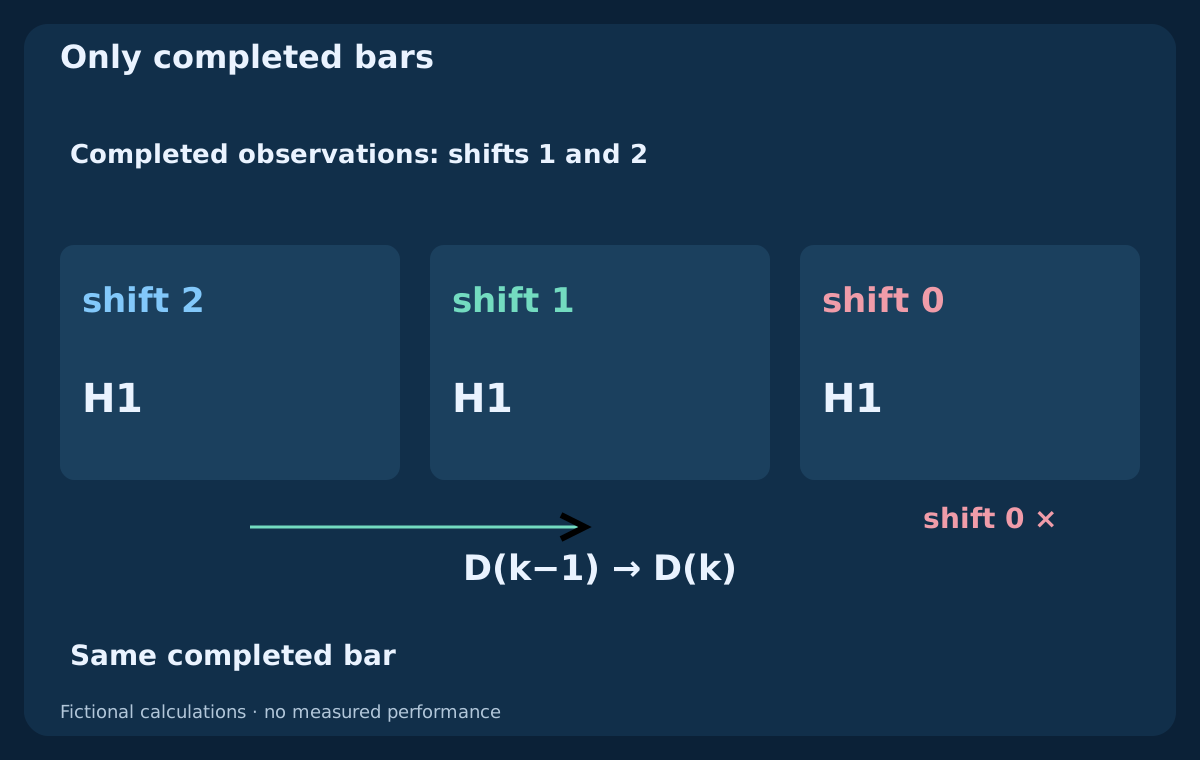
Evaluate the rule only after the H1 candle has completed and the next bar and required data are available. For the current H1 series in MT4, shift 0 is forming, shift 1 is the latest completed bar and shift 2 is its predecessor. An intrabar crossing that disappears before completion is not the closed-bar event specified here. Store the completed bar's timestamp with the readings so a later refresh cannot silently change the decision record.
Use unrounded values for comparisons. A table rounded for reading can show two equal-looking values even when their full-precision difference is positive or negative. For multiple timeframes, map the actual completed intervals and their availability; do not assume equal array shifts mean equal timestamps. This guide deliberately keeps the observation on one H1 clock. A later quote belongs to execution and must not be substituted for the historical indicator input.
8. Reproduce the fictional history and its initialization
The shared CSV contains 72 invented EURUSD H1 Bid closes, labeled by completion time from 2026-07-06 00:00 UTC. Start at 1.10000. Changes in pips are (−3,+1) × 20, then +2 × 20, −1 × 6 and +3 × 5; 1 pip = 0.00010. The comparison window starts with k39 as the predecessor, so k40 can be evaluated. No observed broker prices or future returns are supplied.
Seed each EMA with the arithmetic mean of its first full price window, then use α = 2/(n+1). M first exists at k25 and its 9-value SMA signal at k33. Seed G and L with the first 14 changes, then update each as (13 × previous + current)/14. This declared seed makes the lesson reproducible; it does not promise exact agreement with an MT4 terminal using different earlier history. Blank CSV fields mean unavailable, not zero.
9. Read the calculated event log before drawing conclusions
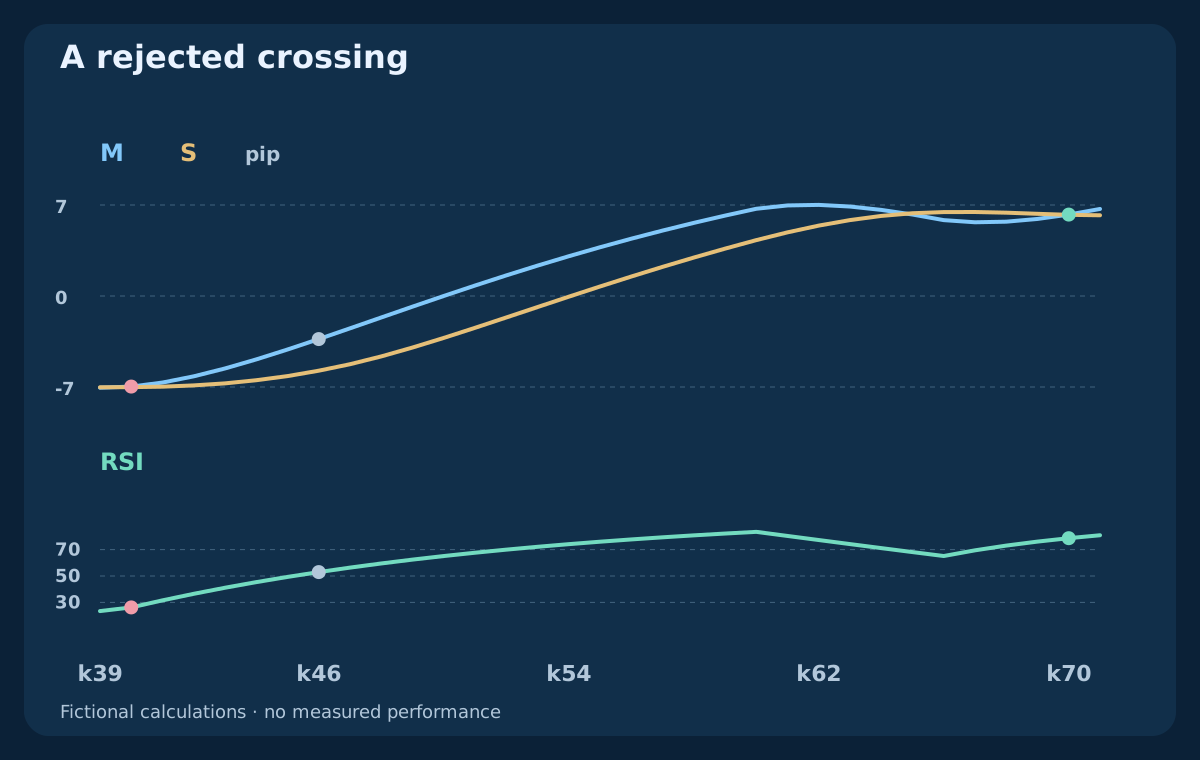
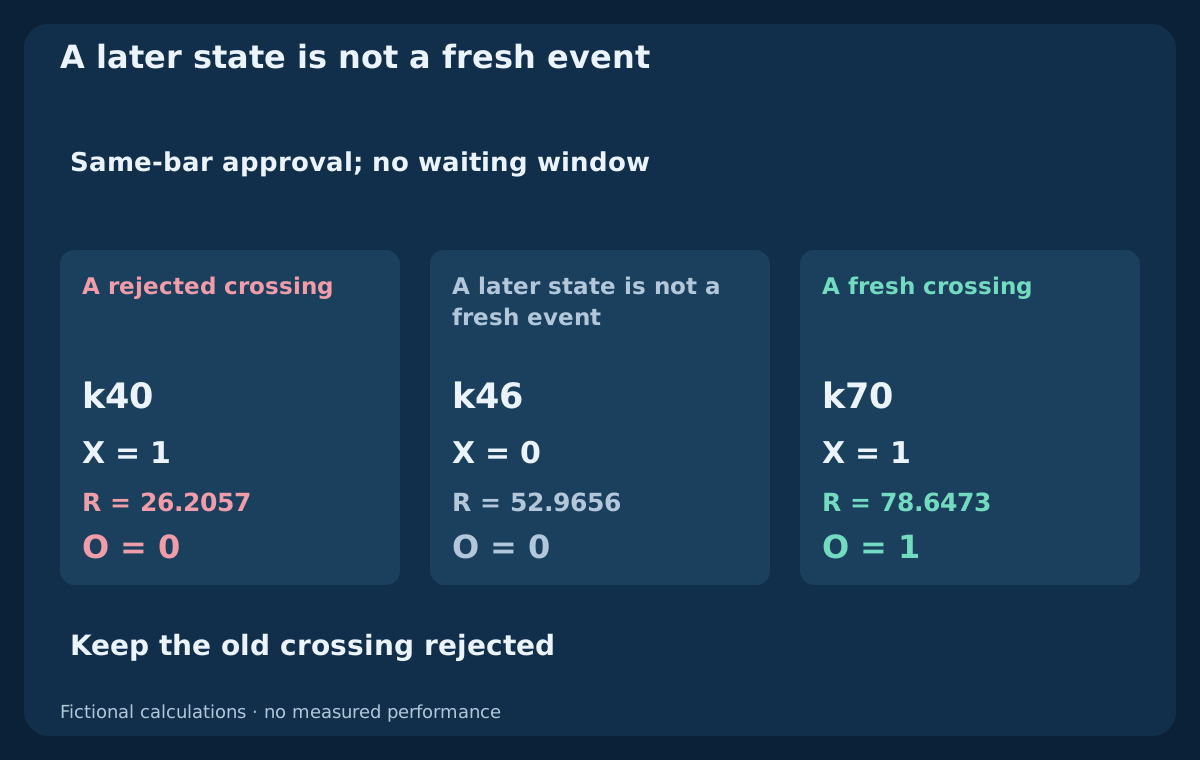
At k39, D is −0.0357 pip. At k40, D is +0.0438 pip, so a fresh upward crossing exists. RSI is only 26.2057: the gate fails and O is 0. M is still −6.9666 pip, which also demonstrates why a main/signal crossing is different from a zero-line crossing. The table expresses M, S and D in EURUSD pips by multiplying their price-unit values by 10000.
At k45, RSI is 49.3076; at k46 it is 52.9656. By k46, D has already been positive for several bars. The RSI state now passes, but X is 0, so O remains 0. Read all columns at the same timestamp. Displayed values are rounded to 4 decimals for inspection; the underlying CSV preserves substantially more precision, and independently rounded columns can differ in their last displayed digit. This is a decision log, not a collection of trades or a measured win rate.
| Close time UTC | Bid close | M (pip) | S (pip) | D (pip) | RSI 14 | X | O |
|---|---|---|---|---|---|---|---|
| 2026-07-07 15:00 | 1.09590 | -7.0572 | -7.0215 | -0.0357 | 23.4270 | 0 | 0 |
| 2026-07-07 16:00 | 1.09600 | -6.9666 | -7.0104 | 0.0438 | 26.2057 | 1 | 0 |
| 2026-07-07 21:00 | 1.09700 | -4.1160 | -6.1615 | 2.0454 | 49.3076 | 0 | 0 |
| 2026-07-07 22:00 | 1.09720 | -3.3134 | -5.7453 | 2.4319 | 52.9656 | 0 | 0 |
| 2026-07-08 21:00 | 1.10030 | 5.9268 | 6.3221 | -0.3953 | 76.0651 | 0 | 0 |
| 2026-07-08 22:00 | 1.10060 | 6.2630 | 6.2440 | 0.0191 | 78.6473 | 1 | 1 |
| 2026-07-08 23:00 | 1.10090 | 6.6944 | 6.2091 | 0.4853 | 80.8699 | 0 | 0 |
10. Keep a rejected crossing rejected under this rule
The rejected k40 event is not stored until RSI becomes favorable at k46. Calling that later state the original confirmed crossing would change the specification after the fact. Under the same-bar rule, a later opportunity requires a fresh MACD event. Logging the rejection and its reason prevents a chart drawn afterward from making the two indicators appear simultaneous when they were not.
A waiting policy is possible, but it is another rule. For example, a separately tested version could retain an event for at most 2 later completed bars, require D to remain positive and accept the first RSI pass inside that window. It must define expiry, reset, conflicting events and the actual later execution time. Such a window would already have expired before k46. Never combine results from immediate and waiting versions without identifying which rule generated each observation.
11. Read the later fresh crossing without inferring a trade
At k69, D is −0.3953 pip. At k70, D becomes +0.0191 pip and RSI is 78.6473. X and the midpoint gate are both true, so O is 1. This is a new event, not a repair of k40. The high RSI does not veto this particular observation rule because no upper-threshold veto was specified. Adding an RSI ceiling would create another version whose rejected cases and contribution need testing.
At k71, RSI rises to 80.8699 and D stays positive, but there is no new crossing and O is 0. A persistent favorable state must not trigger duplicate orders on every tick. Even k70's qualifying observation supplies no stop, target, fill or future outcome. An EA would still need to reconcile existing positions and pending requests after interruption. Indicator agreement cannot establish that an order was sent successfully or that a position exists.
12. Interpret conflicts in trends, ranges and transitions
In a developing recovery, RSI can regain its midpoint while M remains negative because the two calculations summarize history differently. In a strong trend, RSI can remain beyond an extreme while MACD loses some acceleration. In a narrow range, both can alternate rapidly and produce apparent confirmations that are expensive to trade. Identify the price context using a rule fixed before evaluating outcomes; do not label every losing interval a range afterward.
Separate ordinary indicator disagreement from momentum divergence. Divergence compares price and indicator behavior at specified pivots and requires a pivot-confirmation clock. It is not another name for RSI above 50 while M is below zero. Likewise, a stronger reading does not tell you how much price room remains to the next barrier. Use the existing guides on momentum, market structure and execution to resolve those separate questions, rather than adding more oscillator votes.
13. Measure the price of waiting with fixed reference levels
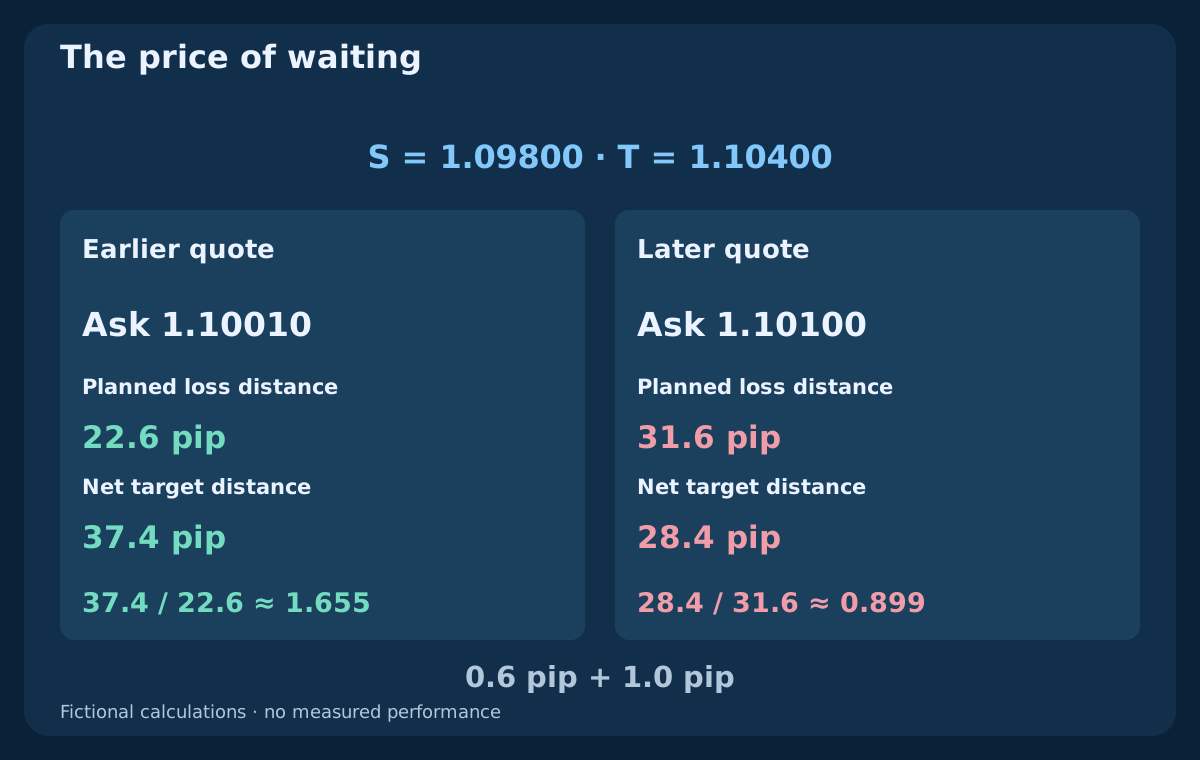
Consider a separate fictional BUY comparison, unrelated to the CSV price path. Freeze a Bid-side stop at 1.09800 and a Bid-side target at 1.10400. An earlier Bid/Ask is 1.10000 / 1.10010; a later one is 1.10090 / 1.10100. The Ask-to-stop distances are 21 and 30 pips, while target-minus-Ask distances are 39 and 30 pips. The later confirmation has changed the opportunity even if it appears more persuasive.
Assume a round-trip commission equivalent to 0.6 pip and a total adverse-execution allowance of 1.0 pip. Planned loss distances become 22.6 and 31.6 pips; net target distances become 37.4 and 28.4 pips. Their ratios are approximately 1.655 and 0.899. Entry spread is already included by using Ask against Bid-side exits: do not add it again. These planning allowances cannot cap actual slippage or loss, and neither quote is a claimed fill.
| Quote | Bid / Ask | Stop (pip) | Target (pip) | Loss + costs | Net target | Ratio |
|---|---|---|---|---|---|---|
| Earlier | 1.10000 / 1.10010 | 21.0 | 39.0 | 22.6 | 37.4 | 1.655 |
| Later | 1.10090 / 1.10100 | 30.0 | 30.0 | 31.6 | 28.4 | 0.899 |
14. Complete the trading specification before testing returns
An executable model must say which price structure matters, which completed event permits entry, how long it remains eligible and what cancels it. It also needs a fresh executable quote, maximum spread and distance limits, broker stop constraints, initial protection and an exit policy. Fix those choices before comparing indicators. A rejected quote must not be replaced later by a better-looking historical candle price; an unprotected or uncertain order must be reconciled, not duplicated.
Position size depends on the loss distance, contract and account-currency value, commission and chosen execution reserves. Round volume down to the broker's lot step and check portfolio exposure. For positions held overnight, include swap and exit timing. A news restriction can be a separate execution gate, but it does not turn a delayed oscillator into independent evidence. The position-sizing, trading-cost and backtesting guides cover these tasks in detail; the indicator pair does not replace them.
15. Test whether the extra condition earns its complexity
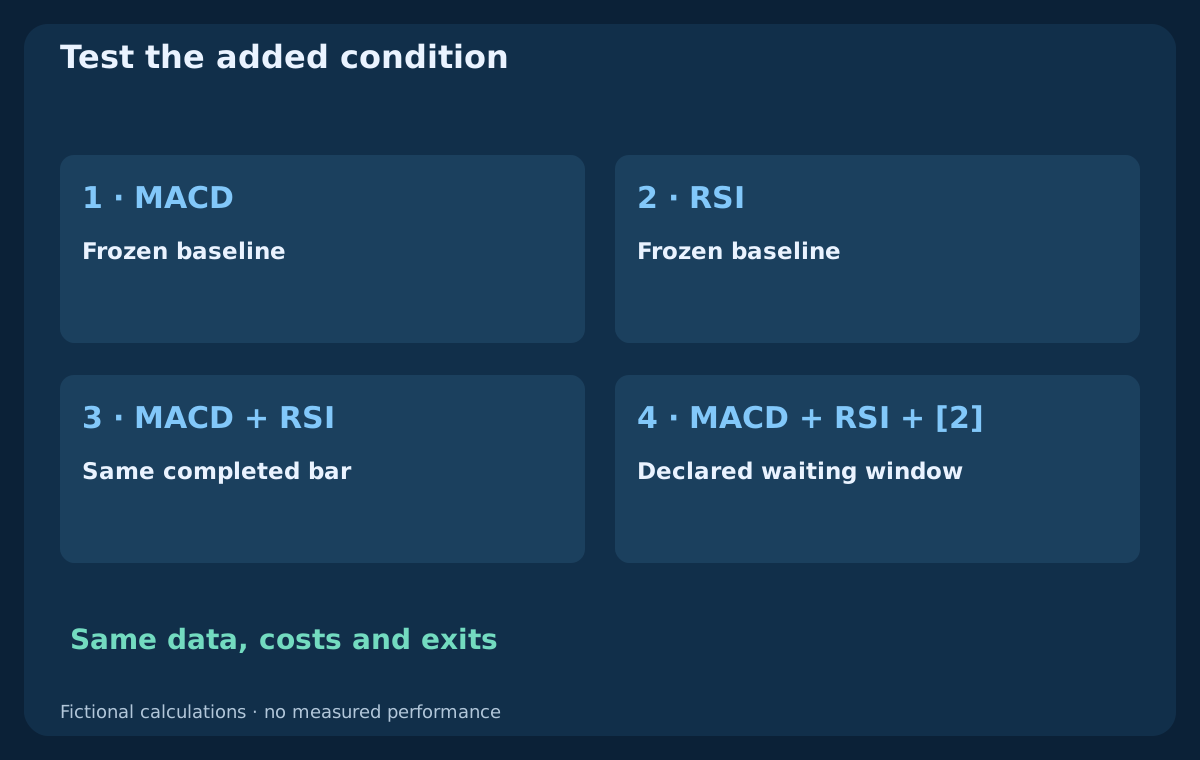
Freeze a MACD-event baseline, a separately specified RSI-event baseline, the same-bar combination and any waiting-window variant. First compare observation counts, rejection reasons, time shifts and price movement during delays. Then evaluate complete trading versions using the same data, entry handling, cost assumptions, exit rules and risk budget. Changing the exit for only one version would prevent the filter's contribution from being isolated. Track the opportunities removed, not just the attractive survivors.
Reserve later data for evaluation and keep a record of every parameter version tried. Examine sensitivity around the selected periods and thresholds without choosing a new winner for every interval. Report uncertainty, adverse regimes, spread changes and missed or ambiguous executions. A filter that raises win rate can still reduce net expectancy or worsen drawdown. The synthetic observation table contains none of the trade outcomes needed to demonstrate an edge; a short sequence of correctly calculated flags is insufficient evidence.
16. Use a short review before trusting the combination
Before interpreting a chart, name the symbol, timeframe, input price, MACD signal smoothing and actual plotted series. Then identify the completed bars, distinguish a state from an event, state the RSI gate and specify how missing or equal values are treated. Write down whether rejected events expire immediately or enter a declared waiting window. If two readers cannot reproduce the same timestamped decision, the specification is not ready for a performance comparison.
Treat this guide as the foundation for studying a defined MACD–RSI model, not as an instruction to trade every qualifying flag. The next research step is to choose one complete strategy hypothesis and test it under frozen rules. Existing MACD, RSI, timed-confirmation and EA-validation resources provide useful comparisons. Keep their triggers separate: a signal-line event, a zero-line event and an RSI recovery are different experiments even when they occur on the same chart.
Frequently asked questions
What is the main difference between MACD and RSI?
MACD measures a relationship between faster and slower price averages; RSI compares smoothed gains and loss magnitudes on a bounded scale. They can answer different questions, but both depend on price history. Their agreement is an observation to investigate, not proof of independent confirmation or profitability.
Are MACD 12/26/9 and RSI 14 the best settings?
They are familiar reference settings used here to make the example identifiable. This guide does not establish optimal parameters. Applied price, signal smoothing, initialization, timeframe, feed and trading costs also matter. Freeze a candidate specification and assess nearby alternatives and later data without selecting settings only because they improve a historical picture.
Why does the MT4 MACD histogram differ from another chart?
Native MT4 normally plots the main series M as bars with a signal line S. Another display may plot bars for D = M − S. Positive M and positive D are different conditions. Identify the actual series and signal-line smoothing before comparing colors, crossings or numerical outputs.
Must MACD and RSI both cross on the same candle?
Only if the chosen rule says so. This example requires a fresh MACD/signal crossing and an RSI state above 50 on the same completed bar; it does not require a fresh RSI crossing. A delayed-approval version needs its own waiting limit, cancellation rules and execution time. It must be tested separately.
Does RSI above 70 automatically mean sell?
No automatic opposite trade follows from that reading. RSI can remain high during a persistent advance. In this example, the midpoint gate accepts the fresh k70 observation despite RSI 78.6473. A ceiling or a reversal model would be a different specification; neither is justified merely by seeing a high value.
Can combining MACD and RSI prove a profitable Forex strategy?
No. The combination supplies readings and optional eligibility rules. Demonstrating useful trading behavior requires complete entries, exits, costs, risk controls and evaluation on data not used to select the model. The fictional calculations here demonstrate arithmetic and chronology. They contain no measured returns or performance claim.
Sources and educational notes
MetaQuotes documents the indicator definitions and API parameters. The initialization convention, synthetic price path, observation rule and quote comparison below are authored teaching examples. They are not a measured trading system, a reconstruction of a broker account or an implementation claim about a commercial EA. The supplied CSV records every input and calculated value.
Educational content. Prices, indicator examples and quote comparisons are fictional. Forex trading involves risk. Indicator agreement does not guarantee profitable rules, execution or future performance.