

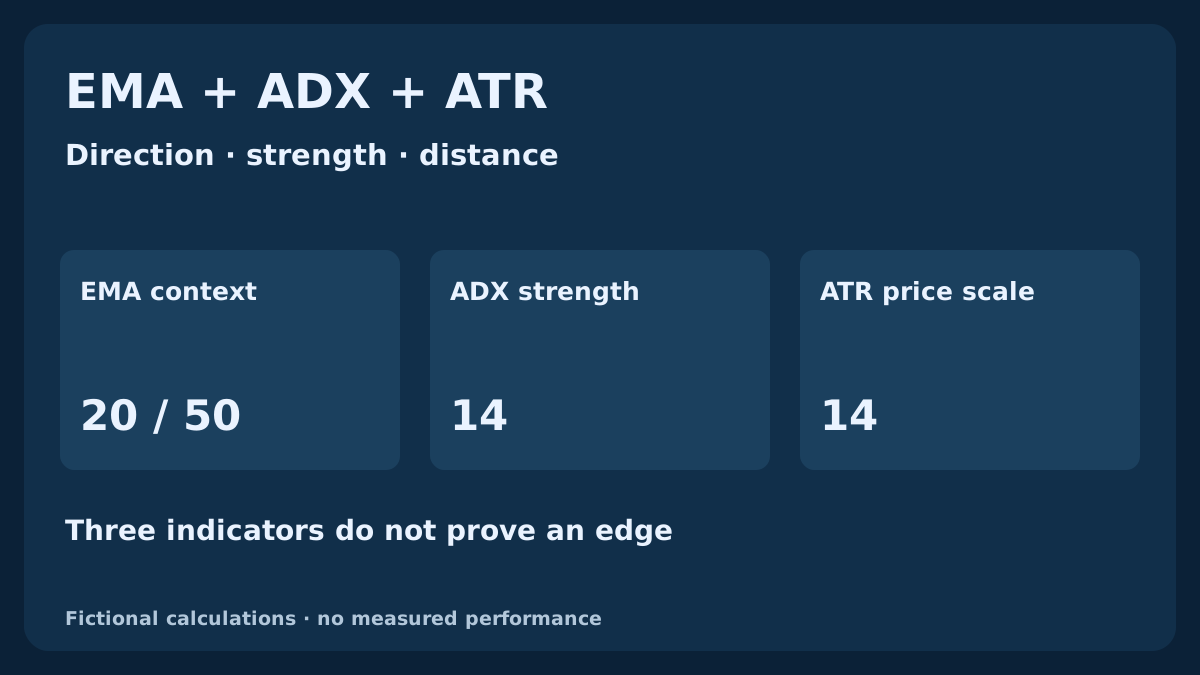
A price above a moving average, a strong ADX reading and a rising ATR describe different properties. None makes the others unnecessary, and their agreement is not a complete entry rule. This guide gives EMA, ADX and ATR separate jobs, then follows one fully specified fictional H1 history. A second, independent quote example shows why wider volatility can require a smaller position even when the directional view has not changed.
1. Ask three different questions before combining indicators
EMA can help describe where price sits relative to a smoothed path. ADX can summarize the imbalance between upward and downward directional movement. ATR can measure recent True Range and provide a scale for distances. Calling all three confirmation hides these different jobs. Start by writing which observation each one changes, and which part of the eventual trading decision remains unspecified.
This is a guide to reading and testing a combination, not a ready-to-trade EMA–ADX–ATR strategy. The example classifies completed-bar contexts and deliberately stops before inventing an entry or a return. A full system still needs a price trigger, expiry, execution, protection, exits, volume and portfolio limits. The existing MACD–RSI guide explains the related distinction between a persistent state and a new event.
2. Fix the instrument, inputs and roles
Our reference uses fictional EURUSD Bid H1 bars, EMA 20 and EMA 50 on Close, and 14-period Wilder reference calculations for ADX and ATR. The EMA pair supplies one directional context, not two independent votes. ADX supplies a declared strength condition. ATR supplies a range scale used later in a separate planning example. These periods identify the experiment; they have not been established as the best Forex settings.
Keep the symbol, bar boundaries, quote side, history, method and seed together in the specification. A period label alone is insufficient to match an implementation. In MT4, distinguish the moving average's visual offset from the buffer shift used to read an earlier bar. Use the Data Window and recorded values rather than colors or the apparent angle of a line: chart scaling can change that angle without changing the calculation.
| Component | Role in this example | What remains unspecified |
|---|---|---|
| EMA 20 / 50 | Directional price context | A fresh entry event |
| ADX 14 | Declared strength gate | Direction and execution |
| ATR 14 | Range scale for distances | A guaranteed future range or loss limit |
3. Read the EMA relationship without forecasting the next candle
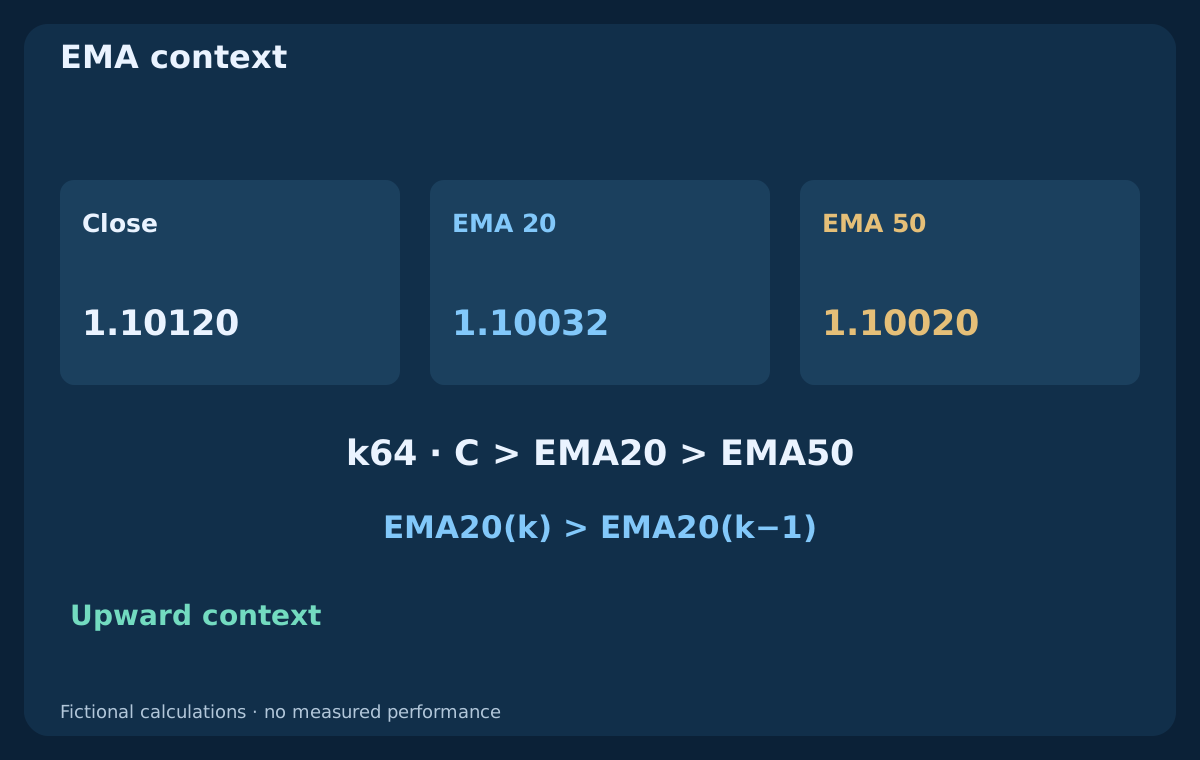
For period n, our EMA uses α = 2/(n+1) and E(k) = E(k−1) + α × [C(k) − E(k−1)]. Seed it with the arithmetic mean of its first n closes. The fast series begins at k19 and the slow one at k49. A close above the fast average, above the slow average, with a rising fast average is one chosen upward-context definition; it does not prove a future advance.
Price above one EMA can occur during a rebound inside a broader decline. Two almost equal averages can alternate order in a range. Their separation is measured in price units and depends on the periods and history. If you later normalize a price-to-EMA distance by ATR, state that extra rule and test it separately. Do not turn a visually steep line or an attractive spacing into an unrecorded eligibility condition.
4. Separate ADX strength from directional movement
Let the upward high change be H(k) minus H(k−1), and the downward low change be L(k−1) minus L(k). Positive DM retains the upward change only when it is positive and strictly larger than the downward change; negative DM uses the opposite comparison. A tie sets both to zero. This is not the signed close-to-close return. Smooth both DM series and True Range before forming +DI and −DI.
In this reference, +DI = 100 × W(+DM)/W(TR), −DI = 100 × W(−DM)/W(TR) and DX = 100 × |+DI − (−DI)| / [+DI + (−DI)]. ADX is the Wilder-smoothed DX series. It discards the sign of the imbalance, so a high ADX can describe either direction. The DI ordering adds directional information; it is not the same series as the non-directional ADX line.
5. Declare the smoothing before expecting MT4 parity
For this lesson, W starts with the mean of the first 14 valid observations, then uses W(k) = [13 × W(k−1) + x(k)]/14. The first smoothed TR and DM values occur at k14. The first ADX is the mean of DX values k14 through k27; subsequent ADX values use that same recurrence. If smoothed TR is positive but both DI values are zero, we explicitly set DX to zero. Unavailable history is never substituted with zero; a zero TR denominator invalidates the comparison.
MT4 exposes ADX through MODE_MAIN, MODE_PLUSDI and MODE_MINUSDI. The iATR interface has no applied-price or smoothing selector, while iMA has separate method, applied-price, offset and buffer-shift arguments. Do not assume this declared Wilder reconstruction equals a native or custom indicator merely because both say 14. Match the actual implementation, seeds and available history, then compare completed-bar outputs. This guide makes no terminal-parity claim.
6. Use ATR as a scale, not as another directional vote
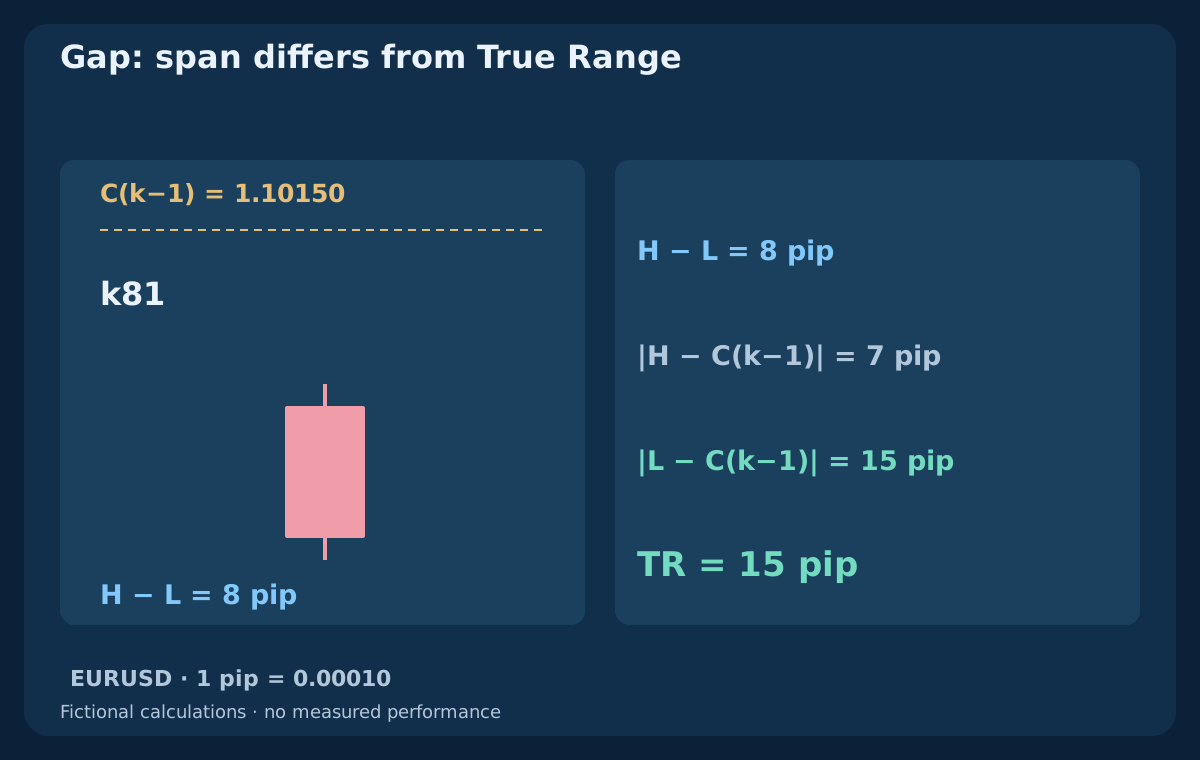
True Range is TR(k) = max[H(k) − L(k), |H(k) − C(k−1)|, |L(k) − C(k−1)|]. Our ATR is W(TR), using the recurrence just declared. A gap can make True Range larger than the candle's high–low span. Large upward moves, large downward moves and gaps can all raise ATR. A rising ATR therefore cannot tell you to choose BUY rather than SELL.
ATR is in price units. For this EURUSD example, 1 pip = 0.00010, so an ATR of 0.00100 equals 10 pips. A five-decimal point is smaller than a pip; another instrument can have a different price increment and pip-value convention. The ratio Z(k) = [C(k) − EMA20(k)]/ATR14(k) describes extension on a selected historical scale. It is not a probability, a future range guarantee or an automatic overextension veto.
7. Align the completed bars before comparing readings
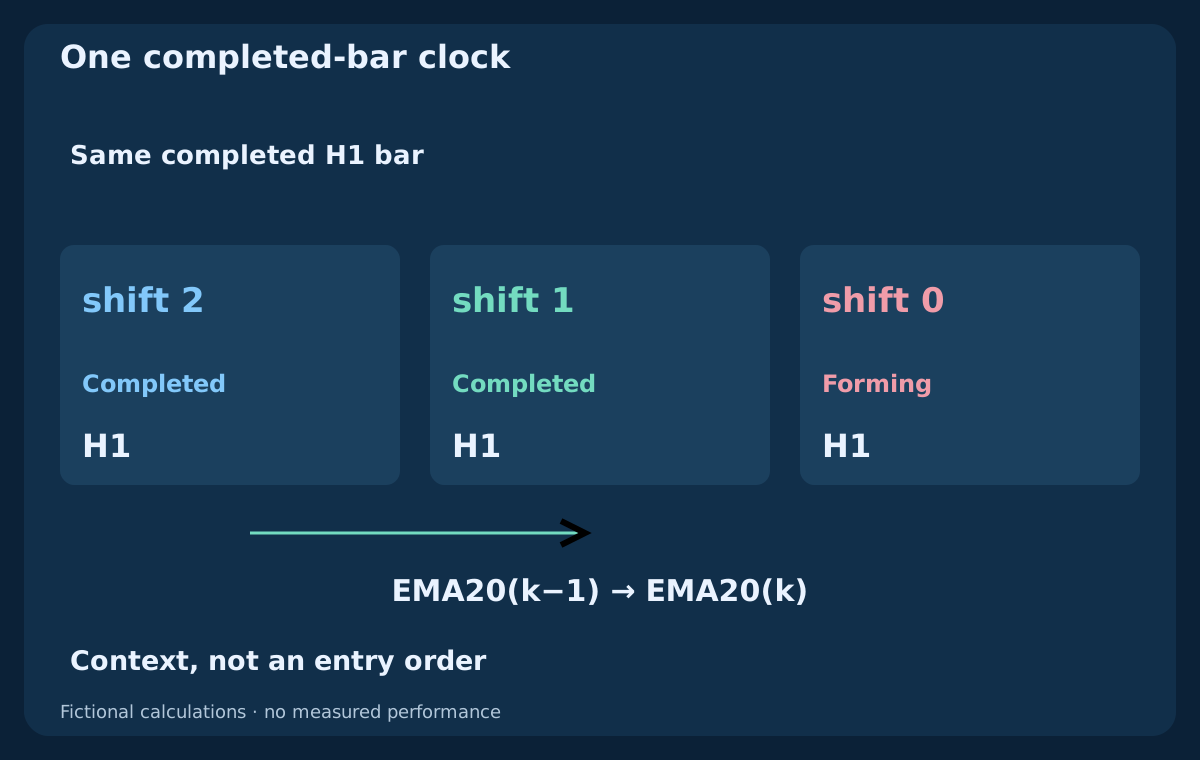
Make the H1 assessment after a candle completes and the next bar and required history are available. On the current MT4 H1 series, shift 1 is the latest completed bar, shift 2 its predecessor, and shift 0 is still forming. For an EMA slope comparison, read both completed timestamps. A visual offset of zero does not mean that buffer shift 0 is appropriate for this closed-bar rule.
Keep all three indicator readings on the same completed H1 observation. If using another timeframe later, match actual intervals and availability instead of equating array indices. Compare unrounded values and save the timestamp with the inputs. An indicator state can remain true on many bars; that persistence does not authorize repeated requests on every tick. Position and request reconciliation is a separate operational task.
8. Reproduce every fictional input before reading the log
The shared CSV has 101 invented EURUSD Bid H1 bars from 2026-07-06 00:00 UTC, labeled by completion time. At k0, Open and Close are 1.10000, High is 1.10030 and Low is 1.09990. For k1–k60, Close minus Open alternates in pips as (+2,−2) × 30; k61–k75 use +3 pips, k76–k90 −6 pips, and k91–k100 +2 pips. These are constructed inputs, not sampled broker candles or forecasts.
After k0, Open equals the previous Close except at k81, where it is 8 pips lower. Each later High is one pip above the greater of Open and Close, and Low one pip below the smaller. At k81 the candle span is 8 pips but True Range is 15 pips. The CSV includes all OHLC, TR, DM, DI, EMA, ADX, ATR and observation columns. Empty fields mean unavailable. The chosen finite history defines the seed; it does not establish convergence to a terminal with older data.
9. Define context states and inspect the calculated table
Define upward context U when C(k) > EMA20(k) > EMA50(k) and EMA20(k) > EMA20(k−1). Downward context D reverses both comparisons. Define A(k) = [ADX14(k) ≥ 25], then Q↑(k) = U(k) AND A(k) and Q↓(k) = D(k) AND A(k). The value 25 is an illustrative inclusive threshold, not an established optimum. ATR is recorded as a scale here; it is not secretly counted as another directional approval.
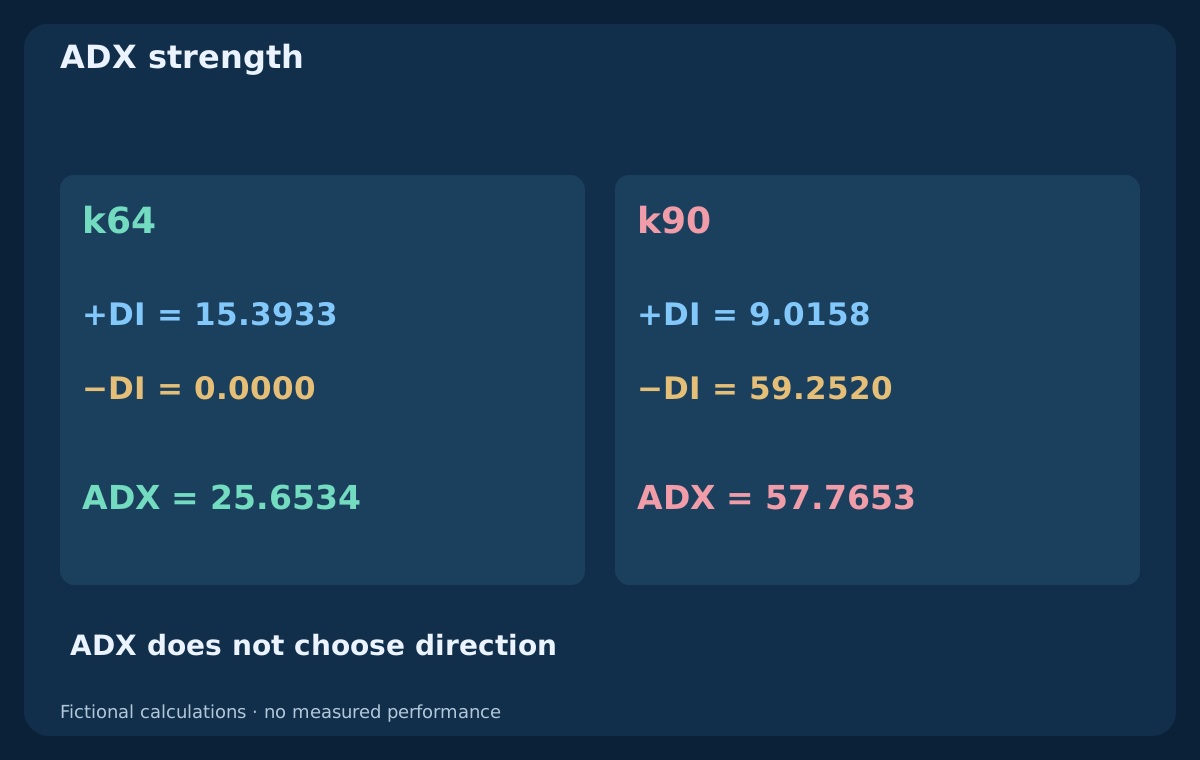
At k61, upward context exists but ADX is 7.1429, so Q↑ is zero. At k64, ADX is 25.6534 and Q↑ is one. By k75, the close is about 4.6965 ATR above EMA20, although the same context still qualifies. No extension ceiling was specified. The table rounds EMA prices to five decimals and other readings to four; its flags use full precision. Qualifying rows are context observations, not executed trades or a measured win rate.
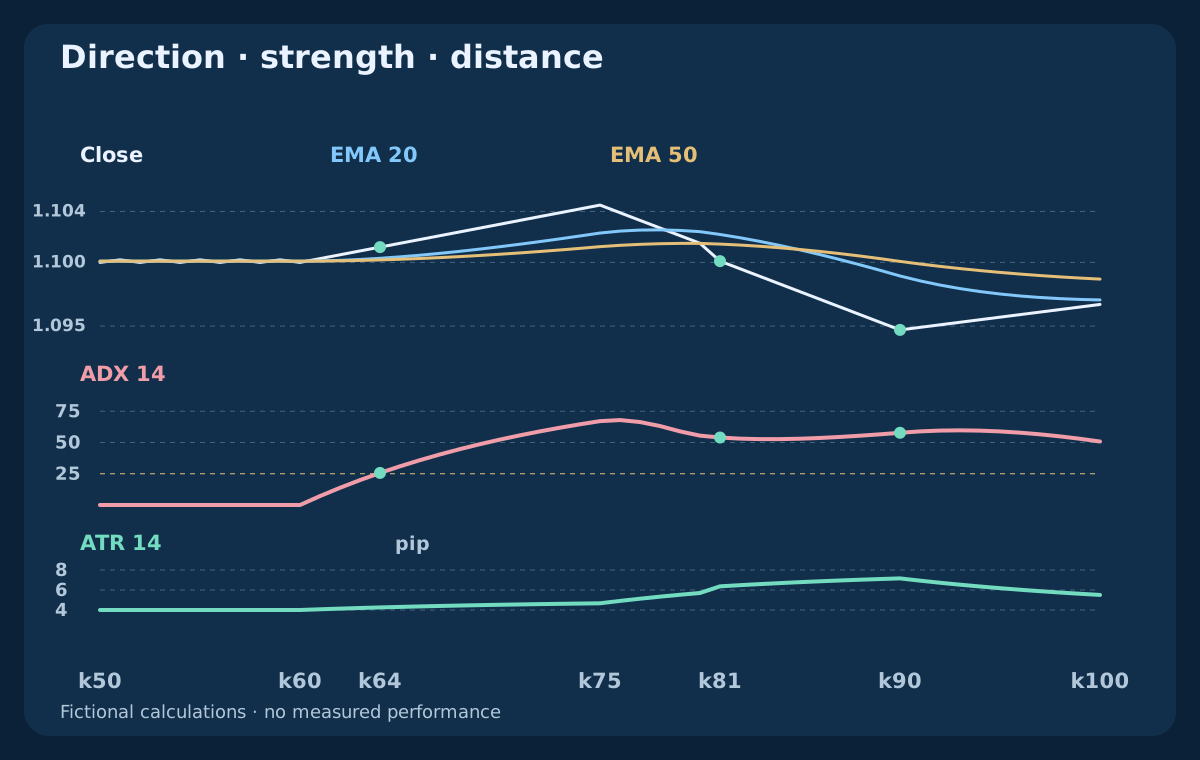
| Bar | Bid close | EMA 20 | EMA 50 | ADX 14 | ATR (pip) | Q↑ | Q↓ |
|---|---|---|---|---|---|---|---|
| k60 | 1.10000 | 1.10009 | 1.10010 | 0.0000 | 4.0000 | 0 | 0 |
| k61 | 1.10030 | 1.10011 | 1.10010 | 7.1429 | 4.0714 | 0 | 0 |
| k64 | 1.10120 | 1.10032 | 1.10020 | 25.6534 | 4.2565 | 1 | 0 |
| k75 | 1.10450 | 1.10231 | 1.10124 | 67.0974 | 4.6710 | 1 | 0 |
| k81 | 1.10010 | 1.10219 | 1.10144 | 53.9858 | 6.3659 | 0 | 0 |
| k90 | 1.09470 | 1.09893 | 1.10008 | 57.7653 | 7.1613 | 0 | 1 |
| k100 | 1.09670 | 1.09706 | 1.09869 | 50.7920 | 5.5067 | 0 | 1 |
10. Read high ADX correctly when the price picture changes
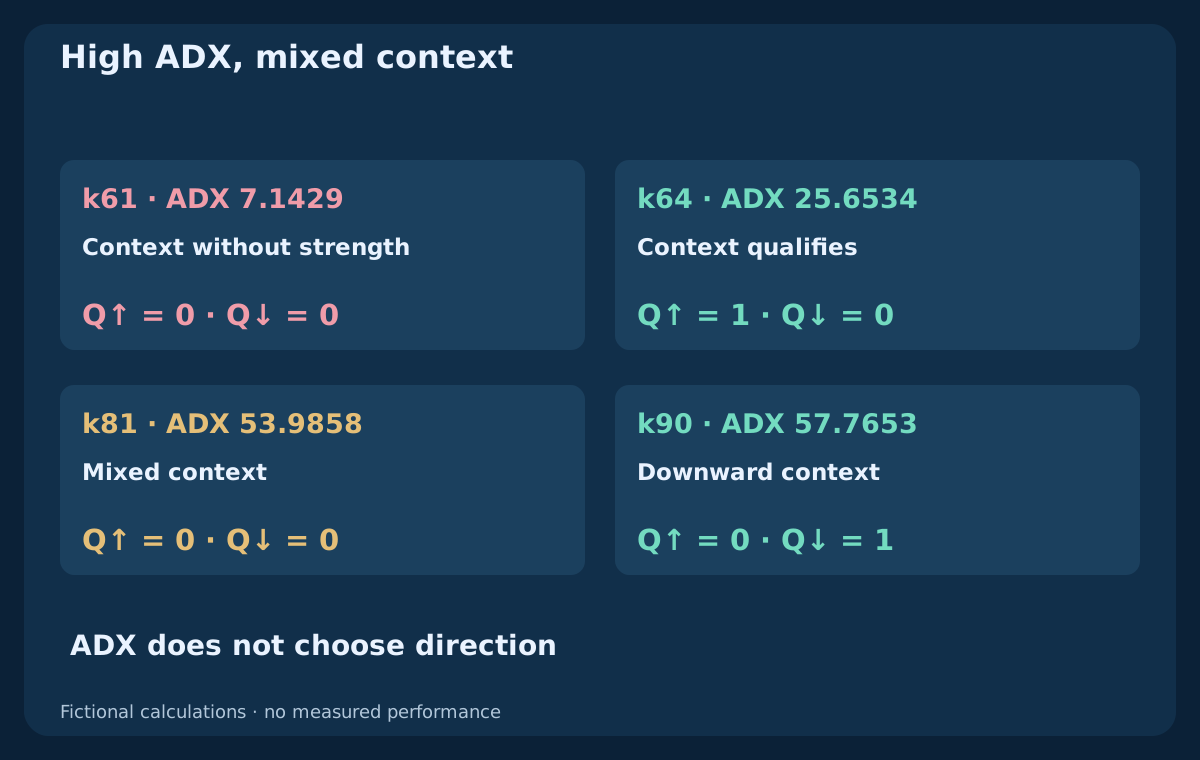
At k81, ADX is still 53.9858, but neither EMA context qualifies: price is below both averages while the fast EMA remains above the slow one. Both Q flags are zero. At k90, ADX is 57.7653 and the downward context qualifies. The earlier high ADX was never a guarantee that an upward view would remain valid. Its directionless strength reading must be interpreted with the separately defined context.
By k100 the price has recovered from its lower level, yet the chosen downward EMA context still holds and ADX is 50.7920. Falling ADX does not automatically establish an upward reversal. Requiring rising ADX, DI agreement, a different threshold or an extension limit would each create another version. These variants can be sensible research questions, but adding them after seeing inconvenient rows prevents an honest comparison.
11. Keep the price trigger separate from the context filter
A context classification does not specify when to enter. A later strategy might study a completed consolidation breakout or a pullback with a fresh price trigger, but it must define that trigger and its timing independently. Do not call every Q↑ row a new signal, and do not retain a rejected trigger indefinitely until ADX eventually becomes favorable. That would change both the population of decisions and the execution time.
Specify whether a trigger is assessed once on its completed bar or kept inside a declared waiting window. Define expiry, opposite events, missing data, one intended request and cancellation reasons. Reconcile uncertain requests and existing positions before retrying after an interruption. The combination supplies no evidence that a broker accepted an order, that protection is attached or that a trade is safe simply because all displayed lines look supportive.
12. Choose the stop policy before calculating the lot size
ATR can provide a minimum distance, but it does not identify a structural invalidation level or ensure a stop survives ordinary movement. A structure-only stop, an ATR-only stop and a rule combining the two are different hypotheses. For a planned BUY, our separate example fixes a structural Bid stop and uses d = max[Ask − structural stop, 1.5 × ATR]. The resulting stop is Ask − d. This is a declared planning convention, not a recommended universal multiple.
Align the stop with the instrument's actual price grid in the intended protective direction and recalculate distance after rounding. Check broker minimum distances, spread and a fresh executable quote. A stale quote or invalid stop is a rejection to record, not permission to substitute a favorable historical price. A stop can execute worse than its level during gaps or rapid movement; a mathematical distance and a chosen reserve cannot cap the loss.
13. Follow one budget through two volatility scenarios
This independent fictional EURUSD example uses Bid/Ask 1.10500 / 1.10512, structural stop 1.10300 and Bid target 1.10900. With ATR 10 pips, the floor is 15 pips, so structure dominates and d is 21.2 pips. Add a round-trip commission equivalent to 0.8 pip and a total adverse-execution reserve of 1.2 pips. Planned loss distance is 23.2 pips; the net target distance is 36.8 pips, a ratio of about 1.586. Ask against Bid exits already includes entry spread.
Assume a USD account, a standard contract of 100000 EUR, pip value 10 USD per standard lot, budget 100 USD and lot step 0.01. Round 100 / (23.2 × 10) down to 0.43 lots, for planned risk 99.76 USD. If only ATR doubles to 20 pips, the floor becomes 30 pips, the stop 1.10212, and total loss distance 32.0 pips. Volume falls to 0.31 lots, planned risk 99.20 USD, while the target ratio falls to 1.150. These are planning calculations, not fills or guaranteed maximum losses.
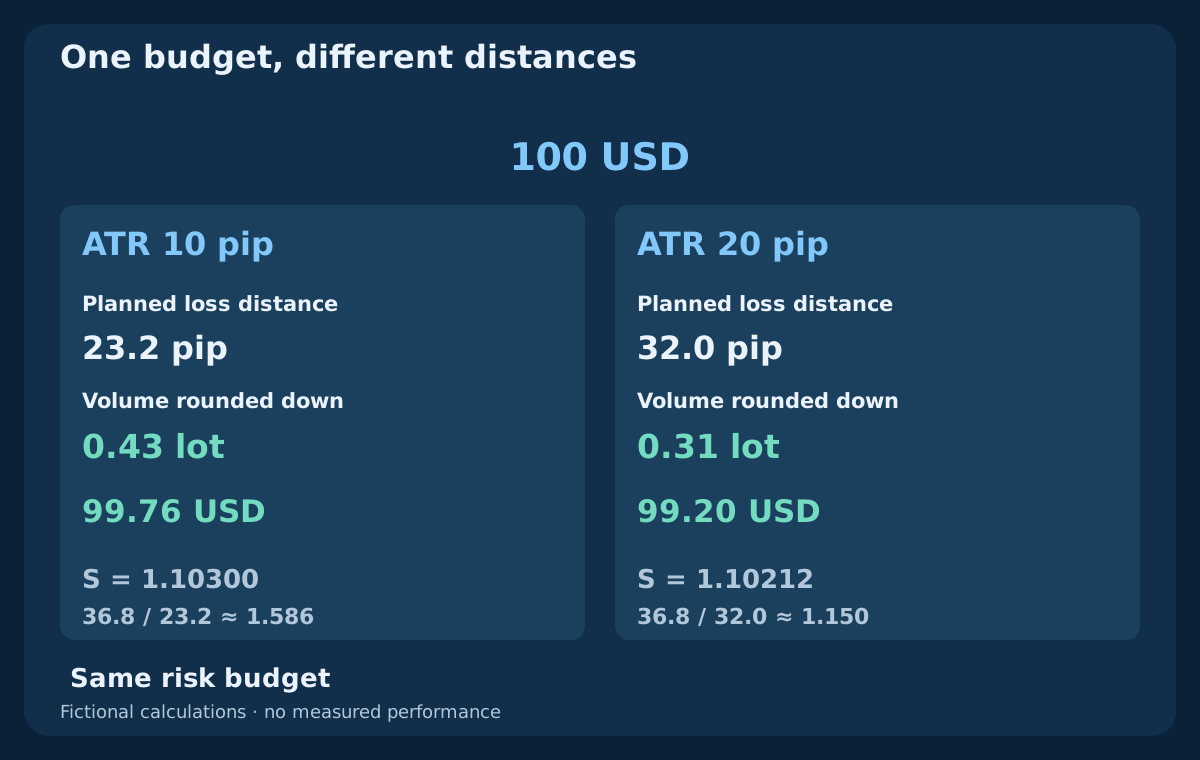
| Scenario | ATR (pip) | Bid stop | Distance (pip) | Loss + costs | Lots | Risk USD | Target ratio |
|---|---|---|---|---|---|---|---|
| Initial ATR | 10.0 | 1.10300 | 21.2 | 23.2 | 0.43 | 99.76 | 1.586 |
| ATR doubled | 20.0 | 1.10212 | 30.0 | 32.0 | 0.31 | 99.20 | 1.150 |
14. Do not confuse volatility adjustment with permission to widen risk
The two scenarios hold the quote, structural reference, target, budget and cost assumptions fixed to isolate ATR's effect. A later real quote can change the result again. For another account currency, convert the contract's pip or tick value at the relevant rate and verify the broker specification. A raw ATR number cannot determine lots by itself. Check minimum volume, lot step, margin and correlated portfolio exposure before accepting a new position.
Do not apply the second scenario by widening an existing stop while keeping the original larger volume. That would increase planned exposure unless another explicitly tested management rule controls the change. ATR-based sizing here concerns a newly evaluated position with a frozen budget. Existing-trade management, swaps, news restrictions, aggregate losses and restart reconciliation each need their own rules; an indicator filter does not replace them.
15. Test the contribution of each added component
Freeze a complete EMA-context model with one defined price trigger and fixed exits. Compare it with the same model plus the ADX gate. Then separately test the ATR-based distance-and-volume policy against a declared alternative while preserving the risk budget and execution assumptions. Record rejected triggers, delayed decisions, stop distances, lots, exposure and costs. Changing the trigger, exit and budget at the same time would hide which component caused a difference.
Use later evaluation data, retain all tried versions and examine nearby periods and thresholds without selecting a fresh winner for each interval. Review losses, missed winners, net expectancy, drawdown, execution failures and uncertainty, not just win rate or fewer trades. The synthetic table verifies arithmetic and timing only. Even perfectly reproduced contexts contain no trade outcomes from which profitability, a safe risk percentage or a best combination could be inferred.
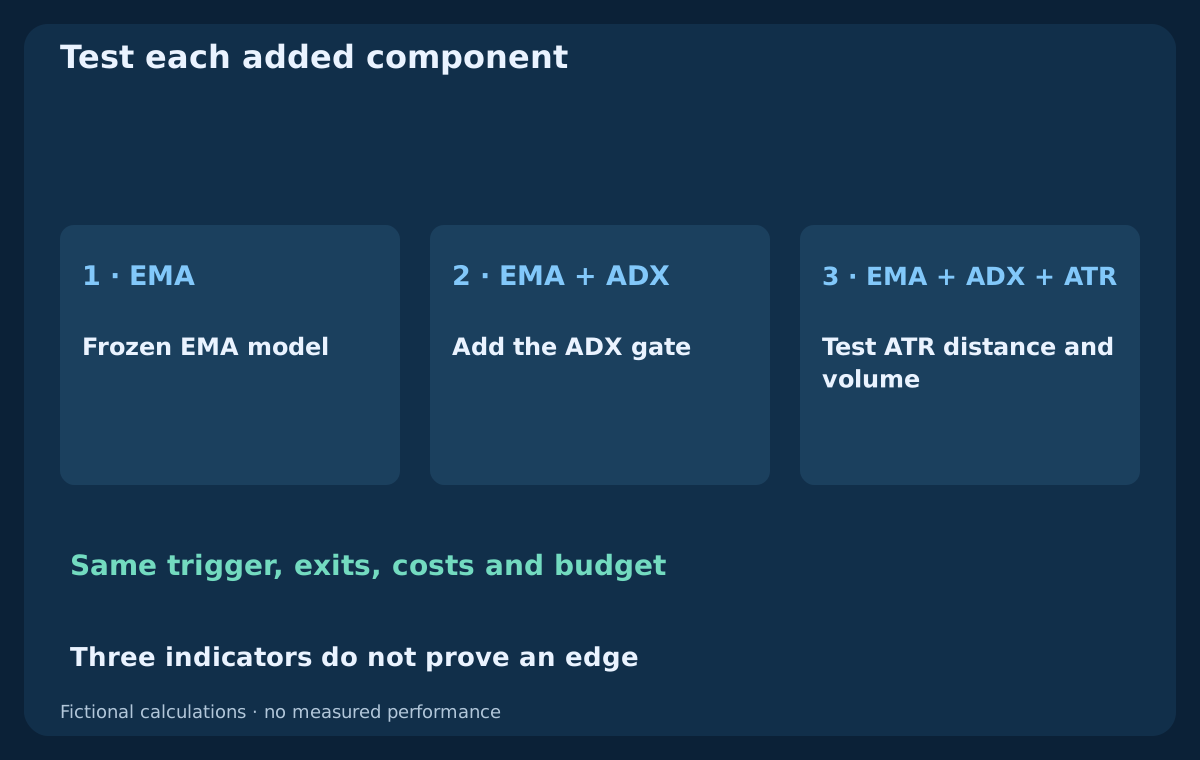
16. Use a compact review before moving to a strategy
Name the exact input history, quote side, timeframe, EMA method and seed, ADX and ATR smoothing, completed-bar timestamps and missing-data policy. State the context comparisons, threshold equality, and which readings are only diagnostics. Then write the fresh price event, execution expiry, protection, exit, cost treatment and volume limits before testing a tradable version. A reader should be able to reproduce the same decision without choosing a convenient chart afterward.
The next step for this combination is a separately specified strategy hypothesis, not trading every qualified context in this guide. Keep its evidence distinct from the future Bollinger Bands–RSI guide and from other indicator experiments. A useful combination has clear responsibilities and testable incremental effects. It does not become reliable merely because direction, strength and volatility can all be drawn on the same chart.
Frequently asked questions
What does each indicator contribute to EMA, ADX and ATR?
EMA supplies a chosen directional context, ADX summarizes directional-movement strength without its sign, and ATR measures True Range on a price scale. The roles can complement one another, but all use overlapping price data. Agreement does not establish independence, an entry event or profitable performance.
Are EMA 20/50, ADX 14 and ATR 14 the best settings?
No optimal set is established here. These reference periods identify the lesson. Smoothing, initialization, input history, timeframe and costs also matter. Freeze a full specification and compare nearby alternatives and later data without choosing parameters only because they improve one historical picture.
Does ADX above 25 mean that price should rise?
No. ADX measures strength without choosing direction. In the example, the high reading at k81 coexists with conflicting EMA context, and the high reading at k90 accompanies downward context. A threshold is an eligibility convention; adding DI ordering or a rising-ADX requirement creates another testable rule.
Can ATR tell me where price will go or guarantee my stop?
No. ATR summarizes historical True Range under a specified averaging method. An ATR multiple is a chosen distance, not a prediction, confidence interval or loss cap. Price gaps, slippage and execution conditions can produce outcomes beyond the planned level and reserve.
Why can my MT4 readings differ from the CSV?
The CSV uses declared Wilder reference calculations and explicit EMA seeds on fictional bars. A terminal or custom indicator can differ in algorithm, initialization, older history, candle grouping or quote data. Matching a period label is insufficient. Compare the exact completed bars and implementation before interpreting a discrepancy.
Why does the lot size fall when ATR rises?
Under the example's fixed budget, the wider ATR floor increases planned loss per lot. Volume is therefore rounded down from 0.43 to 0.31 lots to preserve that budget under the stated assumptions. This concerns a new position; it does not authorize widening an existing stop while keeping the original volume.
Sources and educational notes
MetaQuotes provides the indicator concepts and MQL4 interfaces. The reference smoothing, seeds, synthetic OHLC path and observation conditions here are explicitly authored educational definitions. They are not verified replicas of a particular MT4 terminal, a commercial EA description or measured trading results. The CSV contains all input bars and intermediate calculations; the separate quote-and-volume example does not follow that price path.
- MetaQuotes — Moving Average
- MetaQuotes — Average Directional Movement Index
- MetaQuotes — Average True Range
Educational content. The OHLC history, indicator values and quote scenarios are fictional. Forex trading involves risk. Indicator agreement and planning reserves cannot guarantee profitable rules, execution or a maximum loss.