

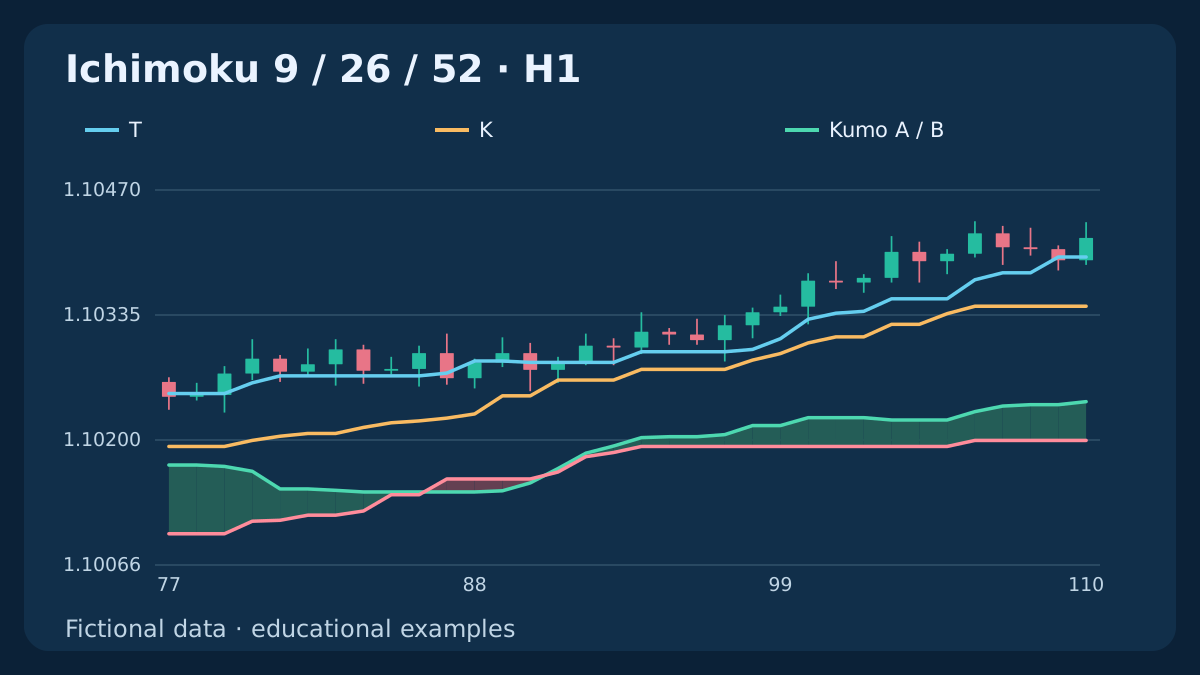
Ichimoku puts several measurements on one price chart, but they do not all share the same display position. A cloud drawn ahead is calculated from prices already observed. A Chikou point drawn in the past may only become known much later. Read the calculation time before treating the picture as a signal.
1. Define the five lines and the data clock
The reference uses fictional H1 Bid OHLC, ordered from oldest to newest as k = 0, 1, 2, …. Every calculation includes the current completed candle. Tenkan-sen is the short range midpoint, Kijun-sen the longer midpoint, and Senkou A and B bound the Kumo. Chikou is a displaced close.
A period means one chart candle, not necessarily one calendar hour or day. Real Forex feeds contain session gaps and different daily boundaries. Record the instrument, timeframe, feed and missing-bar policy before comparing two charts.
2. Calculate a range midpoint, not a close average
For a window of n completed candles, let HH_n[t] = max(High[t−n+1 … t]) and LL_n[t] = min(Low[t−n+1 … t]). The midpoint is M_n[t] = (HH_n[t] + LL_n[t]) / 2. These expressions are mathematical window notation, not executable platform code.
Only the extreme high and low determine this midpoint. Repeated closes elsewhere inside the range can change an SMA without changing it. A valid flat range still has a defined midpoint; there is no division by its width. An incomplete or missing required window remains unavailable in this reference.
3. Specify 9/26/52 and the exact displacement
The reference defines T[t] = M_9[t]; K[t] = M_26[t], then A_calc[t] = (T[t] + K[t]) / 2; B_calc[t] = M_52[t]. The familiar 9/26/52 names these three lookback lengths. It does not mean three independent forecasts.
For every CSV and figure here, displacement means exactly d = 26 index steps. Record the actual offset separately from a platform’s setting label: inclusive counting can create a one-candle difference. Verify a known calculated point against the bar where your installed chart draws it.
4. Map calculation time to display position
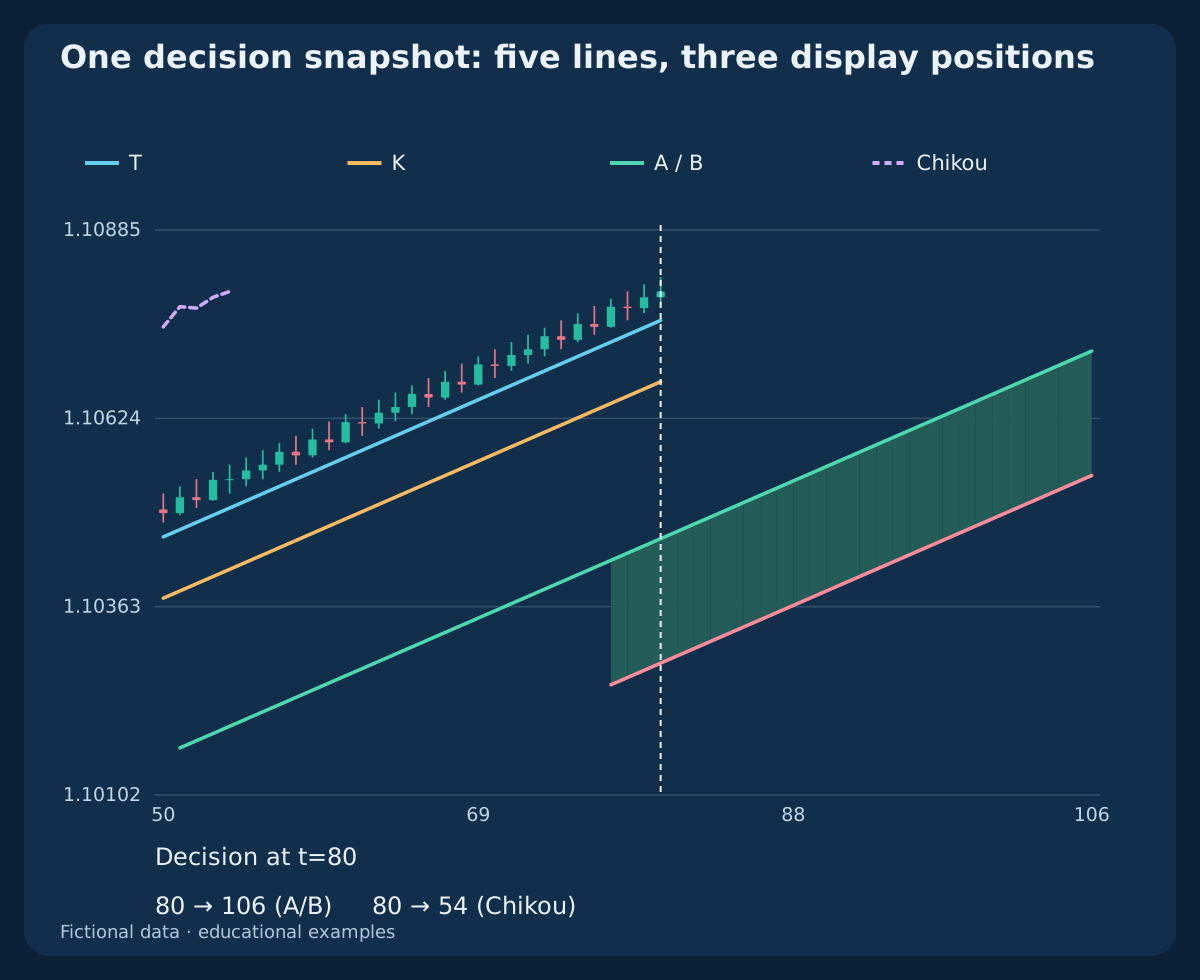
At chart position x, A_plot[x] = A_calc[x−d]; B_plot[x] = B_calc[x−d]. Conversely, the spans calculated at t are drawn at x = t + d. Moving the drawing does not add any price observations from those future positions.
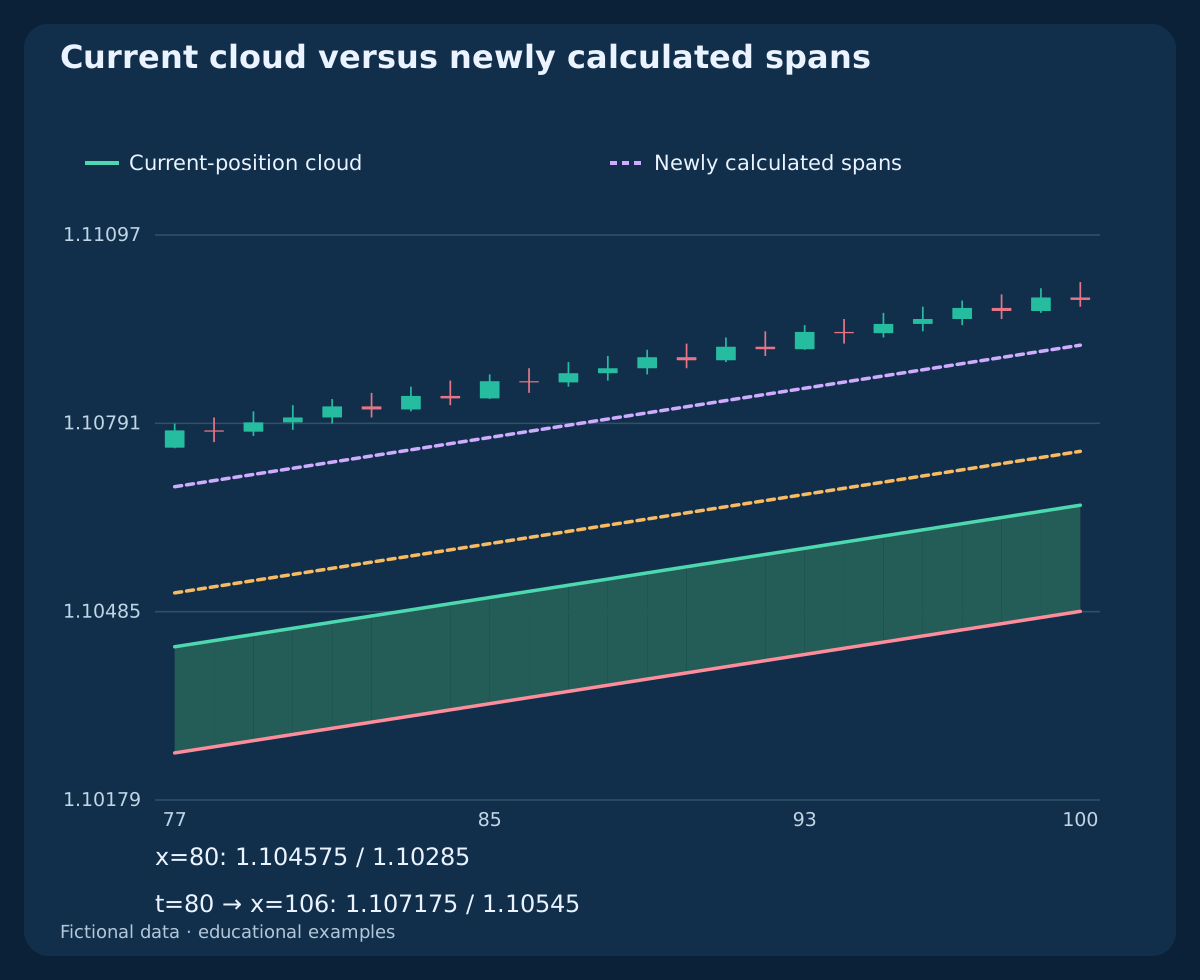
In the constructed trend, the spans calculated at t = 80 are A = 1.107175 and B = 1.10545, drawn at x = 106. The cloud at x = 80 instead comes from t = 54: A = 1.104575 and B = 1.10285. These are different pairs, both already known at t = 80.
| Calculation t | Close[t] | A_calc[t] | B_calc[t] | Display x=t+26 |
|---|---|---|---|---|
| 54 | 1.10540 | 1.104575 | 1.10285 | 80 |
| 80 | 1.10800 | 1.107175 | 1.10545 | 106 |
5. Compare price with the cloud at the same position
Define the current upper boundary as U[t] = max(A_plot[t], B_plot[t]) and the lower boundary as L[t] = min(A_plot[t], B_plot[t]). Above means Close[t] > U[t]; below means Close[t] < L[t]. This guide treats equality with either edge as boundary contact, not a strict breakout.
Between the edges is the cloud interior. If A equals B, the cloud has zero width and no interior at that position. Comparing the current close with A_calc and B_calc asks a different question about newly calculated spans; do not silently substitute it for the current-cloud test.
6. Separate cloud color, width and a new twist
At one display position, A above B gives one cloud orientation and A below B gives the other. A different color ahead can coexist with a different orientation under the current price. Color is a relative state of the two boundaries, not a measured probability that price will move in that direction.
A fresh upward twist in calculation space requires A_calc[t−1] ≤ B_calc[t−1] ∧ A_calc[t] > B_calc[t]. It is recognized at t and drawn at t+d. Width is the absolute difference between the boundaries; neither a wide cloud nor a twist guarantees that an eventual price crossing will hold.
7. Read Chikou without importing a future close
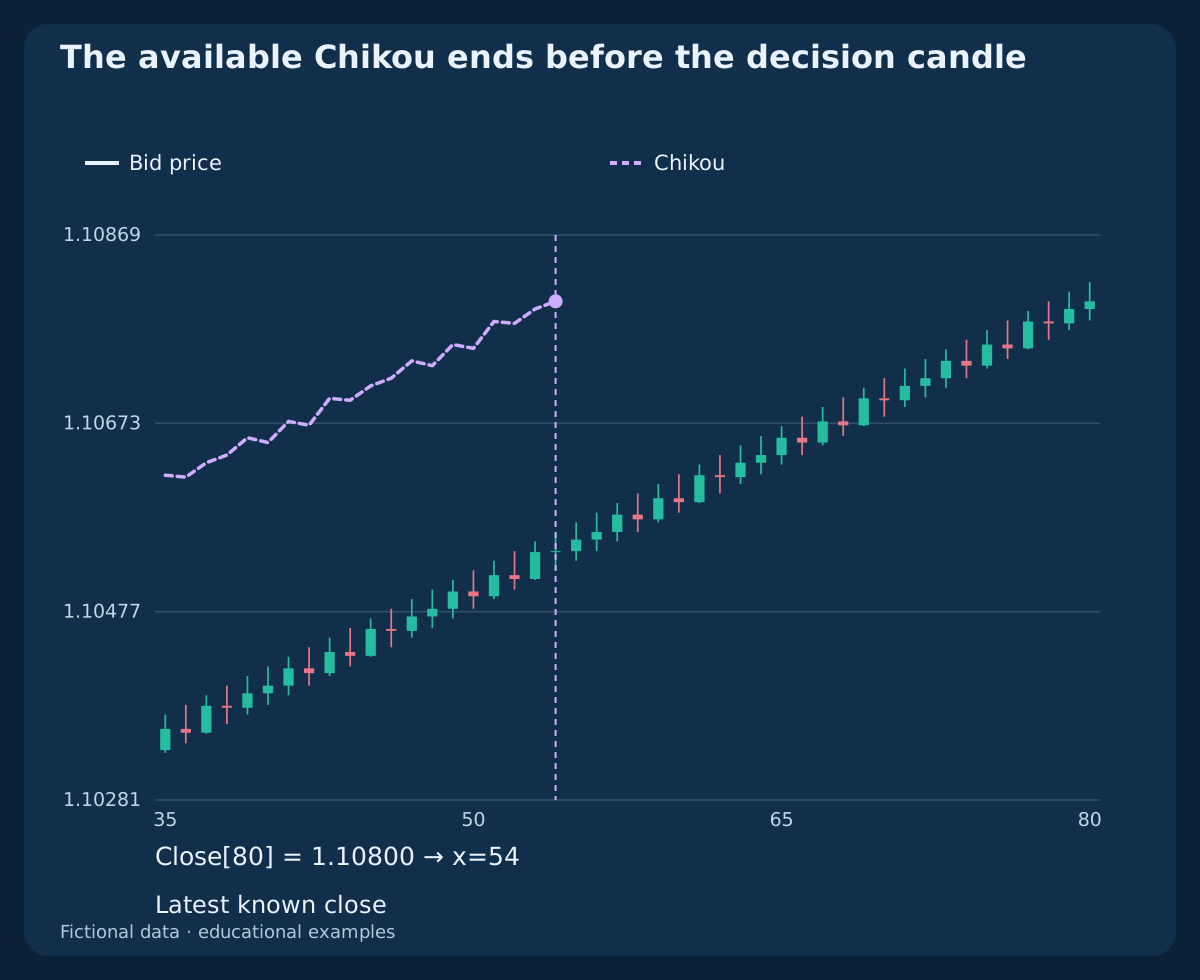
The declared mapping is Chikou_plot[x] = Close[x+d]. At decision time t, the latest known Chikou point is therefore drawn at x = t − d. At t = 80, Close = 1.10800 is drawn at x = 54. A completed historical chart can later show more Chikou points than were available then.
Reading Chikou_plot[80] in the finished dataset would use Close[106], which was unknown at t = 80. A causal comparison such as Close[t] > High[t−d] uses available data and means the latest close is above that whole earlier candle. Comparing with its close is a different test, and one cleared candle does not prove a clear path through all intervening candles.
8. Allow history for both calculation and alignment
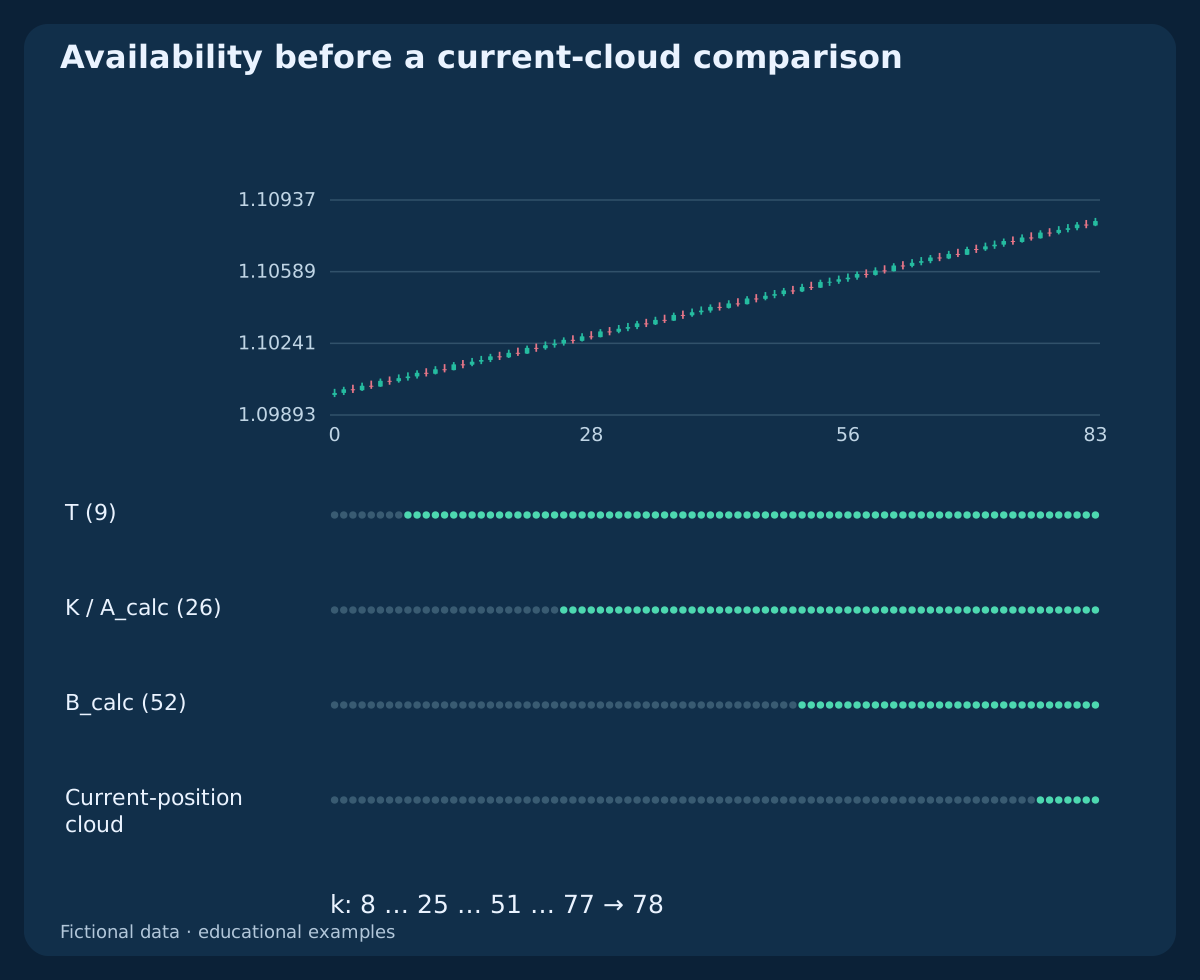
With zero-based indexing and complete windows, the first Tenkan is at k = 8, Kijun and A_calc at k = 25, and B_calc at k = 51. No seeded EMA or recursive warm-up is needed for these rolling midpoints.
With the exact 26-step offset, the first fully available current cloud is at k = 77. A price/current-cloud crossing requiring the previous pair can first be tested at k = 78. A T/K crossing needs two valid pairs and can first be tested at k = 26. These are availability limits, not guaranteed events.
9. Define a fresh T/K cross, equality and missing data
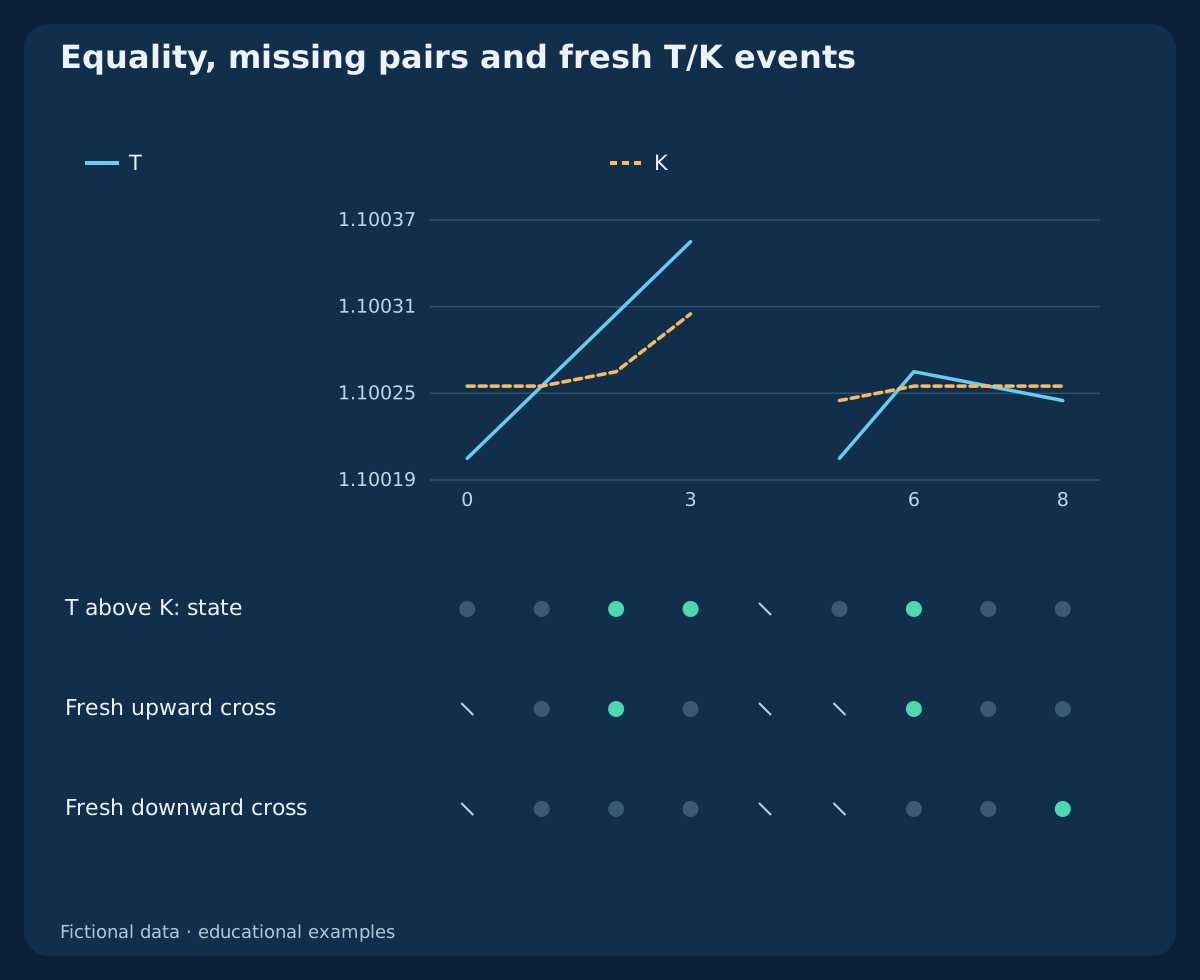
A fresh upward T/K cross requires T[t−1] ≤ K[t−1] ∧ T[t] > K[t]; a fresh downward cross requires T[t−1] ≥ K[t−1] ∧ T[t] < K[t]. Current equality is not a cross. Remaining above K is a state, not another upward event.
The separate nine-pair CSV deliberately includes equality and a missing pair. Upward events occur at k = 2 and k = 6, and the downward event at k = 8. Do not bridge the gap or reuse an old cross because a cloud filter becomes acceptable later. A new entry rule must say when all its conditions must coexist.
10. See a midpoint move while every close stays fixed
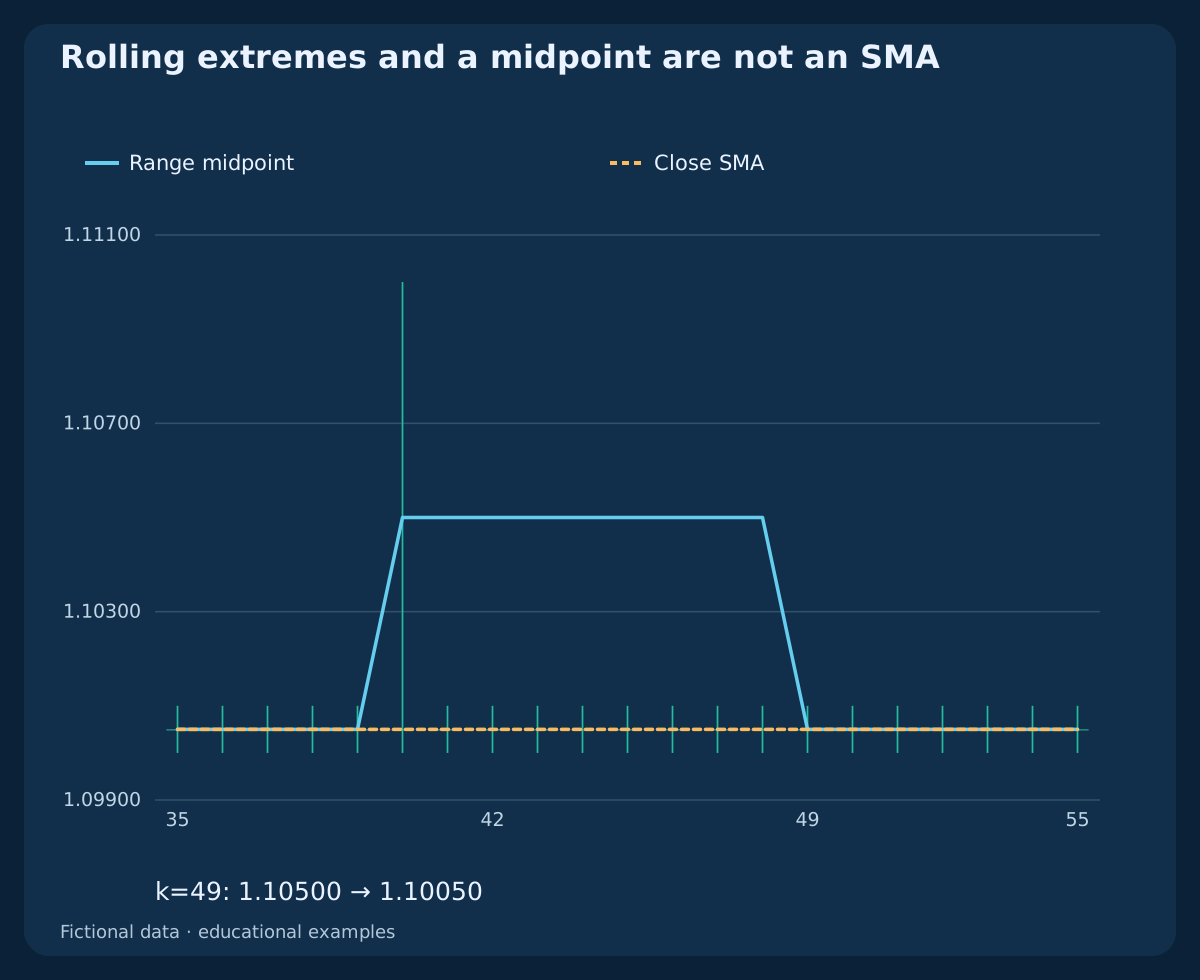
In the roll-off history every close is 1.10050. One high at k = 40 is 1.11000; all other highs are 1.10100 and all lows 1.10000. That exceptional high remains in the nine-candle window through k = 48 and leaves at k = 49.
Tenkan consequently changes from 1.10500 → 1.10050 while the closing price does not move. The rolling extreme has expired. Flat segments and steps can come from window membership, so a changing line alone does not demonstrate new buying or selling pressure.
11. Compare settings on a shared valid interval
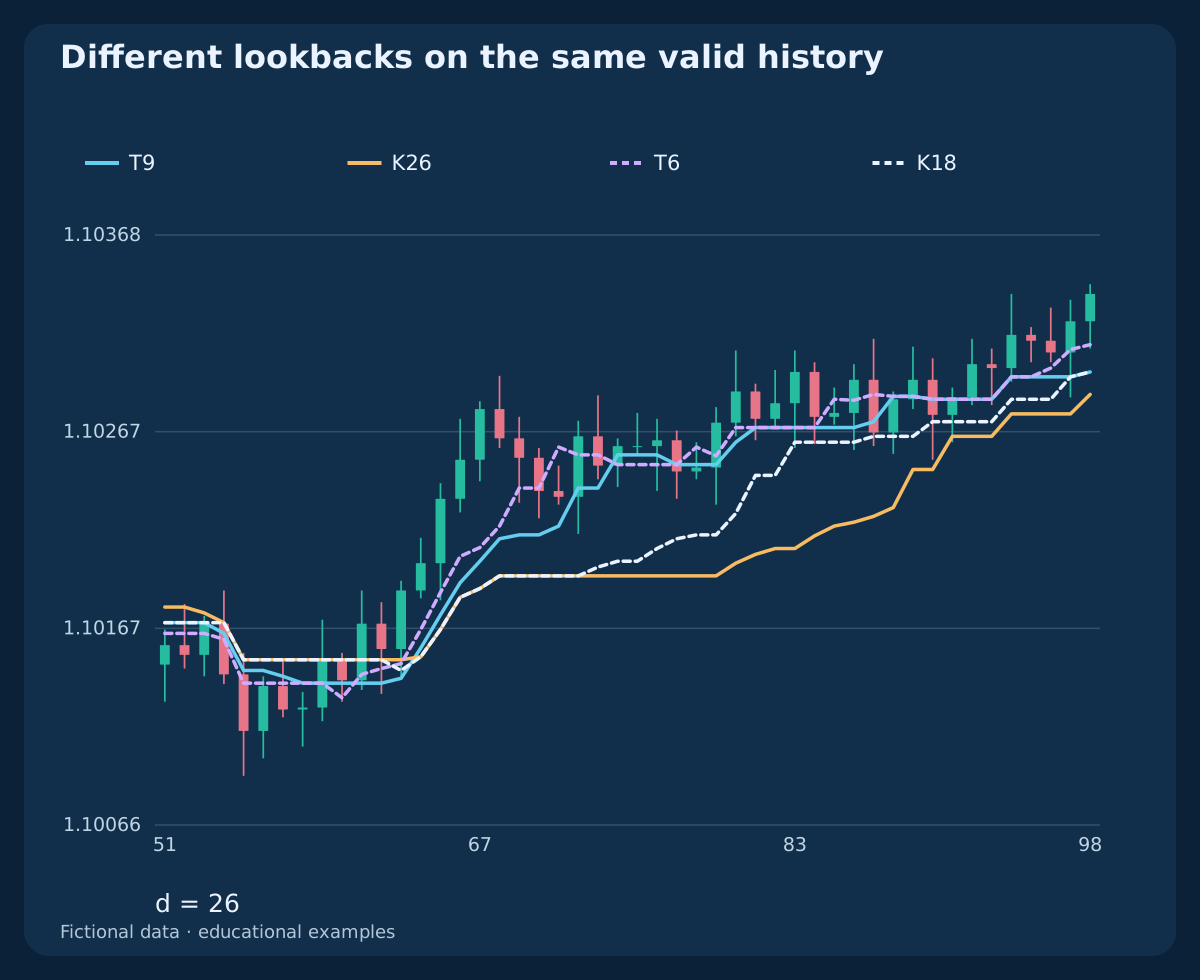
The illustrative comparison uses (9, 26, 52) and (6, 18, 36), holding the exact display offset at 26 for both. It shows Tenkan and Kijun on the same oscillating history after all needed windows exist. Changing lookbacks changes the question being measured; shorter is not automatically better.
Some platforms link the cloud shift to the Kijun input, so this isolated arithmetic comparison may need a custom calculation. If both length and displacement change, disclose both. Choose parameters before evaluation and reserve independent data rather than selecting the nicest historical picture.
12. Handle trend, range and timeframe context
Price can remain above or below the cloud while T and K cross repeatedly. In a range, a succession of small crosses can add costs without establishing a durable trend. A Kijun touch or a cloud edge is a reference location, not a guaranteed support or resistance fill.
For multiple timeframes, use only the last completed higher-timeframe candle at the decision time. At 10:05 UTC, an H1 candle covering 10:00–11:00 is unfinished; its final close is not yet available. Match actual timestamps and session calendars rather than copying the nearest visible higher-timeframe value.
13. Check platform buffers and freeze the decision snapshot
MetaQuotes documents five iIchimoku buffers: 0 = T; 1 = K; 2 = A; 3 = B; 4 = Chikou. A buffer number, a time-series index and a plot offset are different things. The official example adjusts Senkou copying for its forward shift and treats Chikou separately.
Do not apply a second shift by habit. Export one known completed candle, its calculation timestamp, its buffer value and its plotted position; reconcile them with the declared equations. At each decision, save only values already available then. A historical Chikou picture and an unfinished candle can otherwise make a test look more informed than it was.
14. Separate a closed-bar observation from execution
An indicator event is not a complete trading strategy. Entry timing, invalidation, stop, exit, position sizing and cancellation need explicit rules. A close observed at the end of a Bid candle does not guarantee an order fill at that exact quote.
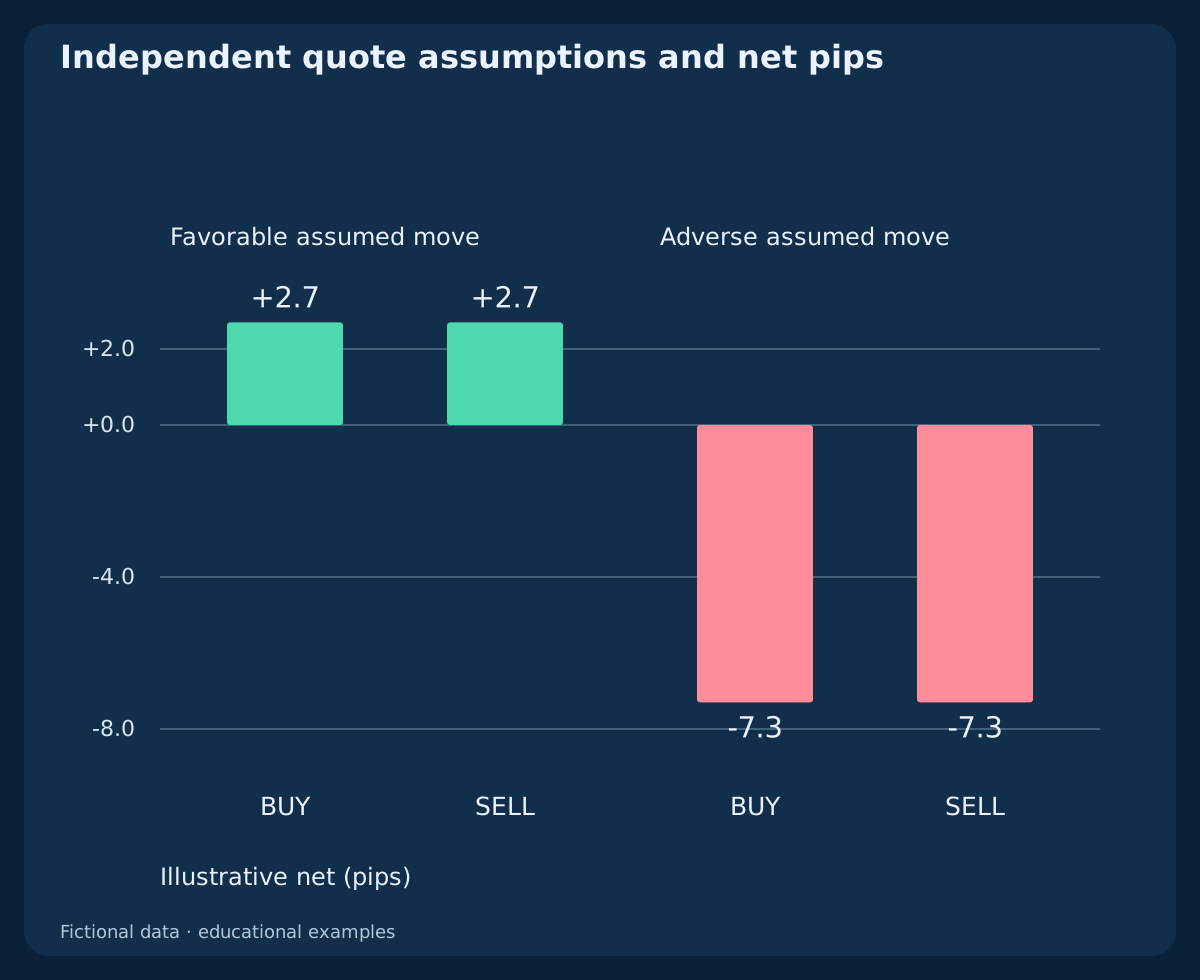
The independent cost cases assume a 5-pip favorable or adverse Bid move, spread 1.2 pips, adverse entry slippage 0.3, exit slippage 0.2 and round-trip commission 0.6. Favorable BUY and SELL net +2.7 pips; the adverse examples net −7.3 pips. Spread is included once through executable quotes. These assumed cases are not Ichimoku-generated trades.
15. Reproduce the CSVs and test information availability
The first CSV contains 480 fictional H1 OHLC rows in four separate histories, rolling midpoints, calculated spans and the current-position cloud for the declared offset. Blank fields mean unavailable history. The nine supplied T/K pairs and four independent cost cases have separate files and must not be spliced into an OHLC backtest.
Recalculate each row from its own past window, then truncate the input at each decision and compare the available result with the full-history calculation. Future OHLC changes must not alter a past decision. Keep display indices separate from knowledge indices, retain price precision, and document missing observations and equality handling.
Download fictional H1 OHLC, Ichimoku midpoints and aligned spans (CSV)
Download supplied T/K pairs, equality and fresh events (CSV)
16. Build a reading checklist before building a strategy
Record the feed, timeframe, three lookbacks, exact offset, last closed candle, current-cloud edges, latest calculated spans and the timestamp of the known Chikou point. Declare whether a condition is a state or a fresh event, and which conditions must be true on the same candle.
This guide explains the instrument rather than demonstrating a profitable system. Test an explicit rule with realistic costs, out-of-sample data and adverse conditions before assigning it any trading significance. The related cloud strategy has its own entry object; a fresh T/K-cross strategy must be specified separately.
Frequently asked questions
Does a cloud drawn ahead predict future prices?
No. Its points use observations available when the spans were calculated. Their future display position does not contain future OHLC.
Are Tenkan and Kijun moving averages of closing prices?
They are midpoints of rolling high–low extremes in this construction. They can stay flat while closes move, or step when an old extreme leaves.
Which cloud should I compare with the current close?
Use the two boundaries drawn at the same candle position. Newly calculated spans are a separate pair displayed ahead under the declared offset.
Why can a Chikou backtest accidentally use future data?
A point drawn at an old index contains the close from a later index. Associate it with the time that later close became available.
Does 9/26/52 guarantee identical charts across platforms?
No. Verify the feed, candle boundaries, high/low windows, exact displacement, indexing and available history. A matching input label is insufficient.
Is every T/K cross outside the cloud a complete strategy?
No. You still need a precise event and filter clock, executable entry, invalidation, exits, risk sizing and independent evaluation.
Sources and calculation notes
TradingView documents the components and displaced display; MetaQuotes documents the iIchimoku buffers and shifted-copy example. The exact 26-step reference convention, fictional histories, causal alignment checks and assumed costs are original educational calculations. Installed platform behavior needs separate verification.
- TradingView: Ichimoku Cloud components and calculations
- MetaQuotes: iIchimoku buffers and displacement example
Educational guide. Fictional OHLC and independent assumed quotes; no historical backtest, measured edge or guaranteed outcome.