

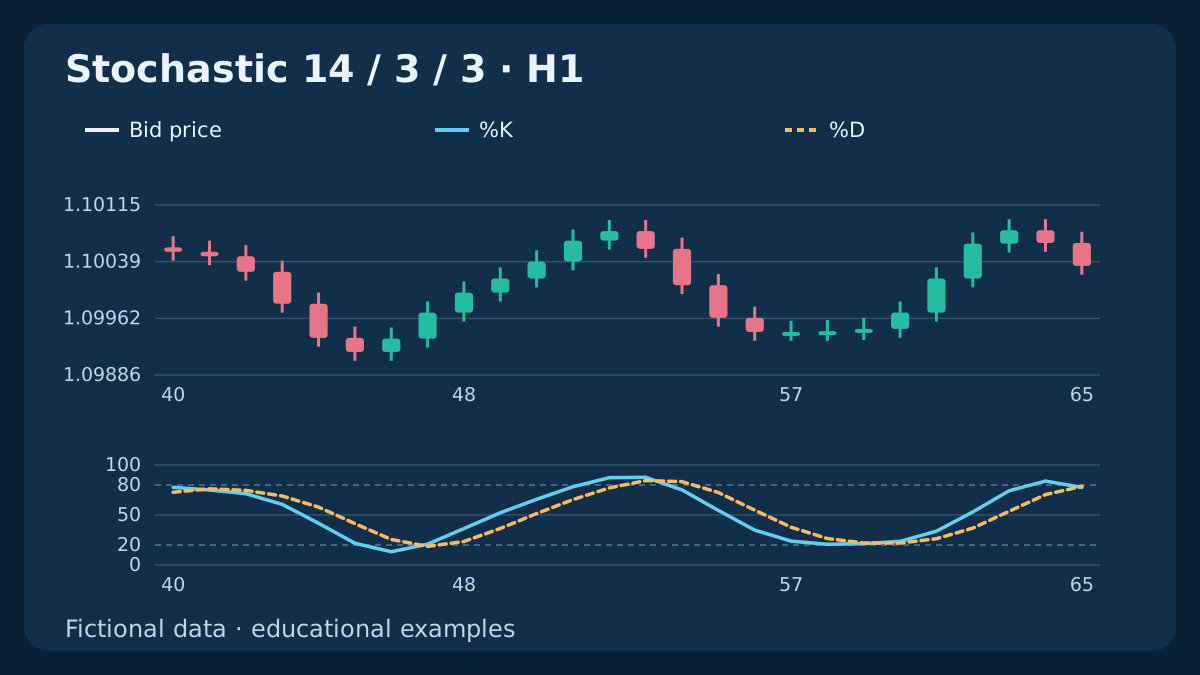
Stochastic answers a location question: where did a candle close inside its recent high–low range? A reading near 100 is not a probability of a fall. Before interpreting a cross, identify the price field, smoothing method and completed candle. This guide separates these choices with reproducible fictional examples.
1. Define the price and rolling window
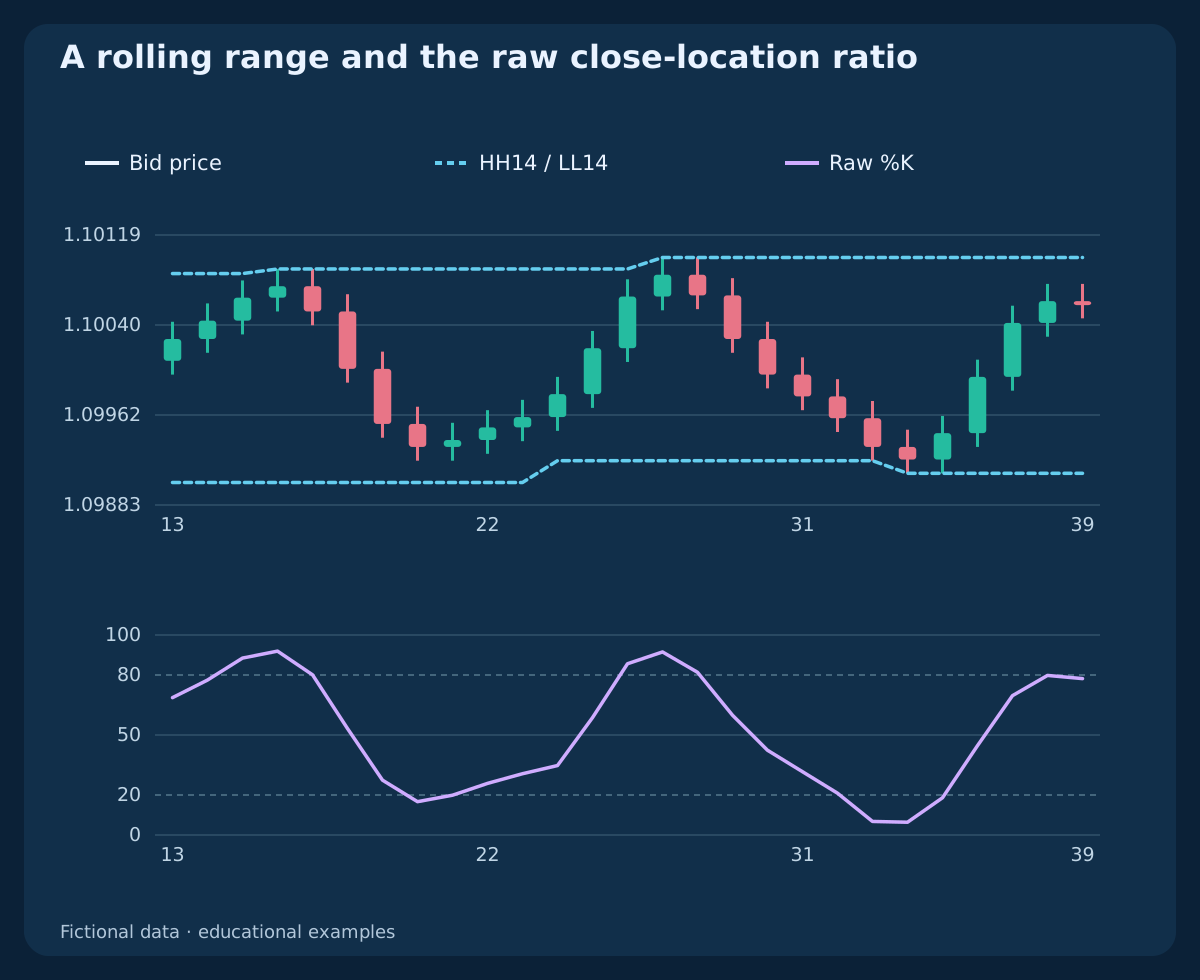
For a high/low Stochastic, take the current completed candle and the preceding candles in the declared window. With n = 14, that is 14 candles in total, including the candle being measured. The range is not a fixed support/resistance box: it changes as candles enter and leave.
The examples use fictional H1 Bid OHLC and chronological indices k = 0, 1, 2, …. A close is one observation, not an executable BUY price. A different broker feed, session boundary or Close/Close price field can change the indicator even when the displayed periods match.
2. Calculate raw %K as a location ratio
Let L = min(Low, n) and H = max(High, n). The unsmoothed value is R = 100 × (Close − L) / (H − L). For a valid nonzero range, the close lies between its high and low, so this ratio lies between 0 and 100.
A separate hand example uses L = 1.1000; H = 1.1040; Close = 1.1030, giving R = 75. That means a close three quarters of the way up this range. It means neither 75 pips of momentum nor a 75% chance of a reversal.
3. Name fast, slow and full settings precisely
One common construction uses K = SMA(R, s) and D = SMA(K, d). Here n is the range length, s smooths raw %K and d smooths the displayed %K into %D. With s = 1, K equals the raw ratio. Smoothing can reduce small fluctuations while delaying or merging crossings.
This guide writes its educational configuration as (n, s, d) = (14, 3, 3). MetaTrader’s iStochastic arguments instead put the periods in (Kperiod, Dperiod, slowing) order. Write the parameter names, price field and averaging method in a test record; the words fast, slow and full are not a complete specification.
4. Check how the platform applies slowing
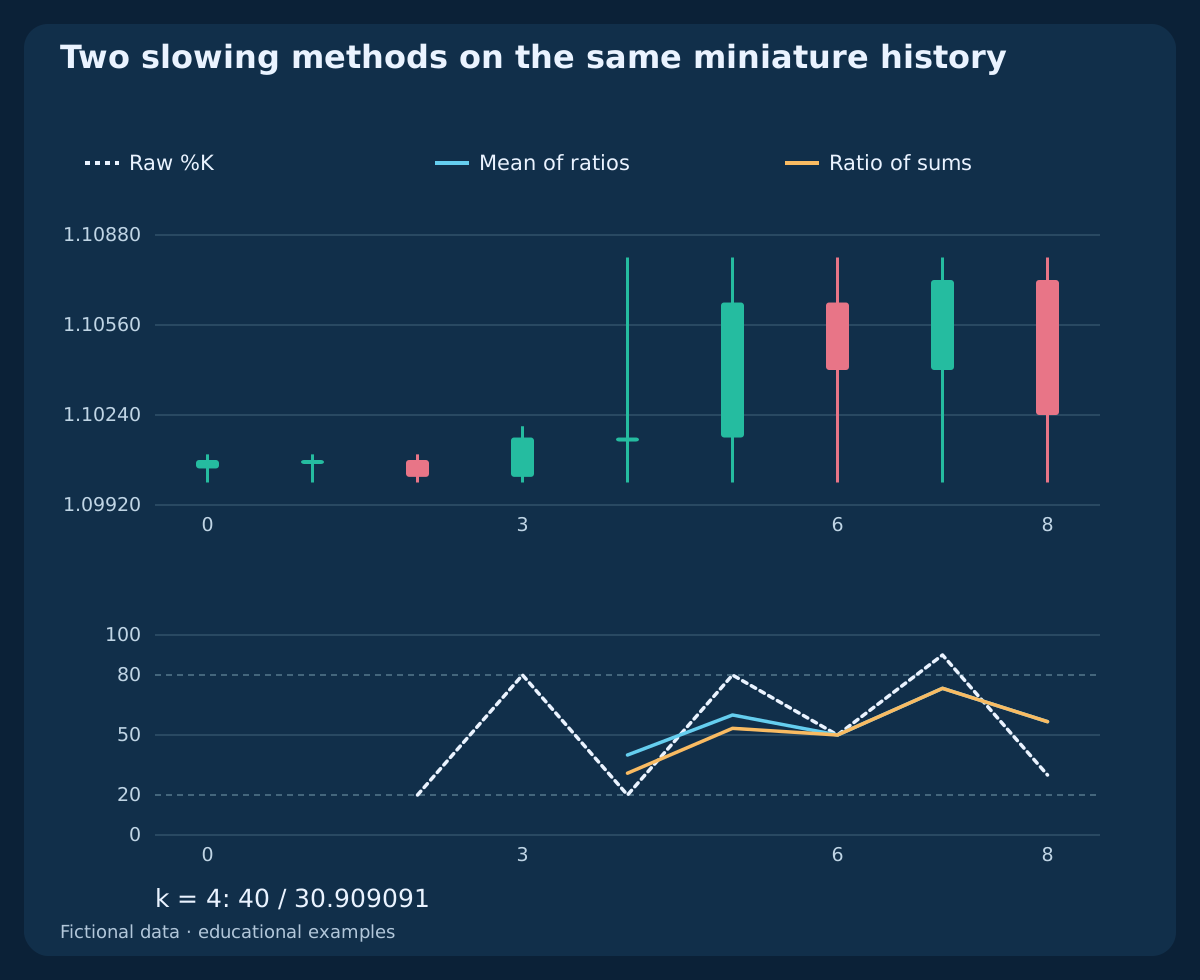
TradingView documents %K as an average of raw ratios. The published MetaQuotes MT4 example instead calculates the slowed main line as K_MT = 100 × Σ(Close − L) / Σ(H − L), summing over s bars, with each bar using its own rolling range. That is a range-width-weighted average of the raw ratios, rather than their ordinary mean.
In the supplied miniature example, n = 3; s = 3. At indices k = 2, 3, 4, the range widths are 10, 20, 80 pips and the raw readings are 20, 80, 20. Their simple average is 40; the ratio of sums is 100 × 34 / 110 = 30.909091. Check the exact installed implementation before expecting terminal parity.
| k | Raw %K | K: SMA | K: ratio of sums | D: SMA | D: ratio of sums |
|---|---|---|---|---|---|
| 2 | 20.000000 | — | — | — | — |
| 3 | 80.000000 | — | — | — | — |
| 4 | 20.000000 | 40.000000 | 30.909091 | — | — |
| 5 | 80.000000 | 60.000000 | 53.333333 | — | — |
| 6 | 50.000000 | 50.000000 | 50.000000 | 50.000000 | 44.747475 |
| 7 | 90.000000 | 73.333333 | 73.333333 | 61.111111 | 58.888889 |
| 8 | 30.000000 | 56.666667 | 56.666667 | 60.000000 | 60.000000 |
5. Keep zero ranges and missing values explicit
If H − L = 0, every price in that range is the same and the raw location ratio has no defined denominator. The reference CSV leaves it empty. For both educational slowing methods, a window containing an undefined raw reading also remains unavailable; this is a declared research convention.
A platform can use a different fallback, so a visible terminal number is not proof of useful information in a flat window. Do not replace missing values with 0 or 50 to manufacture an event, and do not join observations across a data gap as though they were adjacent completed candles.
6. Allow enough history before comparing lines
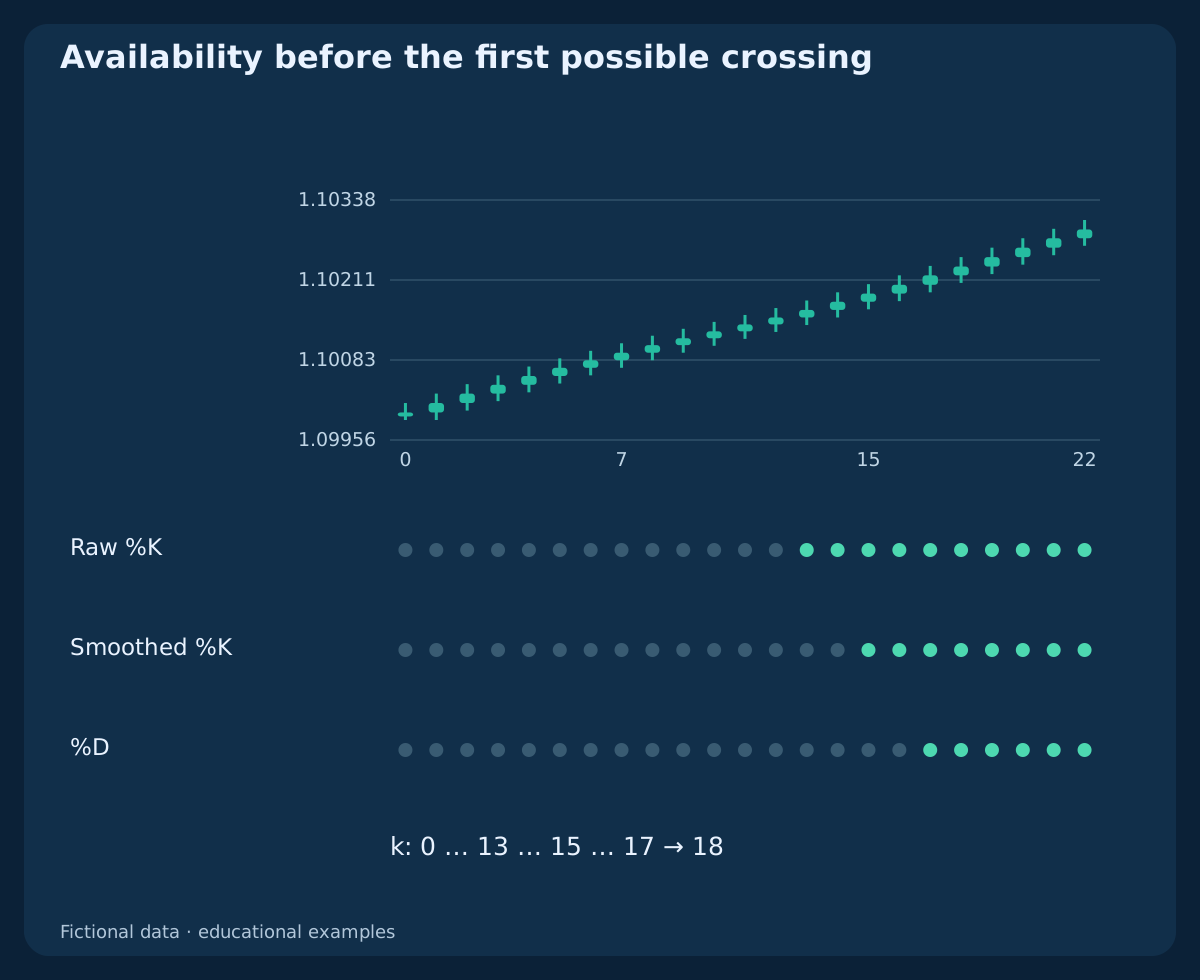
Using zero-based indices, the first raw value is at k = n − 1, the first smoothed K at k = n + s − 2 and the first D at k = n + s + d − 3, assuming all required ranges are valid. These are availability rules, not a promise that a trading signal exists.
For the declared 14/3/3 construction, the first values appear at k = 13, 15, 17. A fresh K/D crossing needs two adjacent available pairs, so its earliest possible index is k = 18. Do not label the first available K above D as a newly observed crossing.
7. Read 20/80 as states with context
The conditions K > 80 and K < 20 describe zones. They say where the smoothed close-location reading lies, not whether a trade should be opened. A range trader still needs a predeclared price boundary; a trend trader still needs an independent description of the price structure.
Entering the upper zone is a different event from remaining there. A fresh upward threshold crossing can be written K[t−1] ≤ 80 ∧ K[t] > 80. Leaving the zone is another event. Keep the chosen comparison and equality convention fixed instead of switching interpretations after seeing the next candle.
8. See why an extreme can persist in a trend
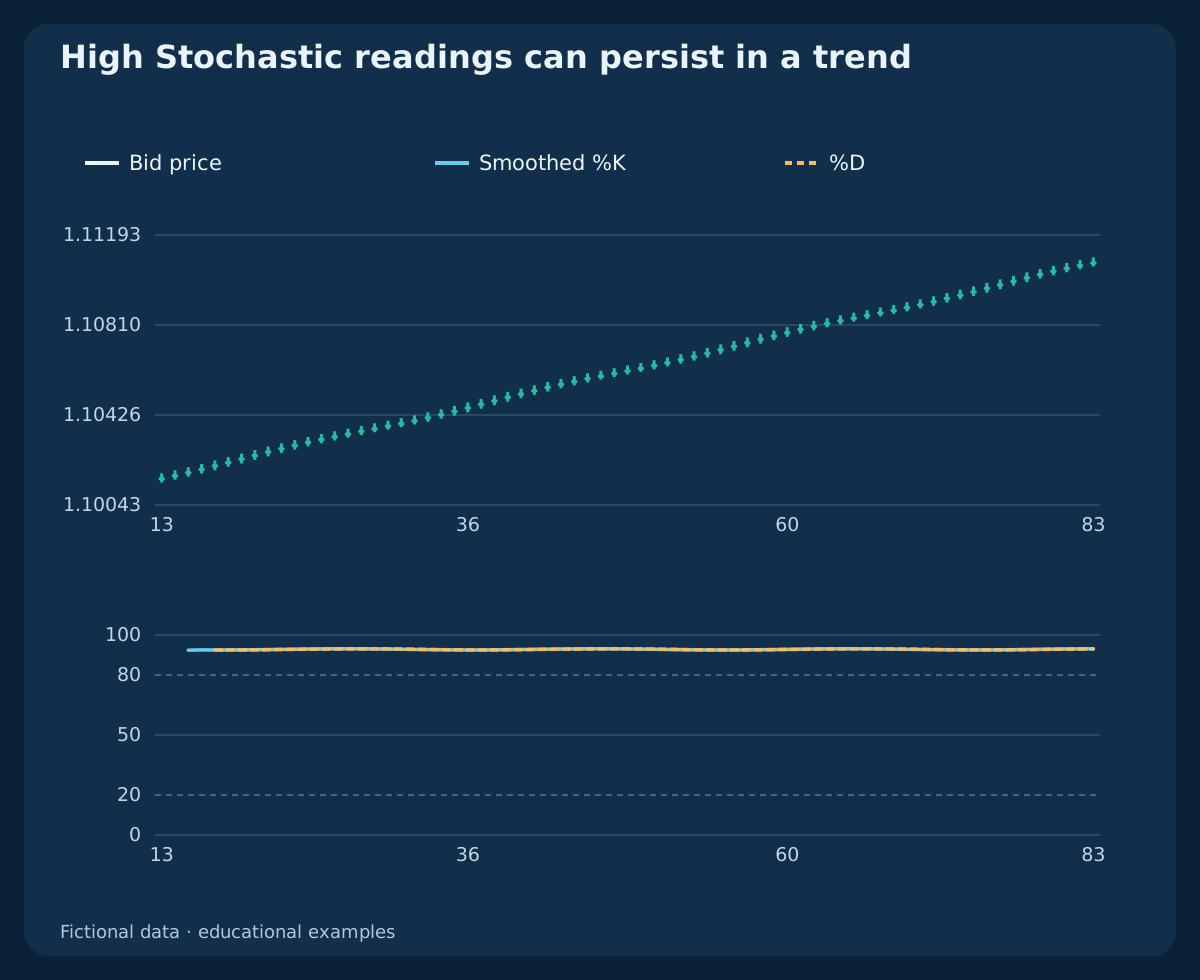
In the fictional rising-price history, K stays above 80 for 69 consecutive available readings. Price keeps closing near the upper part of a rising rolling range. Calling every one of those readings a sell signal would turn a descriptive condition into an unsupported reversal rule.
The chart is a counterexample to an automatic overbought entry, not evidence that buying an extreme is profitable. A reversal can still occur, but its timing, executable price, stop and exit cannot be recovered from an oscillator zone alone. The same limitation applies to prolonged low readings in a falling market.
9. Separate a fresh K/D cross from a continuing state
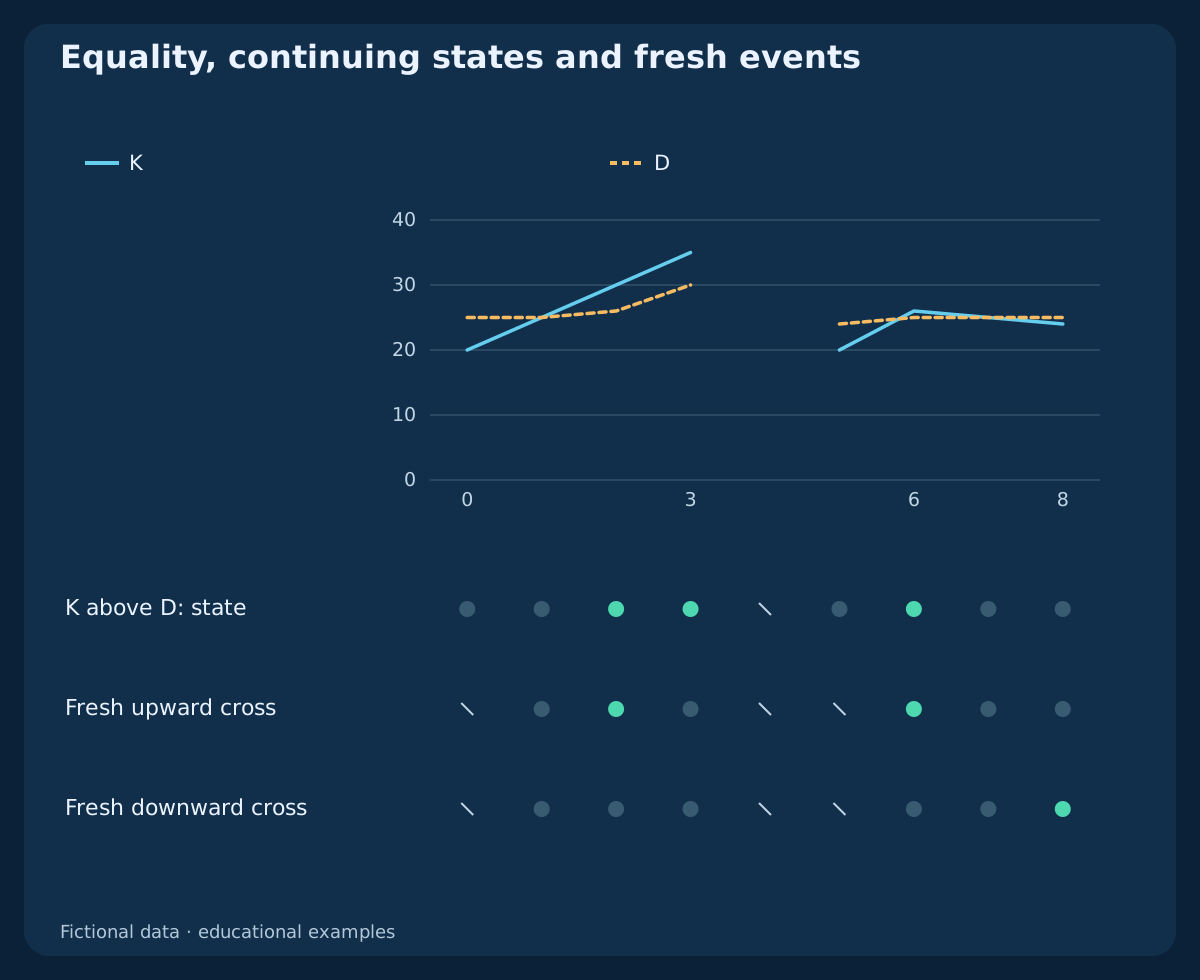
For adjacent completed observations, define an upward cross as K[t−1] ≤ D[t−1] ∧ K[t] > D[t]; a downward cross is K[t−1] ≥ D[t−1] ∧ K[t] < D[t]. Current equality is not a cross under these definitions. Test the unrounded values, because displayed equality can hide a small difference.
The independent event table includes equality, a continuing K-above-D state and a missing pair. It records upward events only at k ∈ {2, 6}, and a downward event at k = 8. These are supplied line observations for testing the predicate, not a fabricated OHLC backtest or order history.
10. Notice a changing oscillator at an unchanged close
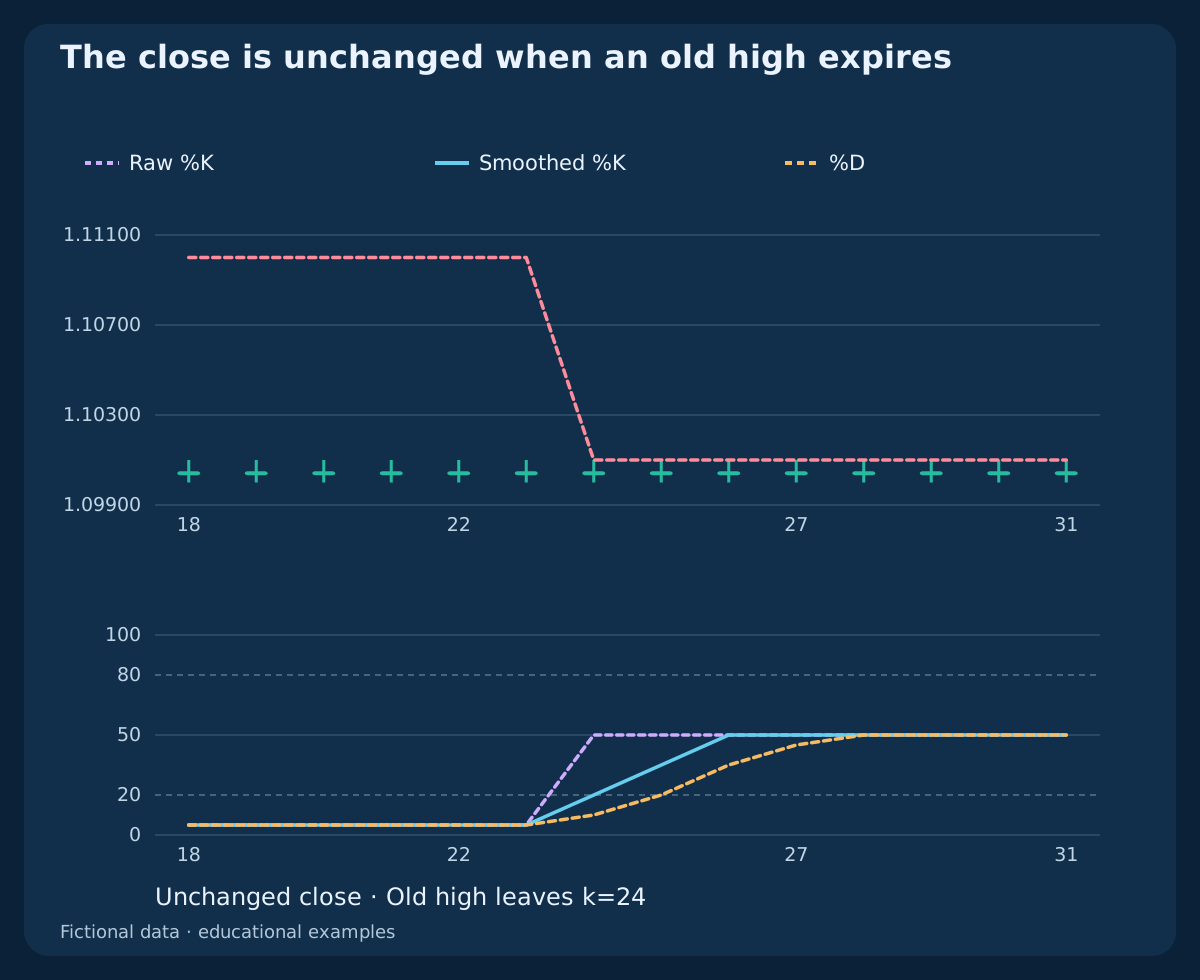
In the roll-off history, every Bid close is 1.10050. An older high at index 10 remains in the 14-bar window through k = 23 and leaves at k = 24. The raw reading changes from 5 → 50 without an increase in the closing price.
The slowed K then rises from 5 → 20 → 35 → 50. The arithmetic is valid: the denominator changed as an old extreme expired. This does not establish new buying pressure. Inspect both the rolling extremes and price before interpreting a turn as acceleration.
11. Compare settings over a common valid interval
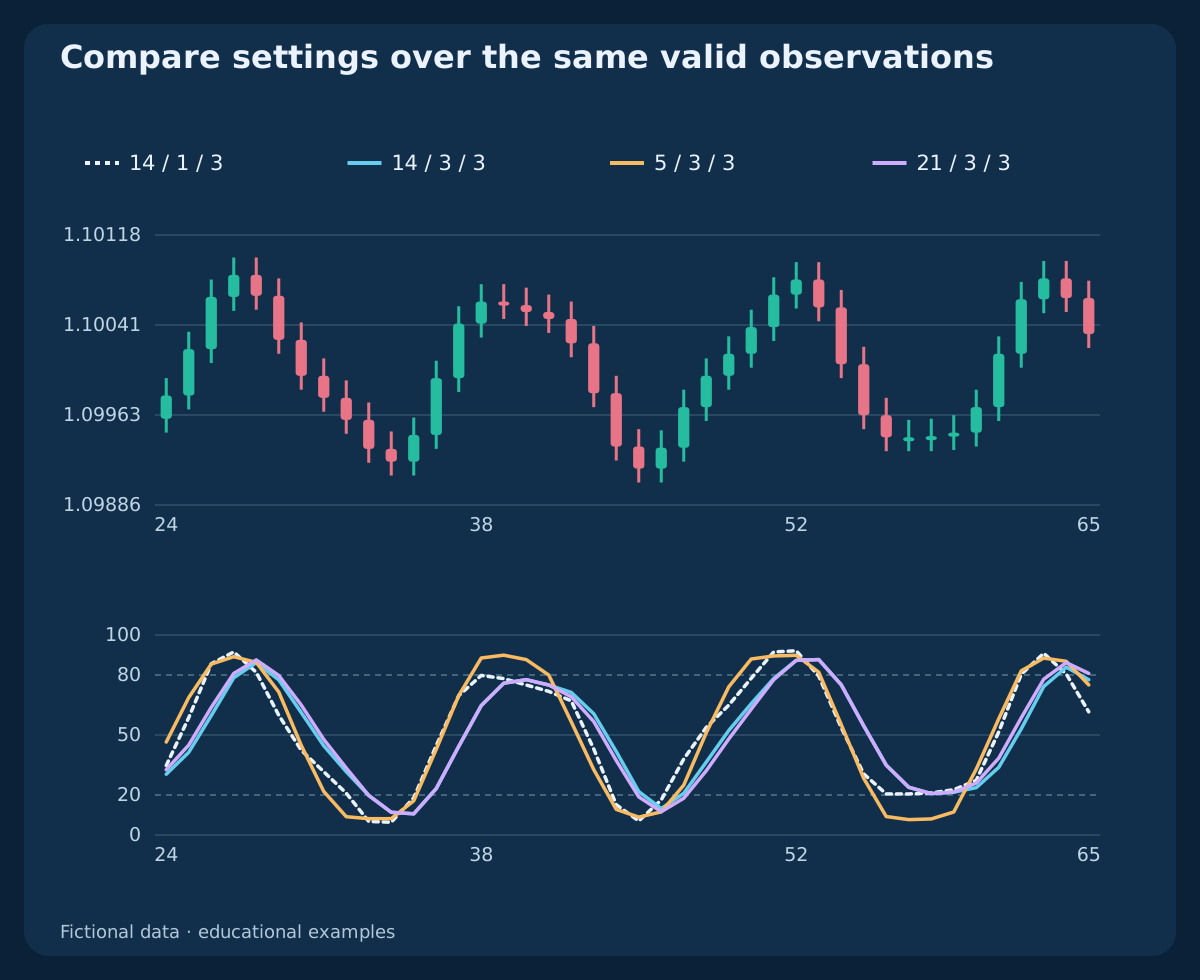
Shorter range lengths and less smoothing can produce different turns, but a more active line is not automatically a better signal. Compare one choice at a time: first hold n and d fixed while changing s; then hold s and d fixed while changing n. A parameter search needs an evaluation period kept out of that selection.
The comparison chart shows the same oscillating-price history using (14, 1, 3), (14, 3, 3), (5, 3, 3), (21, 3, 3). It starts at k = 24, when all corresponding D series are available. Count events only over the same observations and include identical cost assumptions in any later strategy test.
12. Distinguish divergence, RSI and Stochastic RSI
Stochastic normalizes price location within a rolling range. RSI compares smoothed upward and downward price changes. Stochastic RSI applies a range normalization to RSI values, so the three are not interchangeable. Agreement among related transforms of the same prices is not automatically independent confirmation.
A divergence comparison also needs a defined price swing and an availability time. A pivot requiring two later candles cannot be known on the pivot candle itself. Record when each swing becomes confirmed; an oscillator disagreement alone supplies neither a timely entry nor protection against a continuing trend.
13. Use completed candles and the correct quote side
A forming candle can change its Close, High, Low and both oscillator lines. A cross visible during that candle may disappear before it closes. In an automated implementation, distinguish the current forming buffer shift = 0 from the most recent completed buffer shift = 1, and synchronize both line reads to the same candle.
For example, at 10:05 UTC, an H1 candle covering 10:00–11:00 UTC is unfinished. The last completed H1 boundary is 10:00 UTC. A lower-timeframe decision must not use that H1 candle’s eventual close. Bid-based indicators also do not remove the Ask cost of opening a BUY or closing a SELL.
14. Separate an indicator event from trading costs
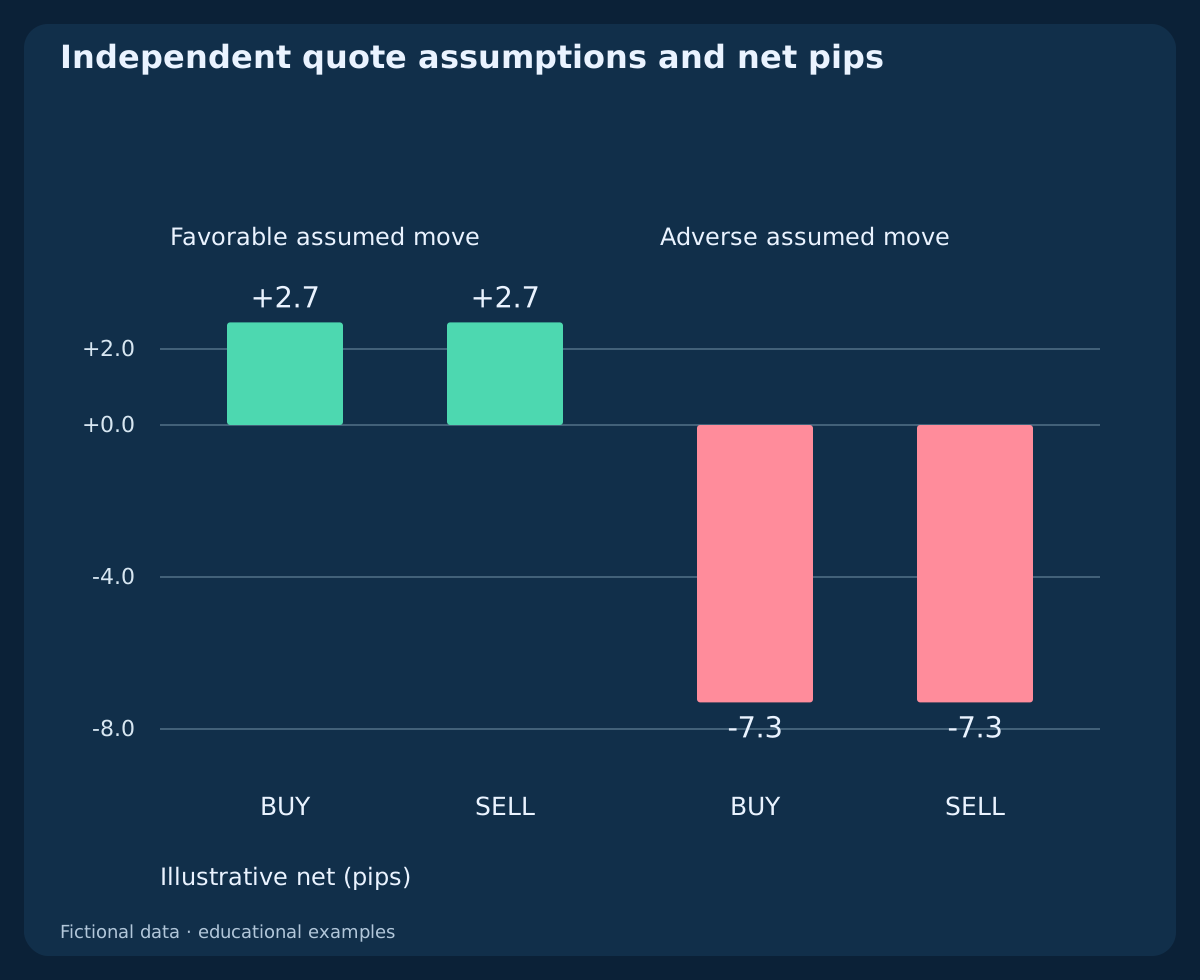
The four quote scenarios are independent assumptions, not trades generated by the indicator charts. Each uses a gross Bid-reference move of ±5 pips, spread 1.2 pips, adverse entry and exit slippage 0.3 + 0.2 pips and round-trip commission 0.6 pips. Spread is already represented by the executable quote sides; do not subtract it twice.
The favorable BUY fills at 1.10015 and closes at 1.10048: 3.3 pips before commission and 2.7 pips net. The mirrored SELL also nets 2.7 pips. The adverse cases net −7.3 pips. These examples show cost arithmetic only; they establish no win rate, expected return or executable edge.
15. Reproduce the examples before reading signals
The first CSV contains 253 fictional H1 OHLC rows: rising prices, oscillation, expiry of an old high, a completely flat history and a separate miniature 3-bar example. Columns preserve both slowing methods, multiple settings and availability. Empty cells mean unavailable values, not zero.
The second file contains 9 supplied K/D observation pairs for equality and missing-data checks; the third contains 4 independent assumed quote scenarios. Recalculate rolling extremes and smoothing before comparing events. Keep the miniature n=3 example separate from the main n=14 charts and do not treat any of these constructed histories as market evidence.
Download fictional H1 OHLC and both Stochastic slowing methods (CSV)
Download equality, missing-data and fresh-cross observations (CSV)
16. Evaluate a complete strategy separately
A testable strategy must add a market and timeframe, the event order, the first permitted executable quote, cancellation rules, position size, stops, exits and cost assumptions. Declare how stale signals, gaps and unavailable observations are handled before measuring results. An indicator guide does not replace those decisions.
Use representative historical Bid/Ask data, an untouched evaluation sample and forward observation when evaluating a real implementation. Report drawdown, adverse execution and parameter sensitivity alongside returns. The purpose of this guide is to make Stochastic readings reproducible, not to claim that one setting or crossing is universally best.
Frequently asked questions
Does Stochastic above 80 mean I should sell?
No. It is a high reading relative to the recent rolling range. It can persist while price trends upward. A reversal entry needs a separate, testable price and execution rule.
What do 14, 3 and 3 mean?
Write the parameter names. In this guide n=14 is the range length, s=3 smooths raw K and d=3 forms D. MetaTrader lists K period, D period and slowing in a different argument order.
Why can MetaTrader and TradingView disagree?
Their published constructions can apply slowing differently: an ordinary average of raw ratios versus a ratio of summed distances and ranges. Price fields, broker data, candle boundaries and averaging choices can also differ.
Is a closed-bar crossover guaranteed to work?
No. Closing the candle fixes the information time for that observation; it does not establish predictive value, an acceptable fill or a profitable strategy.
Can the oscillator rise while the closing price stays flat?
Yes. A high leaving the rolling window can narrow the range and raise the close-location ratio. The roll-off CSV demonstrates the change without an increase in the closing price.
What should I do with a zero range?
Record the indicator value as unavailable under a declared research policy and check your platform’s fallback separately. Never turn an undefined location ratio into a trading signal by silently filling it.
Sources and calculation notes
The two primary references document the published TradingView and MetaQuotes MT4 constructions. The fictional histories, availability rules, counterexamples and assumed quotes are original educational calculations. Installed platform behavior must be checked separately.
- TradingView: Stochastic calculation and smoothing inputs
- MetaQuotes: published MT4 Stochastic calculation and source
Educational guide. Fictional OHLC and independent assumed quotes; no historical backtest, observed orders, measured edge or guaranteed outcome.