

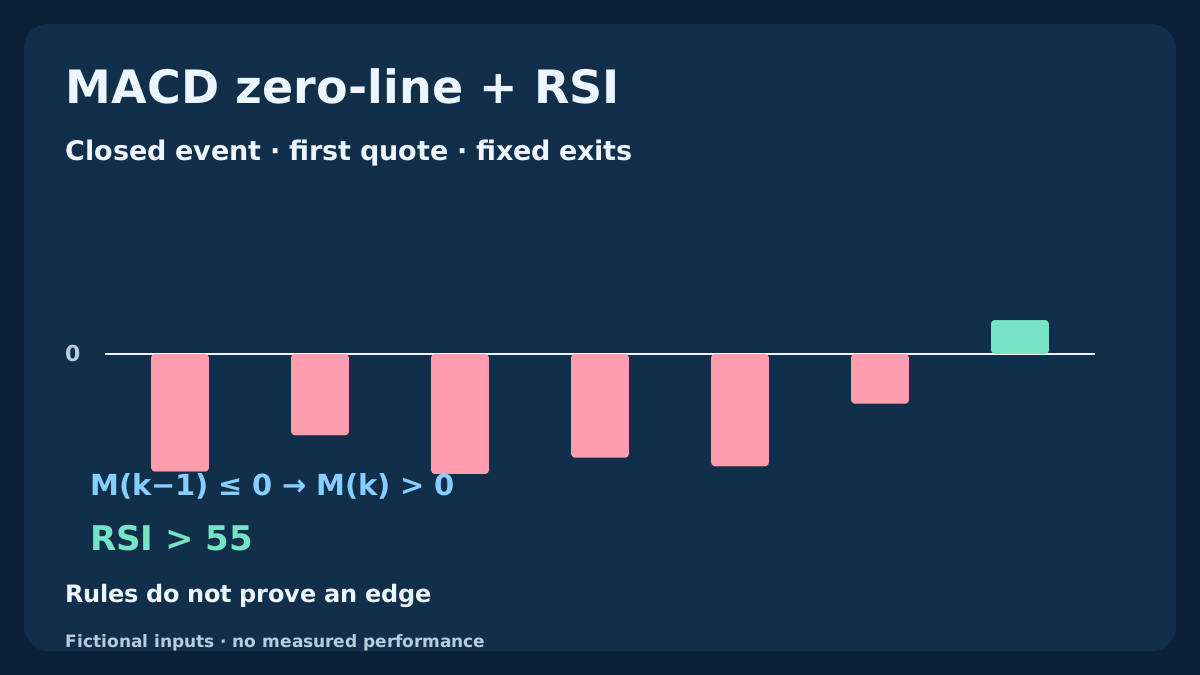
This long-only research model buys neither every positive MACD reading nor every rise in RSI. It requires a new MACD main-series cross above zero, RSI above its declared threshold on the same completed H1 candle, and an acceptable first executable quote. The charts separate the closed signal, a rejected event, the entry plan and the exit levels. All prices are fictional teaching inputs; no measured profitability is claimed.
1. Define the long-only hypothesis before looking at outcomes
The hypothesis is that a fresh change from nonpositive to positive MACD main values, with a sufficiently strong same-candle RSI, can identify a population worth testing for upward continuation. It does not establish an advantage. Both indicators transform overlapping price history, and both can lag a reversal. Clear rules allow a fair test; they cannot create independent evidence from the same prices.
This version studies EURUSD H1 BUY positions only. It has no short rule, averaging, pyramiding, automatic reversal or RSI-based early exit. The entry, stop, target, cost gate, sizing and time exit below belong to one frozen specification. Adding a trend filter or a different short model produces another version whose results must be recorded separately.
2. Fix the instrument, settings and eligible hours
Use Bid OHLC and Close for MACD 12/26 and RSI 14. The displayed MACD signal is a 9-value simple mean of valid main values; it does not enter the trigger. The research calendar permits new decisions Monday through Thursday when the completed candle's UTC boundary is at or after 06:00 and before 23:00. Broker candle boundaries must be mapped to actual UTC; a local clock label is insufficient.
Require at least 40 preceding completed candles and all declared readings before evaluating a candidate. A flat account state for this model is required: no open position, pending entry or unresolved earlier request. Missing history, stale state or an ineligible time means skip that event. These calendar and warm-up choices are explicit research settings, not evidence that they improve results.
| Item | Fixed specification | Function or boundary |
|---|---|---|
| MACD 12 / 26 / 9 | Close; main EMA difference; displayed SMA signal | Fresh main-series zero event |
| RSI 14 | Wilder reference; same completed candle | Strictly above 55 |
| Calendar | Monday–Thursday; 06:00 ≤ UTC hour < 23:00 | Eligibility only; no optimality claim |
| Execution | First quote; elapsed below 10 seconds | One request; frozen Bid exits |
3. Identify the MACD series that actually crosses zero
Define M(k) = EMA12(C)(k) − EMA26(C)(k). The classic MT4 main series is displayed as bars; the displayed signal is SIG(k) = SMA(M,9)(k). A separate main-minus-signal series is DIF(k) = M(k) − SIG(k). A zero crossing of DIF would be a main/signal crossover, which is a different event. Our trigger uses M itself.
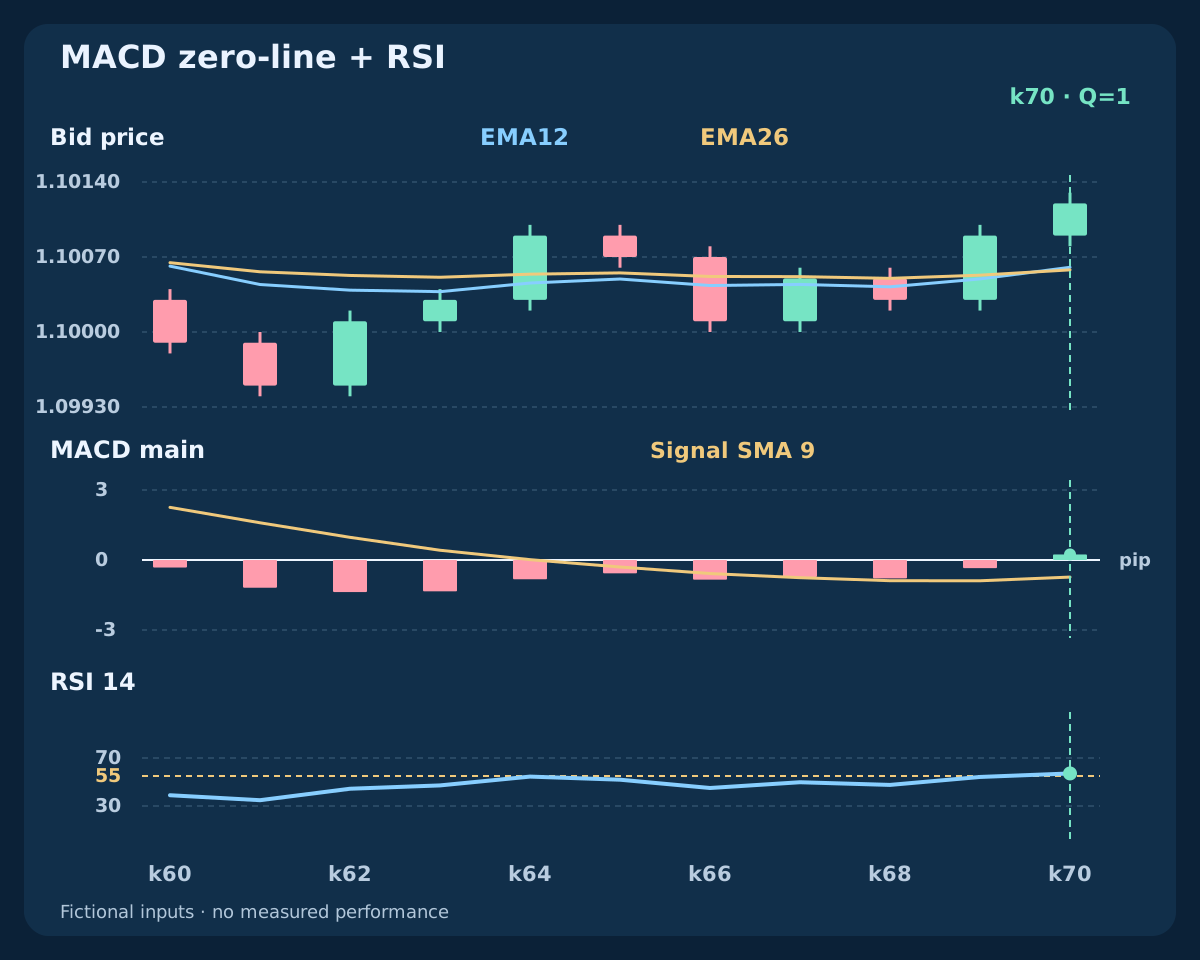
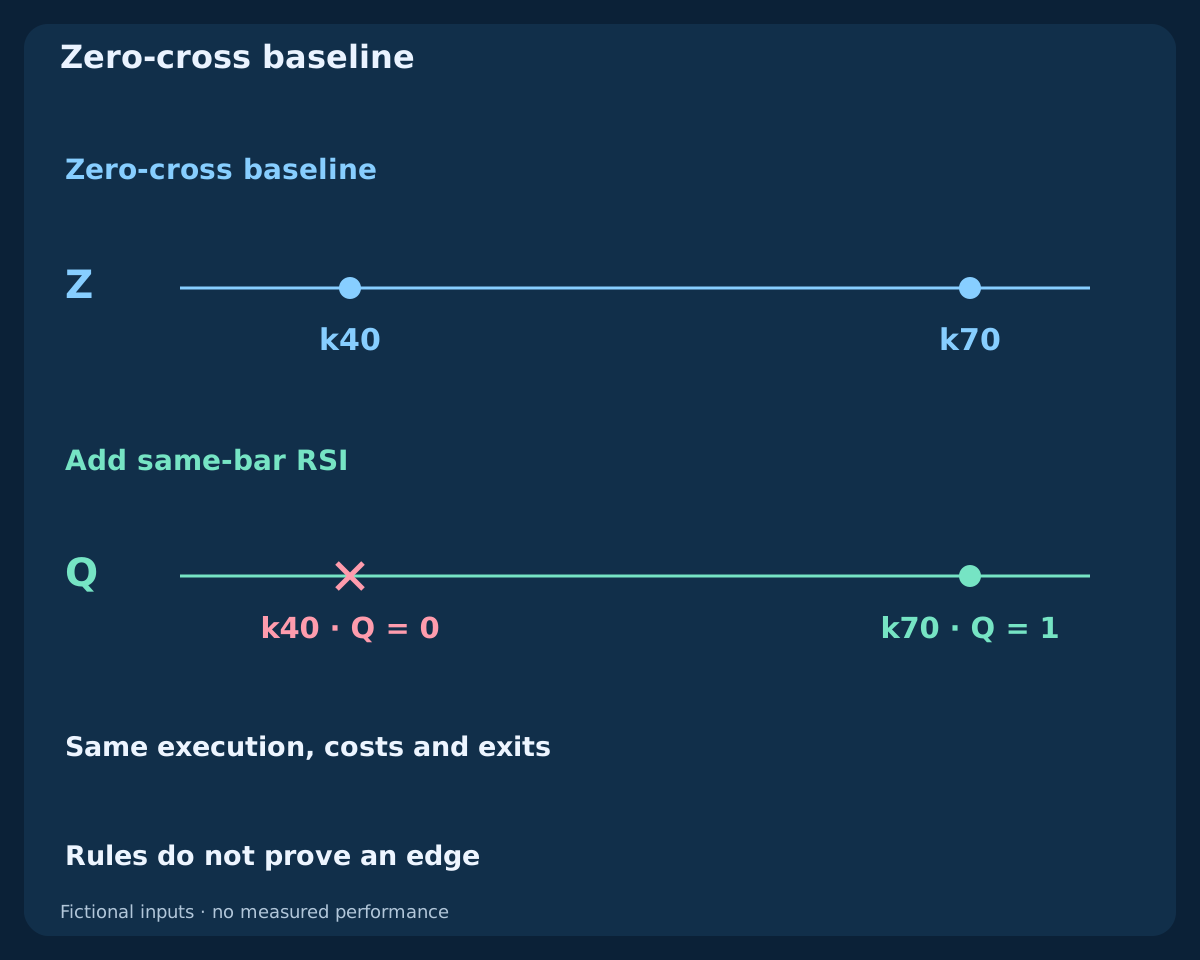
The aligned chart uses candles above, main bars with the signal line in the middle, and RSI below. All panes share the same completed bars. MACD is shown in pips only for readability; multiplying every main value by a positive conversion factor leaves its zero crossings unchanged. Do not compare these unnormalized magnitudes between different symbols or substitute another platform's histogram without identifying its formula.
4. Require a fresh event and its RSI condition together
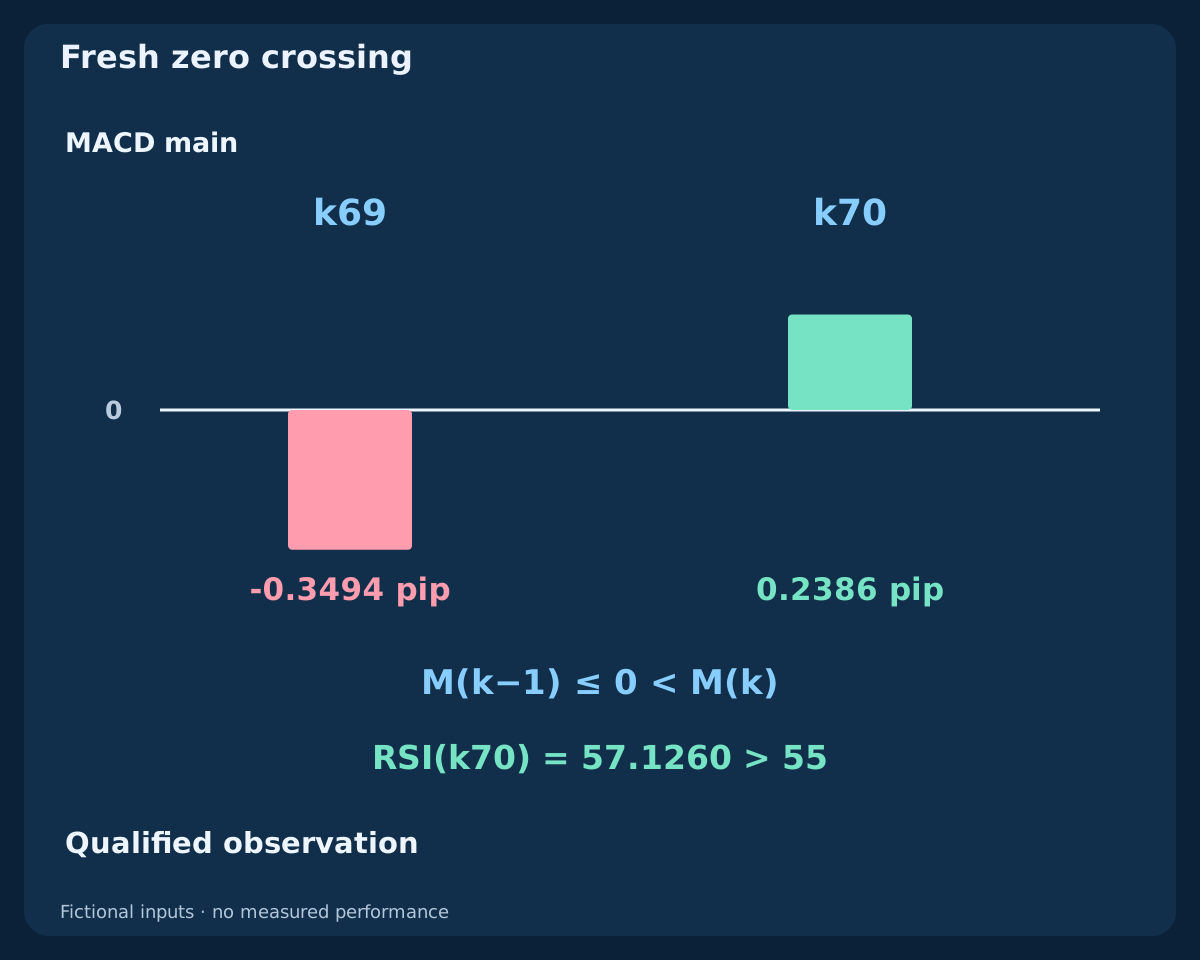
The fresh event is Z(k) = [M(k−1) ≤ 0] AND [M(k) > 0]. The qualified observation is Q(k) = Z(k) AND [RSI14(k) > 55]. Previous equality at zero permits a new crossing; current equality at zero does not. RSI exactly 55 fails. A new RSI threshold crossing is not required, only its state on that same completed candle.
An already positive main value is not another event. If RSI rejects Z, do not store it until RSI rises later. If RSI is missing, the decision is unavailable rather than a manufactured pass. Q establishes eligibility for the quote checks, not an order or a fill. A long-only definition also does not silently authorize a mirrored SELL rule.
5. Use completed data and declare the reference seeds
Evaluate only after the H1 close and availability of the next bar and required history. MT4 buffer shift 1 is the latest completed bar, shift 2 its predecessor and shift 0 is forming. Use MODE_MAIN for the MACD test, distinguish MODE_SIGNAL, and use PRICE_CLOSE. Intrabar color changes or wick crossings do not satisfy this completed-close model.
The teaching reference seeds each EMA with the simple mean of its first period, then uses EMA_n(k) = [2C(k) + (n−1)EMA_n(k−1)]/(n+1). RSI starts with mean gains and loss magnitudes over the first 14 changes and uses Wilder smoothing thereafter. Main is available from k25, its signal from k33, RSI from k14; decisions begin at k40. Zero gains and losses together make our RSI undefined. Different earlier history or terminal seeding may change values; terminal parity needs an actual comparison. Decide before rounding.
6. Set a first-quote window instead of waiting for a better signal
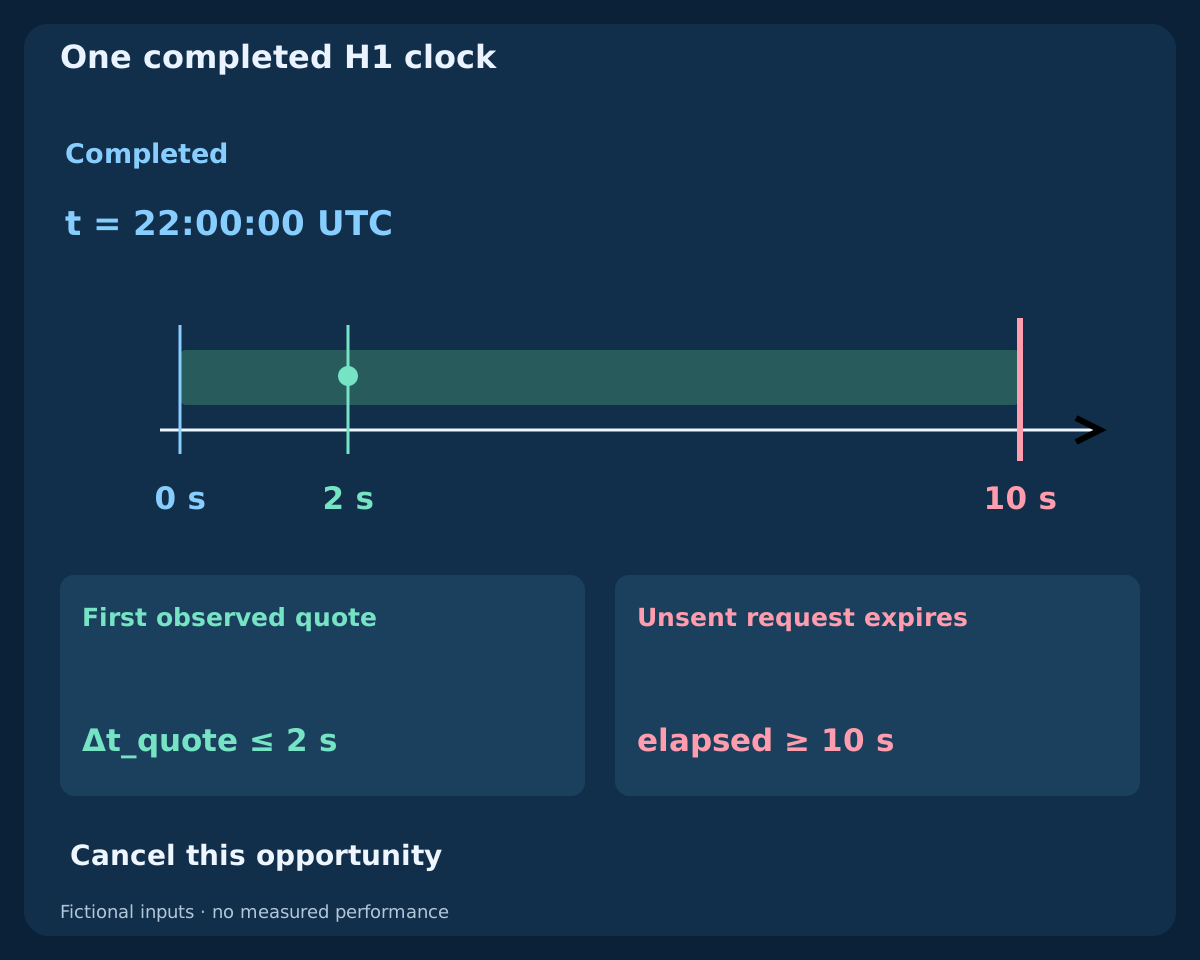
Let t be the completed candle's UTC boundary. Observe the first two-sided Bid/Ask quote after t. An unsent request is eligible only during 0 ≤ elapsed < 10 seconds, and that quote must be no more than 2 seconds old. If no quote arrives in time, expire the opportunity. If the first quote fails freshness, spread, distance, reward or broker checks, consume the opportunity; a later quote cannot replace it.
For an otherwise eligible event, spread must be at most 1.5 pips, the Ask-to-stop distance must lie from 5 to 25 pips inclusive, and the planned net reward-to-loss ratio must be at least 1.5. Confirm price grid, broker distances, volume limits, margin and support for attached protection. These are testable gates, not guaranteed safe values. The request must be sent within the window; a request already sent is handled by reconciliation, not assumed canceled when the window ends.
7. Freeze the stop and target from completed prices
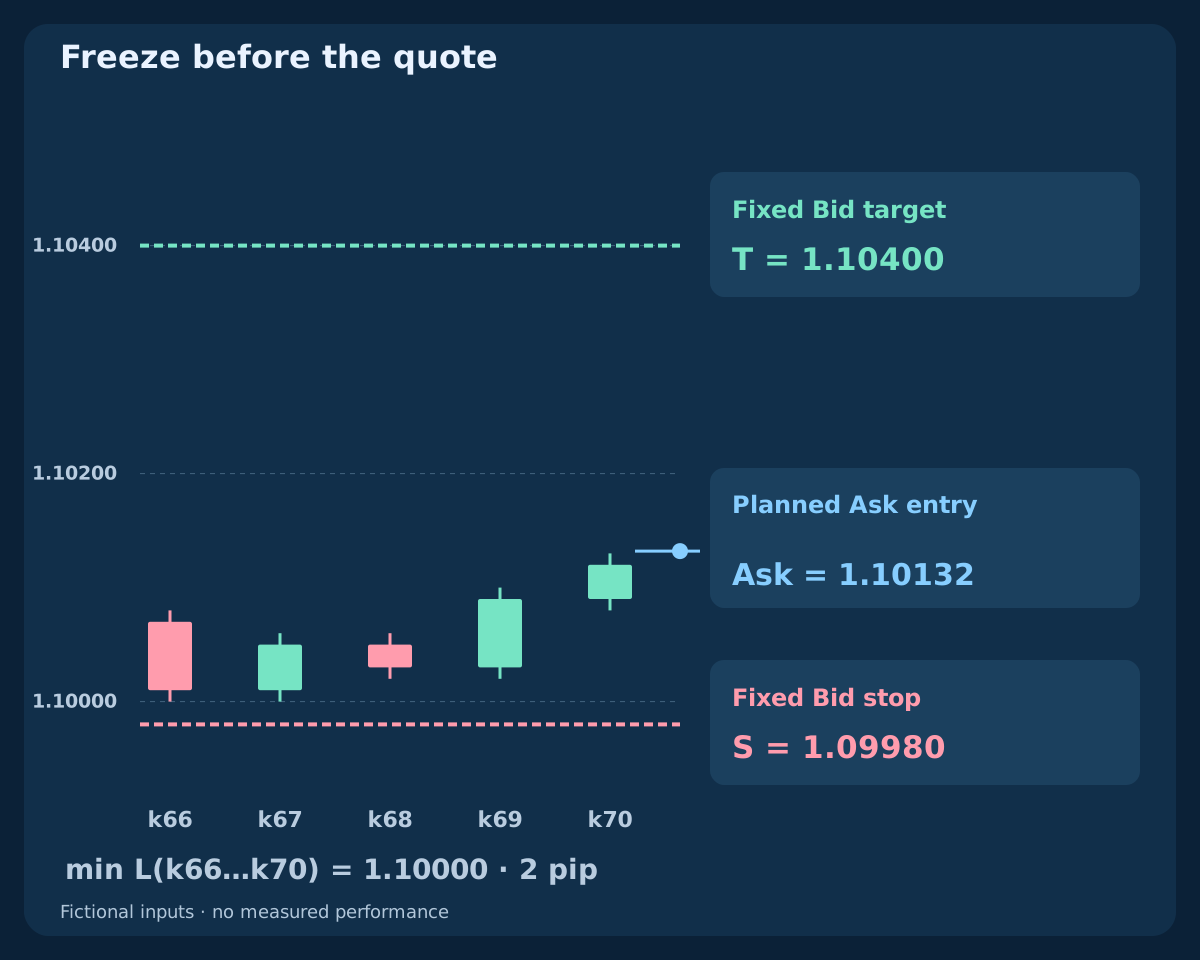
At the qualifying candle, set S = min[L(k−4), …, L(k)] − 2 pips. This is the minimum Bid low of five completed candles, including the signal candle, with a fixed buffer. Set the Bid-side target to T = C(k) + 2 × [C(k) − S]. Freeze both levels before seeing the entry quote. They are chart-based anchors, not a promise of twice the actual executable risk.
Do not move the target or widen the stop to rescue a failed quote. Normalize according to the actual tick grid before recomputing all distances; if normalization changes a gate, use the normalized values. An unavailable low, invalid stop or target behind the entry cancels the event. This model uses no trailing stop, break-even adjustment or partial-profit rule.
8. Rebuild the fictional OHLC and indicator history
The CSV contains 71 invented EURUSD H1 candles, labeled by completion time from 2026-07-06 00:00 UTC, starting at 1.10000. Use 1 pip = 0.00010. The first 40 close changes repeat (−1,+1) × 20. The next 30 changes are +3,+3,+6,−2,−4,+6,+4,+2,+2,−2,−2,+1,−6,−2,−4,+2,−2,−4,+2,−4,−4,+6,+2,+6,−2,−6,+4,−2,+6,+3, in pips. The sequence was constructed to teach acceptance and rejection, not selected to demonstrate returns.
For each later bar, open equals the previous close, high is one pip above the higher of open and close, and low one pip below the lower. The initial open equals its close with the same wick rule. Every OHLC value and indicator intermediate is supplied. Blank means unavailable, not zero. The file ends at k70: no future path or profit curve is implied by the entry-plan drawings.
9. Compare the rejected event, the later state and the new signal
At k40, main has crossed above zero but RSI is 51.5822, so Z is one and Q zero. At k41 RSI becomes 60.6605, but main was already positive and Z is zero. That later state cannot revive the rejection. The zoomed chart marks the two candles separately so a rising RSI is not mistaken for a delayed valid entry.
At k69 main is −0.3494 pips; at k70 it becomes +0.2386 pips, with RSI 57.1260. Z and Q are one at k70. Its completion is 2026-07-08 22:00 UTC, inside the specified calendar. These are unrounded-rule decisions displayed with rounded readings. Q still needs the first-quote checks and does not establish a successful trade.
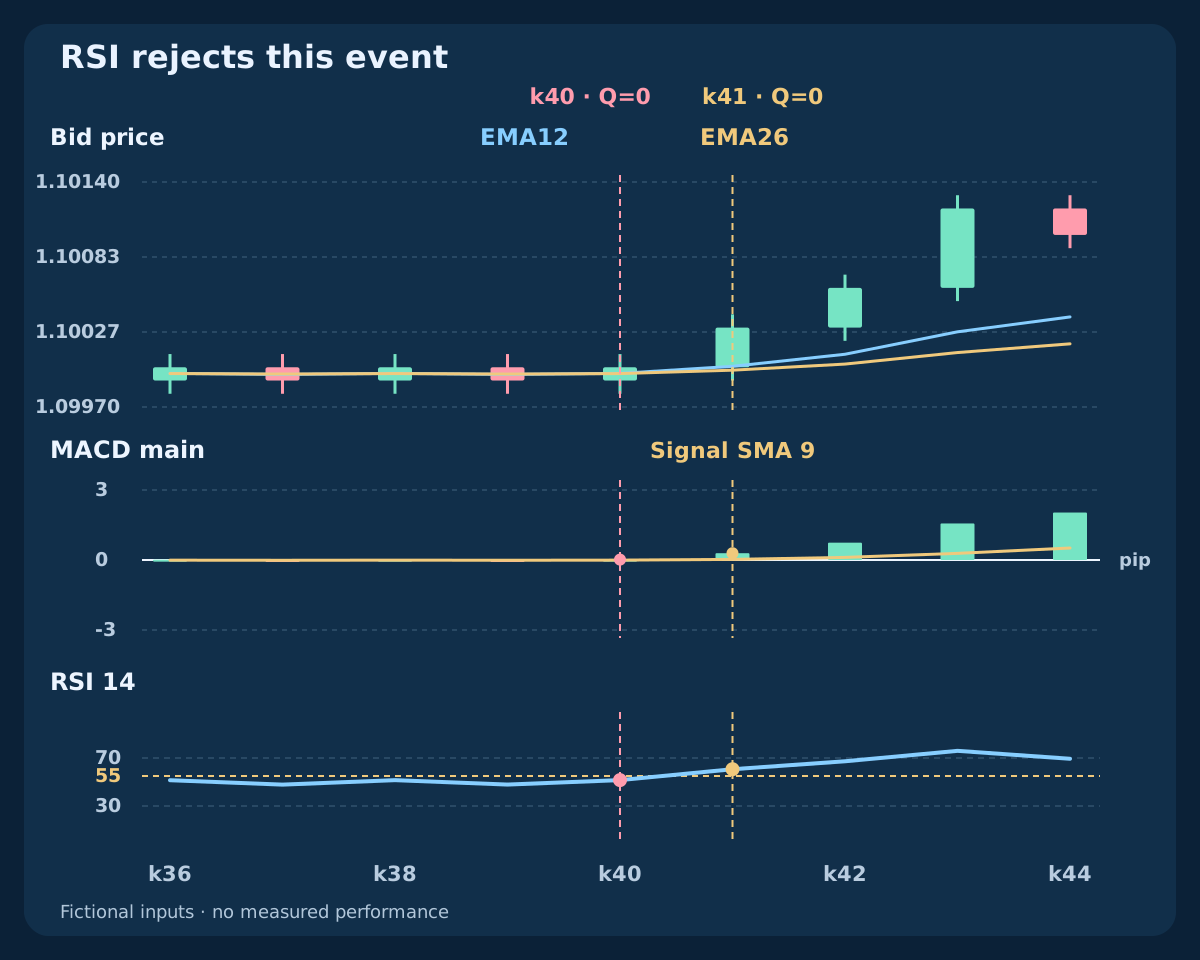
| Candle | Bid close | Main (pip) | RSI 14 | Z | Q |
|---|---|---|---|---|---|
| k39 | 1.09990 | -0.0286 | 47.8578 | 0 | 0 |
| k40 | 1.10000 | 0.0167 | 51.5822 | 1 | 0 |
| k41 | 1.10030 | 0.2913 | 60.6605 | 0 | 0 |
| k69 | 1.10090 | -0.3494 | 54.2038 | 0 | 0 |
| k70 | 1.10120 | 0.2386 | 57.1260 | 1 | 1 |
10. Build the frozen protection plan at k70
The minimum Bid low over k66 through k70 is 1.10000. Subtracting the buffer gives S = 1.09980. The signal close is C(k70) = 1.10120, so the target is T = 1.10400. The protection chart shows the actual completed candles and these fixed levels, followed by a separate planned entry marker, not an invented future candle.
For illustration assume a five-decimal EURUSD price grid of 0.00001: a pip is ten such points. Verify the broker's actual tick size and constraints; decimal digits alone do not establish them. Both fixed exit levels are already on the assumed grid. Initial protection must be included and confirmed. A broker that requires opening this version without protection does not support the stated entry model.
11. Judge the first executable quote after costs
Consider an eligible first quote at 22:00:02 UTC: Bid/Ask 1.10120 / 1.10132. A BUY enters at Ask and exits at Bid. Spread is 1.2 pips, gross stop distance 15.2 pips and gross target distance 26.8 pips. Add round-trip commission 0.6 pip and total adverse-execution allowance 1.0 pip. Planned loss is 16.8 pips, net target 25.2 pips, and ratio 1.5000, which passes the inclusive minimum.
If the first observed quote were instead 1.10160 / 1.10172, the same frozen exits give gross loss 19.2 pips, planned loss 20.8 pips, net target 21.2 pips and ratio 1.0192. Reject that branch despite the same spread and indicator signal. These are alternative first-quote scenarios, not permission to wait and choose. The Ask entry and Bid exits already reflect spread; do not add it again. Allowances are planning assumptions, not loss caps or promised fills.
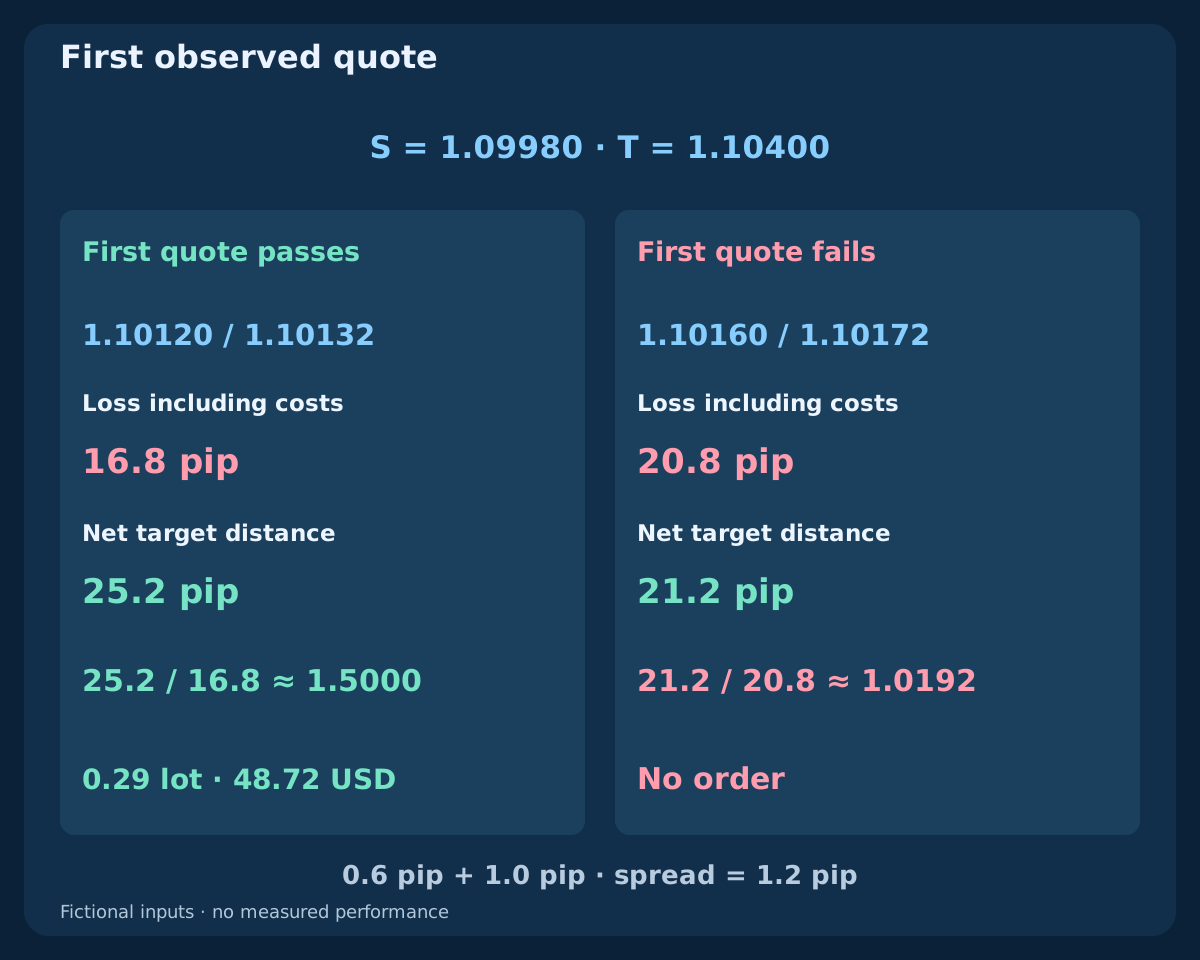
| First quote | Bid / Ask | Gross stop (pip) | Loss + costs | Net target | Ratio | Decision |
|---|---|---|---|---|---|---|
| Acceptable | 1.10120 / 1.10132 | 15.2 | 16.8 | 25.2 | 1.5000 | Pass |
| Expensive | 1.10160 / 1.10172 | 19.2 | 20.8 | 21.2 | 1.0192 | Reject |
12. Round volume down within an explicit account budget
Assume snapshot equity 10000 USD and research risk fraction 0.5%, giving budget 50 USD. With a standard contract 100000 EUR and pip value 10 USD per standard lot in this USD account, divide the budget by the planned loss including costs. A volume step 0.01 gives 0.29 lots after rounding down, with planned risk 48.72 USD for the accepted quote.
Use actual symbol contract data and conversion to account currency elsewhere. Apply broker maximum volume, then round down to the permitted step and recheck risk and margin. If below minimum volume or insufficient margin, skip; do not round up. Existing account exposure needs its own limit. A gap, changed commission or worse execution can exceed the allowance and budget, even with an attached stop.
13. Specify exit priority and the time limit
Keep the fixed protective stop and target active; the first actual Bid-side trigger closes the BUY under the broker's execution rules. If still open, request a market exit at the first executable Bid at or after 12 clock hours from the entry bar's opening boundary. An outage or closed market can delay execution. Do not use later RSI or MACD changes as extra exits in this version, and do not flip short.
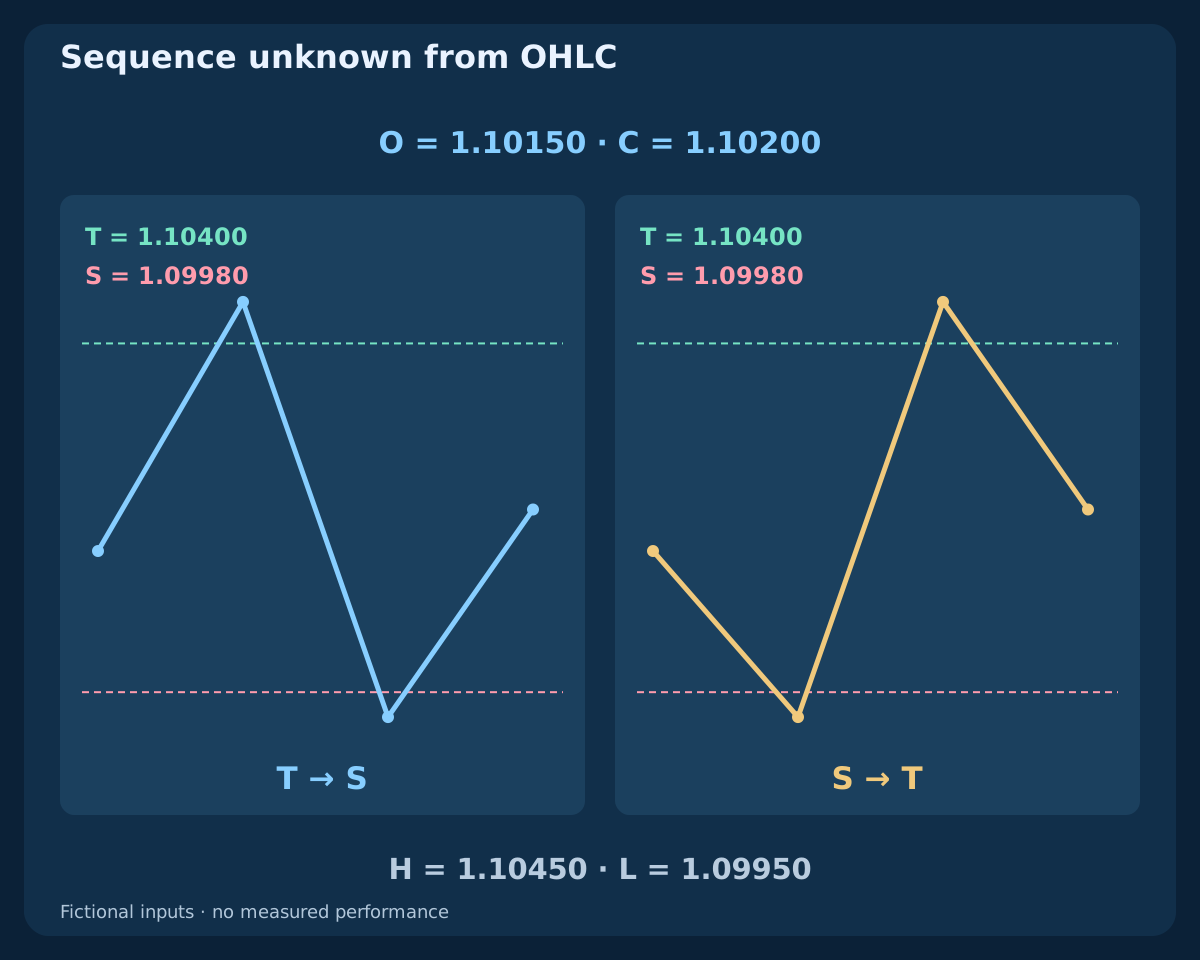
A Bid chart touching the stop or target is not proof of the fill price. If Ask is 1.10400 but Bid 1.10388, the Bid target 1.10400 has not been reached. A separate hypothetical candle with H = 1.10450 and L = 1.09950 contains both exits; OHLC alone does not reveal which occurred first. Use tick sequence and modeled execution, or flag the outcome as ambiguous rather than choosing a winner.
14. Cancel explicitly and reconcile uncertain requests
Record separate reasons for failed RSI, unavailable data, ineligible time, nonflat state, expired window, old quote, spread, stop distance, insufficient reward, volume, margin and broker rejection. Consume an event after its first failed quote check or explicit failed request. A fresh later zero crossing can create a new opportunity only when the position and request state are clear.
The ten-second window is a client rule for sending, not a market-order expiration field. A timeout may hide a fill: reconcile broker orders and deals before any new entry. Confirm actual fill, volume and attached protection. If filled without required protection, attempt immediate controlled closure and block new entries until reconciled. Failed or partial closure leaves residual exposure to manage. Never send another full BUY because the first response is uncertain.
15. Test the added RSI condition under identical execution
Compare a frozen Z-only baseline with Q using the same calendar, first-quote policy, protection formula, costs, budget, one-position rule and time exit. Each model needs its own chronological position state: filtering a trade can alter later availability. Do not force identical trade lists or reprice excluded events at historical closes. Report both raw observations and actual eligible requests.
Use bid/ask or suitable tick data, realistic fees and failures, later validation data and all attempted versions. Evaluate net expectancy, drawdown, uncertainty and missed opportunities, not just win rate. Check sensitivity to the RSI threshold, periods and cost assumptions without selecting a new winner for each interval. The fictional dataset validates arithmetic and chronology only; it contains no trading performance to optimize.
16. Review the complete rule before research execution
Verify the main-series identity, completed timestamps, new zero crossing and same-bar RSI. Check calendar, flat state, frozen lows, stop and target, first-quote deadline, quote age, spread, distance and net ratio. Then verify contract value, budget rounding, broker constraints, attached protection and unique request identity. Log the actual exit sequence and unresolved cases so another researcher can reproduce decisions.
This is the first strategy following the three indicator-combination guides. Keep its long-only MACD hypothesis distinct from the next EMA–ADX–ATR consolidation-breakout model and the later Bollinger middle-band pullback. The completed blueprint makes testing possible; it does not justify live deployment or claim that indicator agreement produces profit.
Frequently asked questions
Does a positive MACD reading alone trigger a BUY?
No. This version needs a fresh main-series zero crossing, RSI above 55 on that completed candle, an eligible calendar and clear position state. The first quote must then pass timing, cost, protection and sizing checks. An already positive main value is only a state.
Is the MT4 MACD histogram the same as main minus signal?
Classic MT4 displays the main series as bars and a simple signal line. Other displays may call the main-minus-signal difference a histogram. Identify the series explicitly: this strategy tests main crossing zero, not its difference from the signal.
Can a rejected signal become valid when RSI rises later?
No. At k40 RSI fails; at k41 it passes but there is no new zero crossing. The model does not store the rejected event. A delayed-entry version needs separate waiting and cancellation rules and its own test.
Why is the planned net ratio not automatically two?
The target is anchored to the completed close, while the BUY enters at Ask. Actual quote position, commission and adverse-execution allowance change the reward and loss distances. Frozen chart geometry is not a promise about net executable risk.
Is the stated budget a guaranteed maximum loss?
No. Volume is rounded down using explicit planned costs, but gaps, worse execution, interruptions and different fees can exceed the plan. A stop order and an allowance do not cap the realized loss.
Do the charts show a profitable backtest?
No. They show invented OHLC inputs, computed indicators and explicit planning examples. The CSV ends at the signal candle, with no post-entry outcomes. Profitability requires a full chronological test and later validation under realistic execution.
Sources and research notes
MetaQuotes supplies the indicator and order-interface documentation. The thresholds, calendar, finite-history seeds, fictional OHLC history, cost assumptions and trade-management rules are original research specifications for this lesson. They are not an optimized recommendation, a verified replica of terminal calculations or a description of a commercial EA. The CSV ends at the signal candle, so it supplies no post-entry trading results. Separate quote and ambiguous-candle examples illustrate execution limits.
Educational research specification. Prices, charts and quotes are fictional. Forex trading involves risk. Indicator agreement, planned budgets and stops do not guarantee profit or a maximum loss.