

RSI turns a price history into a momentum reading. Understanding that transformation helps explain why a threshold can persist, why platforms can disagree and why a clear-looking oscillator still needs a separate trading rule. This guide follows the calculation through to its practical limits.
1. What RSI measures
RSI compares smoothed positive and negative changes in the chosen price series. It places their balance on a 0–100 scale. A high reading describes stronger recent gains relative to losses; it does not identify a currency as expensive in fundamental terms or measure its strength against every other currency.
RSI is derived from prices already observed. An RSI of 60 is neither a 60% chance of a winning trade nor a return forecast. This guide separates calculation, interpretation and trade execution. Its fictional closes illustrate mechanics; they supply no historical trading results.
2. Fix the settings and the observation clock
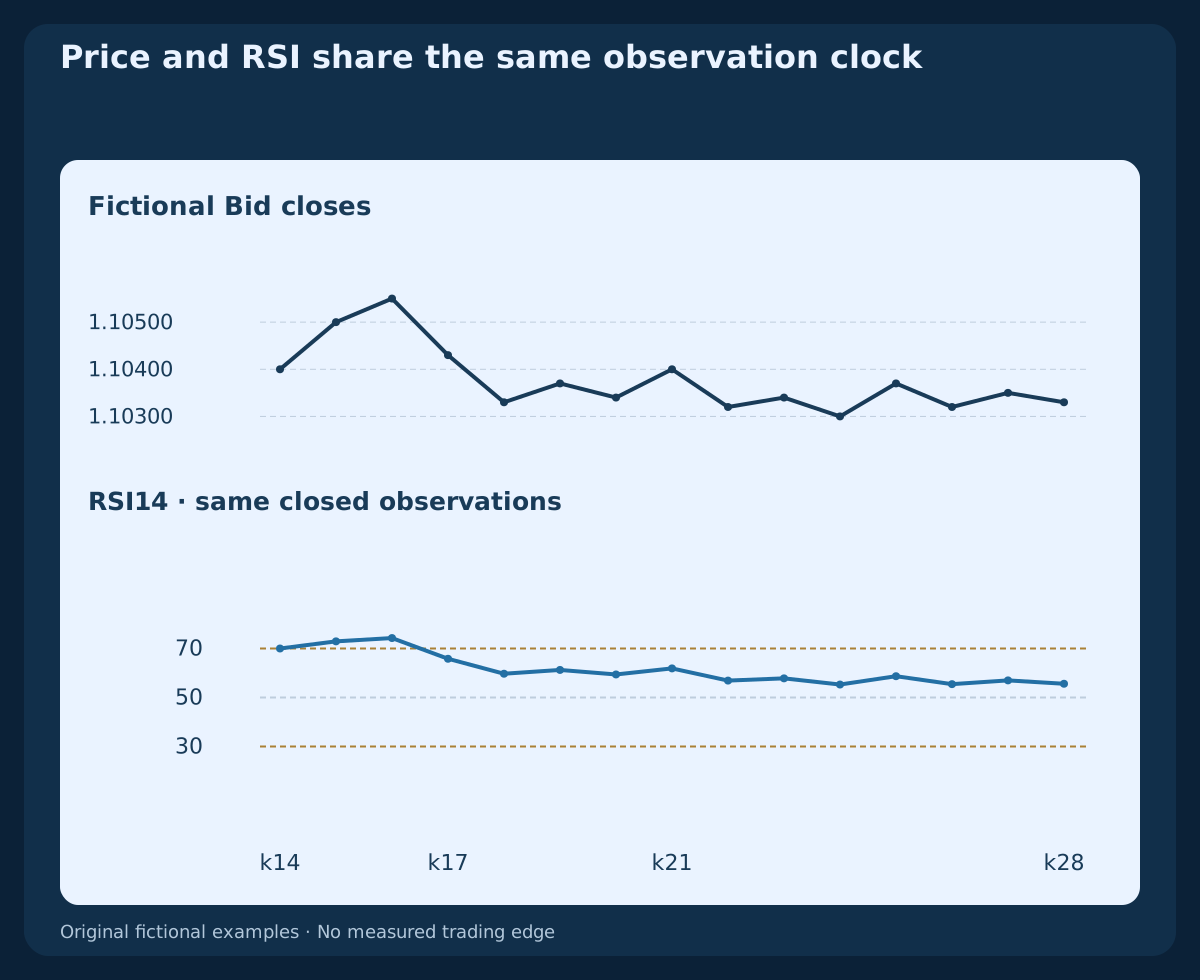
Start a reproducible comparison with RSI(14), Close. The period counts price changes between bars, not calendar days unless the chart is daily. On H1, fourteen changes require fifteen hourly closes for our initial seed. Symbol, feed, timeframe, applied price and history origin all belong in the record.
The familiar period is a convention, not a universal optimum. Changing the period, using a median price instead of Close, or adding an average of the displayed RSI creates a different measurement. An extra smoothing line does not replace the gain/loss smoothing inside Wilder’s RSI.
3. Split changes into gains and loss magnitudes
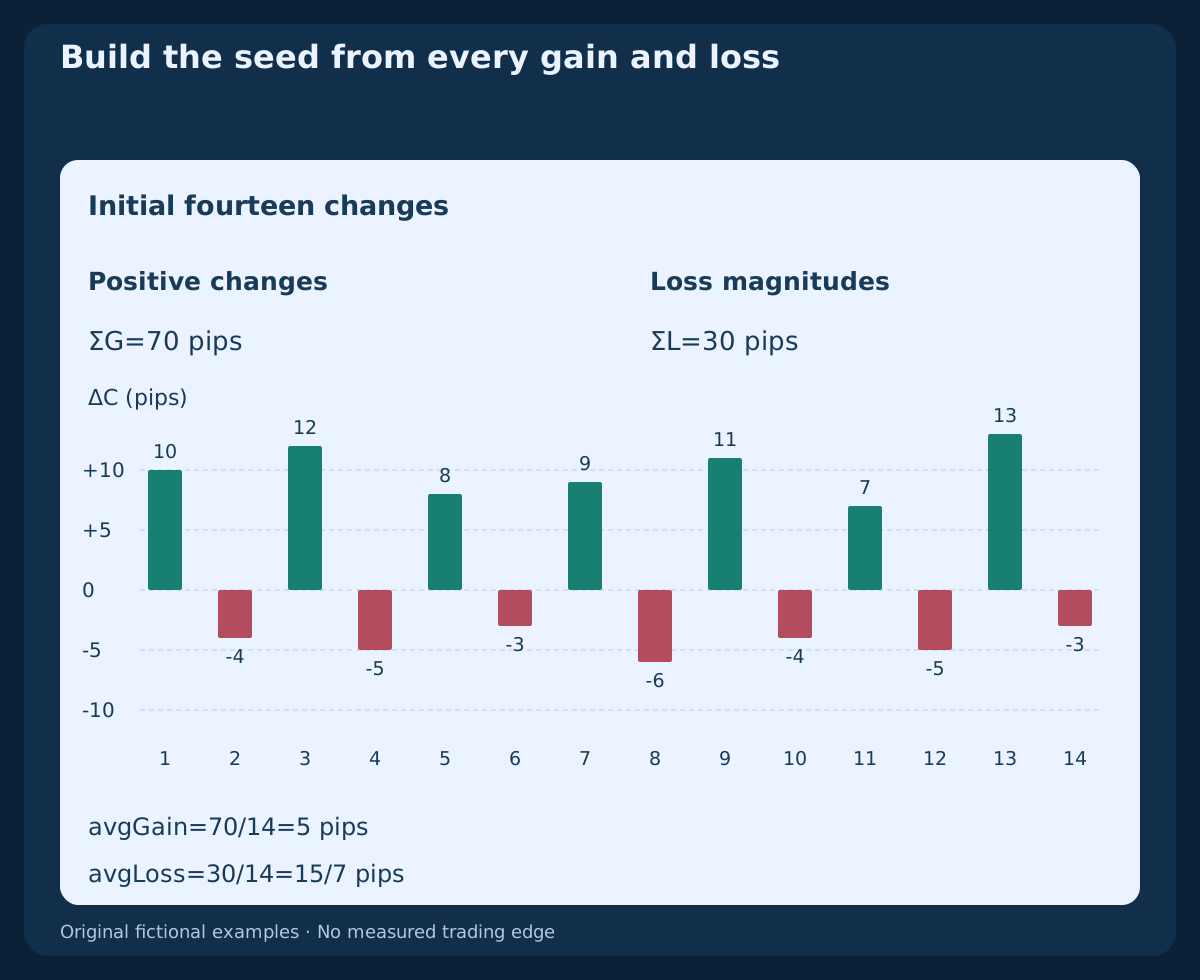
For successive closes define ΔC=C(t)−C(t−1), G=max(ΔC,0) and L=max(−ΔC,0). A loss enters as a positive magnitude. Include zero gains on falling bars and zero losses on rising bars; do not average only the winning bars or count the number of up bars.
Our first fourteen changes contain gains of 70 pips and losses of 30 pips. The initial averages are 70/14=5 pips and 30/14=15/7 pips. With RS=avgGain/avgLoss and RSI=100−100/(1+RS), the first valid RSI is exactly 70. Pips make this arithmetic readable; RSI itself has no pip unit.
4. Apply Wilder’s smoothing after the seed
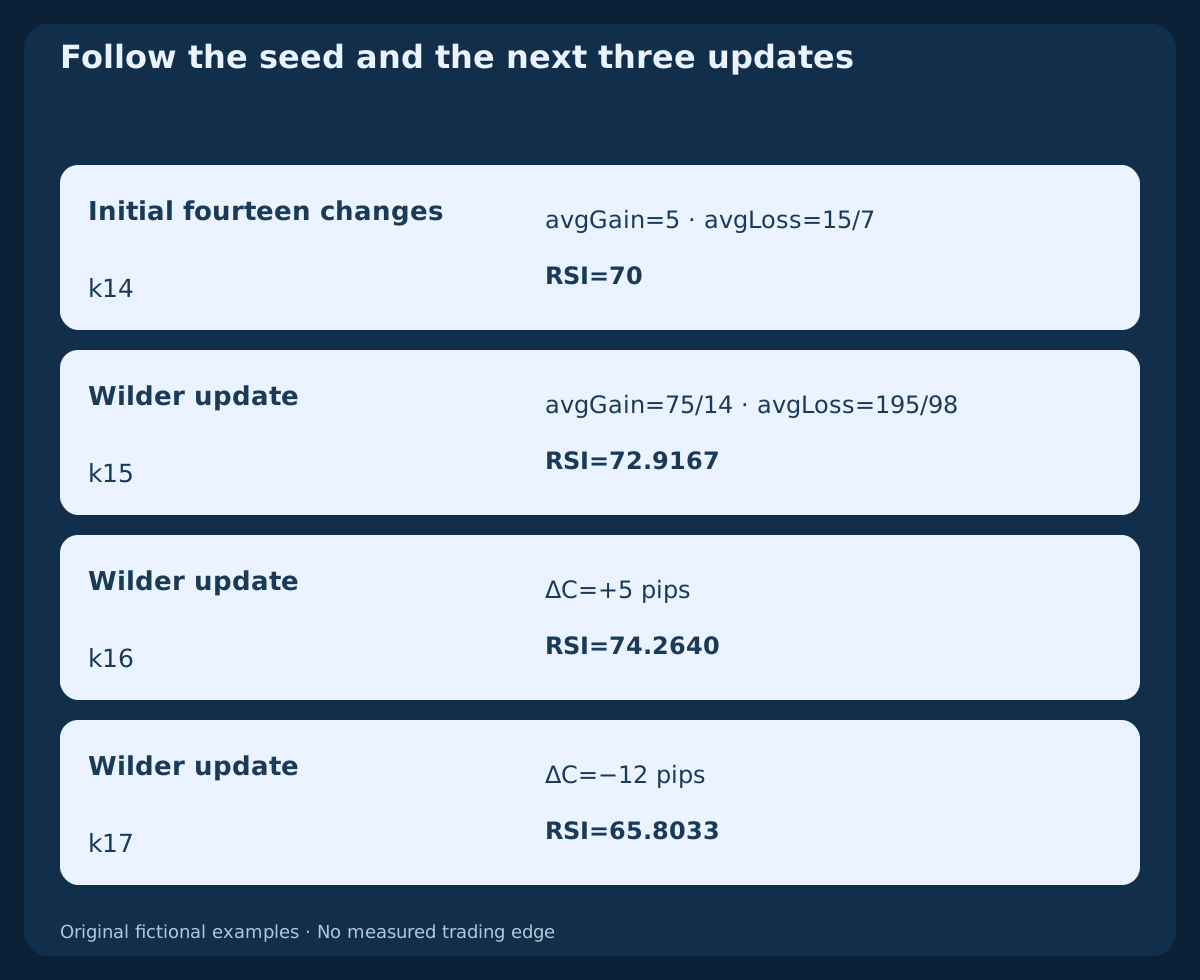
After initialization use avgGain(t)=(13×avgGain(t−1)+G(t))/14 and avgLoss(t)=(13×avgLoss(t−1)+L(t))/14. This recursive average retains older information. It is not a fresh simple average of only the latest fourteen changes on every bar.
The next gain of 10 pips gives avgGain=75/14 pips and avgLoss=195/98 pips, producing RSI=875/12≈72.9167. A further gain of 5 pips produces 74.2640; the following loss of 12 pips produces 65.8033. These displayed values are rounded. Calculate crossings from full precision.
5. Read 50 and handle zero averages explicitly
With positive total movement, RSI=50 means the two smoothed averages are equal. It does not establish a flat price path or prove the absence of a trend. For example, avgGain=3 and avgLoss=2 give RS=1.5 and RSI=60; the average sizes matter, not a percentage of bullish candles.
Our calculation returns 100 when the loss average is zero and the gain average is positive, and 0 for the reverse. When both are zero, it assigns 50 as an explicit flat-series convention. Missing history remains unavailable. Do not replace a missing observation with zero or assume every platform handles the flat case identically.
6. Separate 30/70 states from fresh crossings
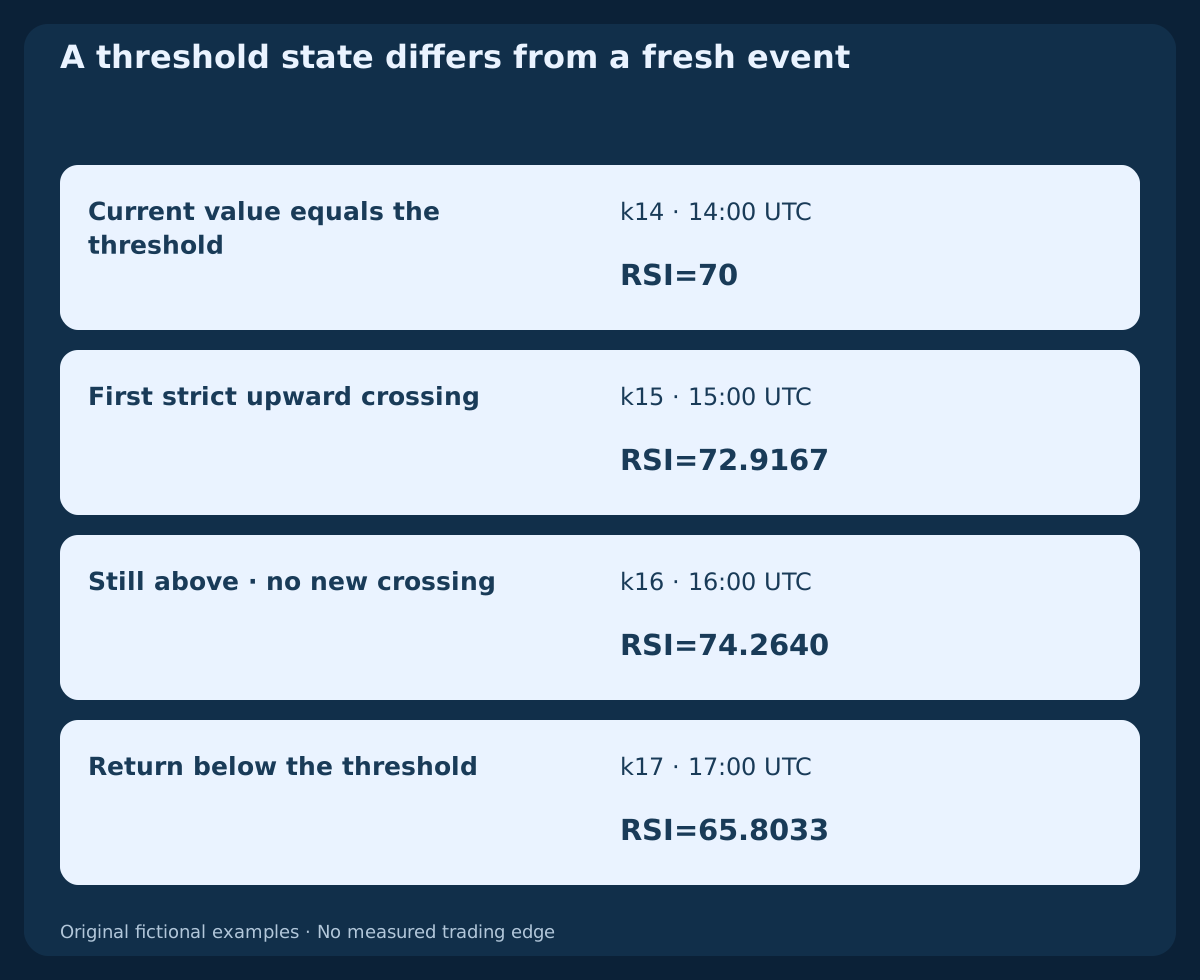
The customary 30/70 levels identify lower and higher oscillator regions. They do not force a price reversal. In the fixture, RSI is exactly 70 at k14, first rises above it at k15, remains above at k16 and returns below at k17. Price continues higher between the first two above-threshold readings.
Define an upward event explicitly, for example RSI(t−1)≤70 AND RSI(t)>70. Equality on the current bar does not pass this strict rule. The later above-threshold reading is a state, not another crossing. A return below the threshold is a different event. None of these events alone supplies entry, stop, target or permission to keep retrying.
7. Interpret the reading in its market context
In a persistent upward move, RSI can remain in its upper region while prices continue rising. During a downward move it can remain low. Around a range, repeated threshold returns may have a different interpretation. Choose the price-context definition before reviewing outcomes; a later chart cannot retroactively classify an earlier trade as a range or trend.
Use a stated price structure or another declared context rule, then ask what the RSI changes in the decision. Price and RSI are related observations, not independent witnesses. A reading below the upper threshold does not by itself mean bearish direction, and a high oscillator cannot tell you how much executable reward remains.
8. Compare periods on the same closes
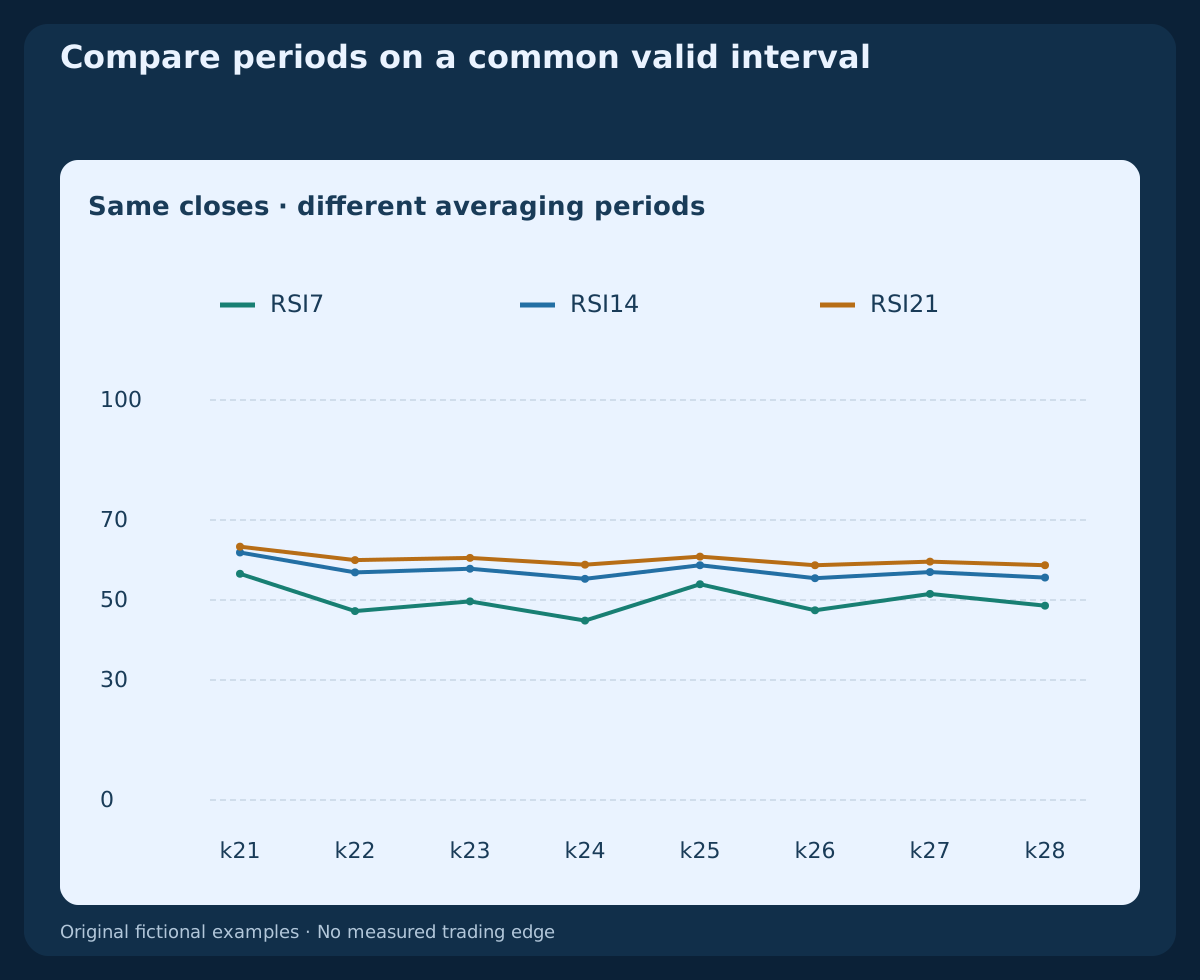
The downloadable fixture calculates 7 / 14 / 21 periods from the same initial close and each period’s own simple-average seed. The first valid indices are respectively k7 / k14 / k21. Compare them on the shared interval k21–k28; earlier blanks are unavailable readings, not zero RSI.
A shorter averaging period gives new changes more weight; it may also produce more threshold changes. A longer period responds more slowly. This example establishes neither an optimal setting nor a performance ranking. Keep the market sample, costs, entry and exit definitions comparable when evaluating trading usefulness.
9. Use closed observations and verify platform differences
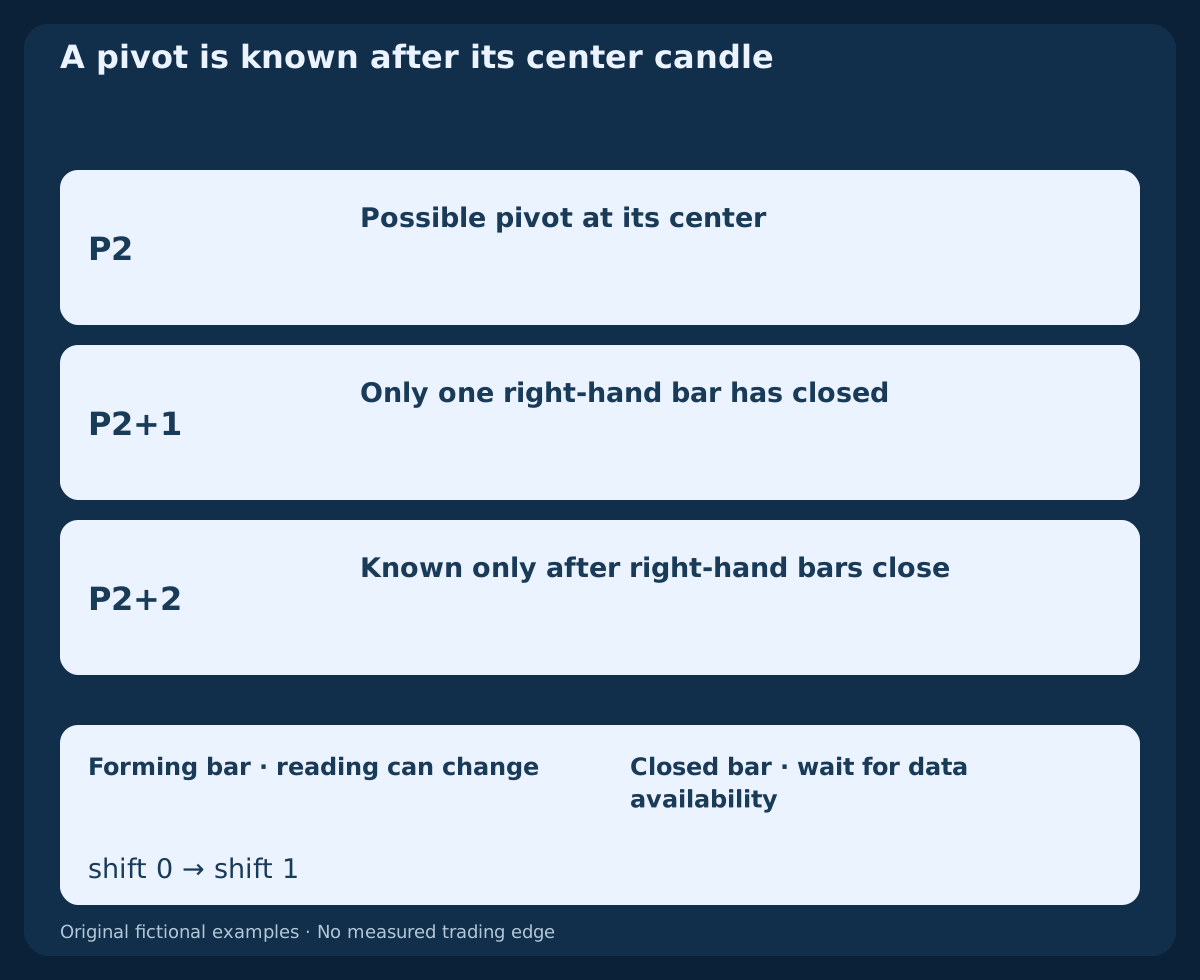
An illustrative MT4 request is iRSI("EURUSD",PERIOD_H1,14,PRICE_CLOSE,1). The actual broker symbol may have a suffix. Shift 0 refers to the forming bar; shift 1 to the latest completed bar once the next bar and required data are available. A changing intrabar reading is not a completed crossing.
Record actual UTC boundaries separately from broker chart labels. Match applied price, smoothing, data gaps, history start and seed before comparing platforms. A seed’s contribution to each smoothed gain/loss average decays by ((n−1)/n)^m after further updates; this is not a formula for the RSI error itself. Extra history reduces initialization influence but does not repair different input data.
10. Distinguish regular and hidden divergence
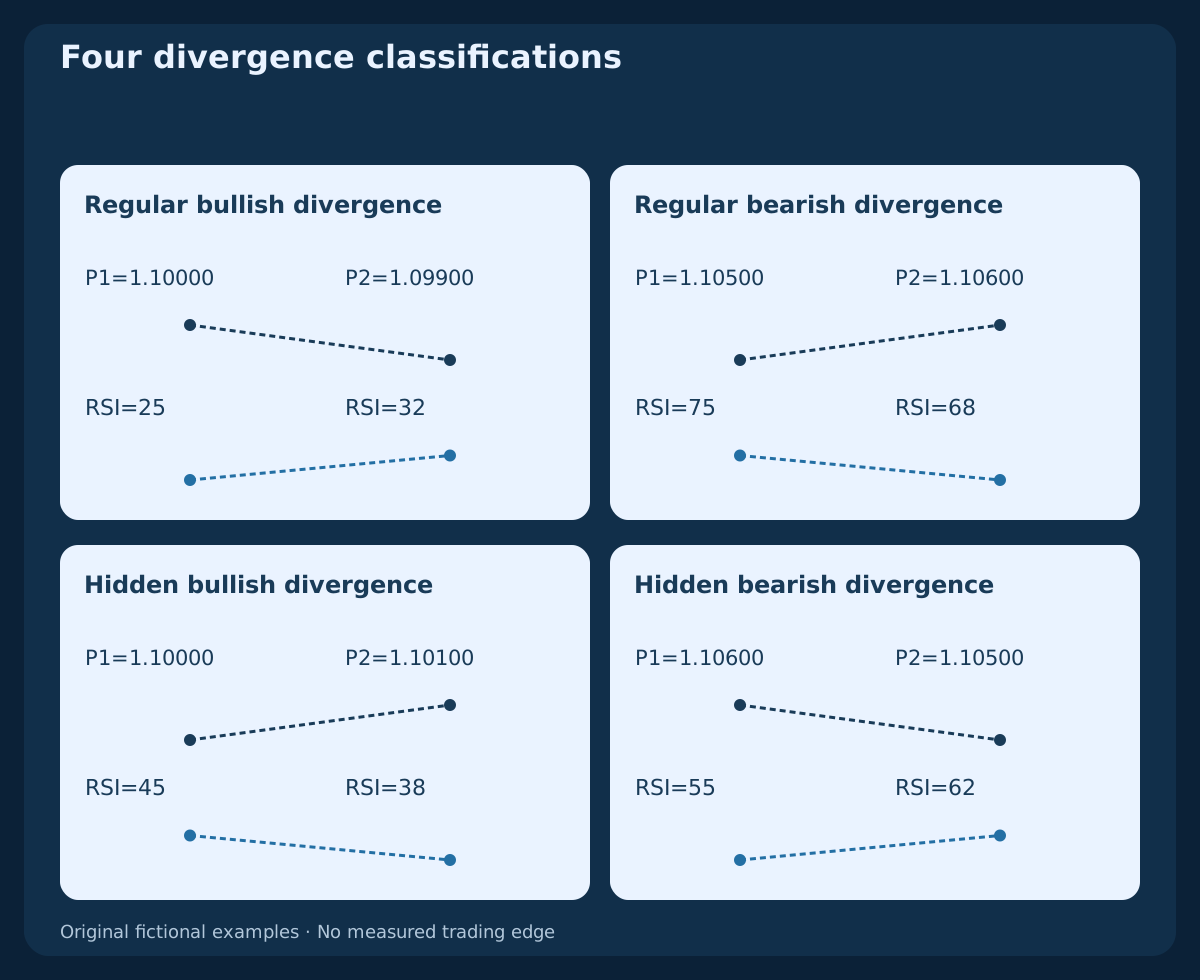
Regular bullish divergence compares a lower price low with a higher RSI reading; regular bearish divergence compares a higher price high with a lower RSI reading. Hidden bullish divergence compares a higher price low with a lower RSI reading; hidden bearish divergence compares a lower price high with a higher RSI reading. Hidden patterns are usually studied as continuation hypotheses within declared price context.
The four paired-point diagrams use independent assumed values, not RSI recalculated from a complete price history. Compare the RSI at the same selected price pivots. Choosing separate convenient oscillator extrema changes the definition. Neither divergence type guarantees reversal or continuation, and a divergence can persist while a price move extends.
11. Keep pivot time and recognition time separate
For a clear teaching convention, a strict pivot needs 2 completed bars on each side. A low must be strictly below all four surrounding lows; a high strictly above their highs. Equal extrema do not qualify. These additional high/low observations are not present in the close-only fixture, so the four pairs demonstrate classification rather than a validated pivot detector on that fixture.
The second pivot is recognizable only once bar P2+2 has closed, not at its center candle. Record that later time before evaluating any price confirmation. The diagram separates a possible pivot, its confirmation and a subsequent decision. Do not draw a signal on an earlier candle using right-hand bars that had not yet closed.
12. Keep oscillator readings separate from executable risk
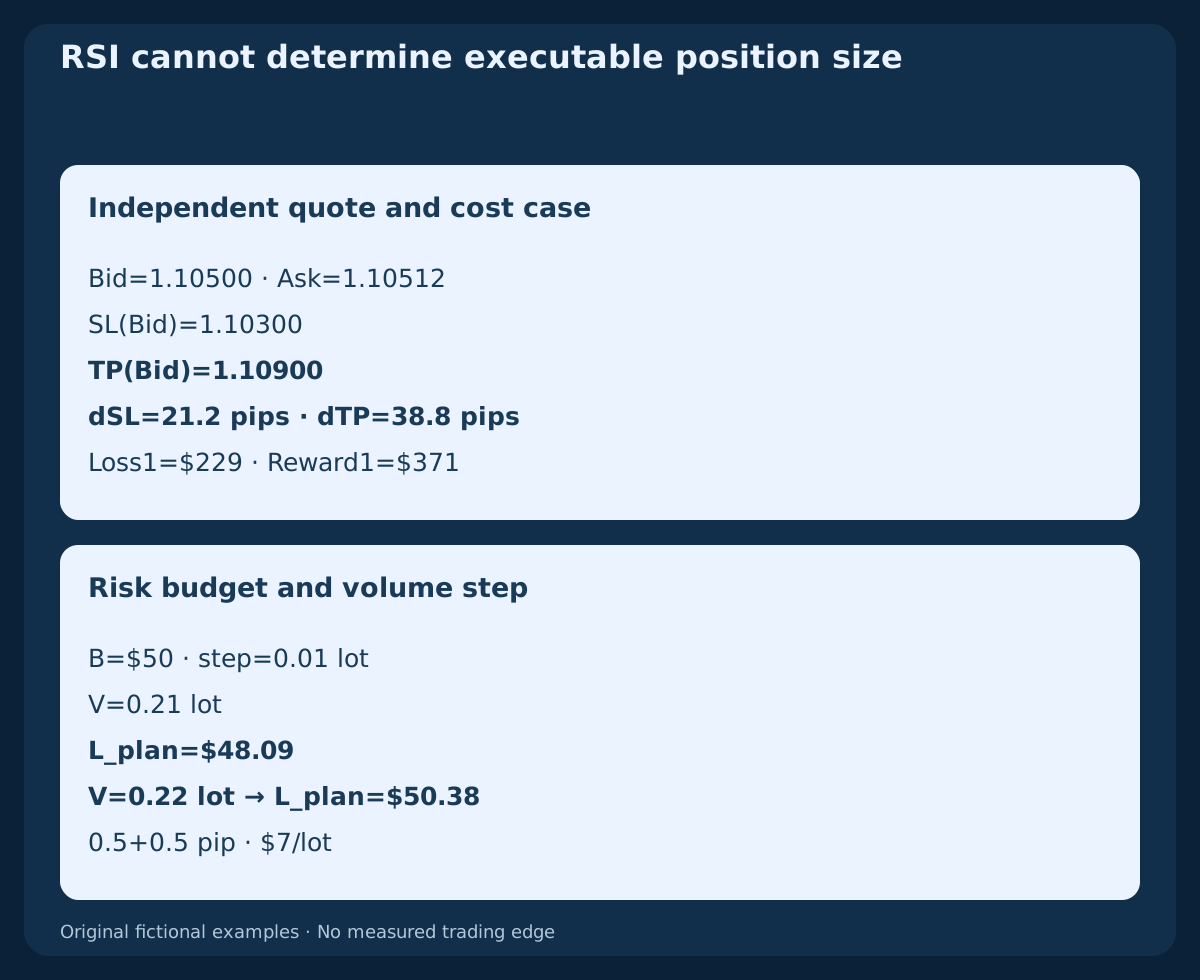
RSI supplies no stop distance or lot size. Consider a separate invented BUY accounting case: Bid=1.10500, Ask=1.10512, SL(Bid)=1.10300 and TP(Bid)=1.10900. With 1 pip=0.0001, entry is at Ask and a long position’s protective price triggers are Bid-based. These quotes are not a trade generated by the close fixture.
Assume $10/pip/lot, $7/lot round-trip commission, separate a_entry=0.5 pip; a_exit=0.5 pip adverse allowances and declared zero funding. Then Loss1=(21.2+1)×10+7=$229 and Reward1=(38.8−1)×10−7=$371. A $50 budget permits 0.21 lot with planned loss $48.09; 0.22 lot would risk $50.38. Verify real tariffs, contract terms, margin, quote sides and fills; a planned allowance does not cap an actual loss.
13. Test a complete rule and a fair comparison
Before testing, state whether RSI is a regime description, a fresh event or a filter on another setup. Freeze eligibility, entry timing, cancellation, protection, position size and exit rules. Include missing data, repeated states, spread changes, rejected entries and uncertain execution in the record. An indicator-only chart cannot establish the result of that complete process.
Compare a baseline with and without the RSI condition under the same execution assumptions. Keep data reserved for evaluation and document parameter trials. Fewer trades or a better-looking historical line do not establish an improvement. Report costs, drawdown, sample size and uncertainty before interpreting any measured results.
14. Avoid the common reading errors
Do not translate overbought into an automatic short, confuse a repeated state with a new cross, treat RSI points as pips, or interpret oscillator level as a winning probability. Adding RSI to several closely related price indicators does not manufacture independent confirmation. A visually smooth line can still react late.
Before accepting an observation, check the symbol and timeframe, applied price, complete input history, averaging convention, closed-bar time and exact inequality. For divergence, add the pivot selection and its recognition time. If the rule or a required value is unavailable, record that limitation before making a trade decision.
15. Reproduce the original fixture
The main CSV contains 29 fictional EURUSD H1 Bid closes and 28 changes, beginning at 2026-10-19 00:00 UTC. The first close is 1.10000. It provides gains, loss magnitudes, the two smoothed averages and period comparisons. It contains no high/low path, historical Ask stream, news record, spread history or executed orders.
The second CSV contains the four independent assumed divergence pairs. Decimal exports and table values are rounded for presentation; the authoring calculations use exact rational inputs. Blank pre-seed values remain blank. These are reproducible educational examples, not collected broker observations, a backtest or evidence of an advantage.
Download the 29 fictional H1 closes and RSI7/14/21 calculations (CSV)
Download the four independent assumed divergence pairs (CSV)
| Index | Close UTC | Bid close | RSI7 | RSI14 | RSI21 |
|---|---|---|---|---|---|
| 13 | 2026-10-19 13:00 UTC | 1.10430 | 73.3893 | — | — |
| 14 | 2026-10-19 14:00 UTC | 1.10400 | 68.9132 | 70.0000 | — |
| 15 | 2026-10-19 15:00 UTC | 1.10500 | 74.8730 | 72.9167 | — |
| 16 | 2026-10-19 16:00 UTC | 1.10550 | 77.4004 | 74.2640 | — |
| 17 | 2026-10-19 17:00 UTC | 1.10430 | 60.3918 | 65.8033 | — |
| 18 | 2026-10-19 18:00 UTC | 1.10330 | 49.7608 | 59.6995 | — |
16. Choose the next research question deliberately
The useful question is which defined decision changes when RSI is added. Start with the calculation and observation clock, then separate context, a fresh pattern and executable trade conditions. A settings list cannot substitute for those definitions. Keep an unchanged baseline so a later comparison can reveal when the extra condition adds delay or removes useful observations.
The related materials cover momentum roles, divergence timing, EMA/RSI scalping and fully specified reversal or failure-swing models. Each has its own entry logic. This guide explains the indicator; a hidden-divergence continuation strategy needs its own complete, separately tested specification.
Frequently asked questions
What are the best RSI settings for Forex?
There is no universal best setting. Period 14 with Close is a familiar reference. Choose and test the period, thresholds, timeframe and complete trading rules together;the examples here do not measure performance.
Does RSI above 70 mean I should sell?
No. It describes an upper oscillator region. In a sustained upward move RSI can stay high while prices rise. A short trade would require its own complete and tested specification.
Does RSI 50 mean the market has no trend?
No. With positive total movement it means the smoothed gain and loss averages are equal. Different price paths and contexts can produce the same reading.
Why do two platforms show different RSI values?
Check the symbol, feed, bar boundaries, applied price, period, smoothing, initial history and seed. Also compare completed observations rather than one forming value with a closed one.
When is a divergence actually observable?
Only after the selected pivots are recognizable under the declared rule. A pivot requiring right-hand bars cannot be known at its center candle. The paired examples here assume values and do not validate complete pivot histories.
Does RSI 60 mean a 60% chance of profit?
No. RSI is a normalized comparison of smoothed gains and losses. It is not a calibrated probability of a profitable trade;costs, entry and exit rules would also have to be defined and evaluated.
Sources and research notes
Platform references support indicator definitions, inputs and display distinctions. The close history, classification pairs, threshold example and quote arithmetic are original educational constructions. No source validates a profitable RSI setting or these examples as a trading system.
Educational RSI guide. Fictional closes, independent assumed divergence pairs and quote accounting;no actual orders, historical backtest or measured profitability.