

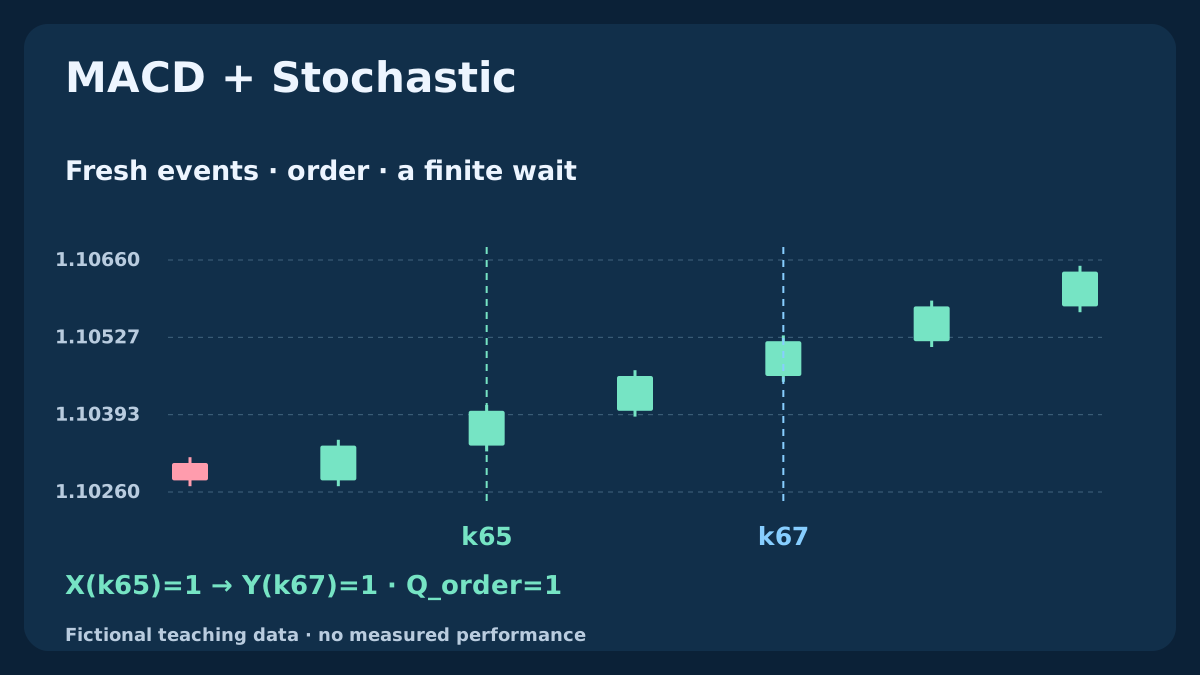
Two bullish-looking indicators can describe different event times. Stochastic may cross first, MACD may already be above its signal line, or the second fresh cross may arrive after the observation has expired. This guide separates those cases with four reproducible fictional H1 histories. It also distinguishes native MT4 MACD bars from a main-minus-signal histogram and shows why waiting for confirmation can change the executable price.
1. Give each crossing a distinct job
MACD measures the difference between two exponential price averages; Stochastic measures and smooths the close’s location within a recent range. Both transform overlapping price history. Calling their agreement double confirmation does not make it independent evidence. First decide whether you want two fresh events together or one event followed by another.
This guide studies BUY-side observations, not a complete strategy. A Stochastic cross can start an episode, and a later MACD main/signal cross can confirm it within a declared window. The previous EMA–Stochastic guide examined a same-bar trend state instead. A state filter and an ordered event sequence are different hypotheses even when their charts look similar.
2. Fix the settings, seeds and units
Use fictional EURUSD Bid H1 OHLC. MACD uses 12,26,9, PRICE_CLOSE, with M=EMA12−EMA26 and the native MT4 reference G=SMA(M,9). Seed each EMA with its first N closes, then use E_N(k)=[2C(k)+(N−1)E_N(k−1)]/(N+1). M first exists at k25, G at k33; the common two-event comparison first becomes available at k34. These are declared finite-history seeds, not a claim about a particular terminal’s earlier history.
Stochastic uses Kperiod=14, Dperiod=3, slowing=3, MODE_SMA, Low/High. Record the feed, completed timestamps, price field and actual implementation. M and G are in price units, while Stochastic ranges from zero to 100 when defined. Our event table and MACD chart divide M and G by 0.00010 to display EURUSD pip units; the CSV retains price-unit values. Common period labels do not establish an optimum or identical platform outputs.
| Measure | Declared reference | Role or limit |
|---|---|---|
| MACD12 / 26 / 9 | Close, finite EMA seeds, SMA9 signal | M/G event differs from main zero crossing |
| Stochastic14 / D3 / slowing3 | Low/High; ratio-of-sums K; SMA D | Fresh K/D event, no 20/80 gate |
| Q_same | X and Y on the same completed bar | Separate simultaneous model |
| Q_order | X first; fresh Y at p+1…p+3 | Cancellation and expiry; no old-event reuse |
3. Distinguish MT4 MACD bars, the signal line and their difference
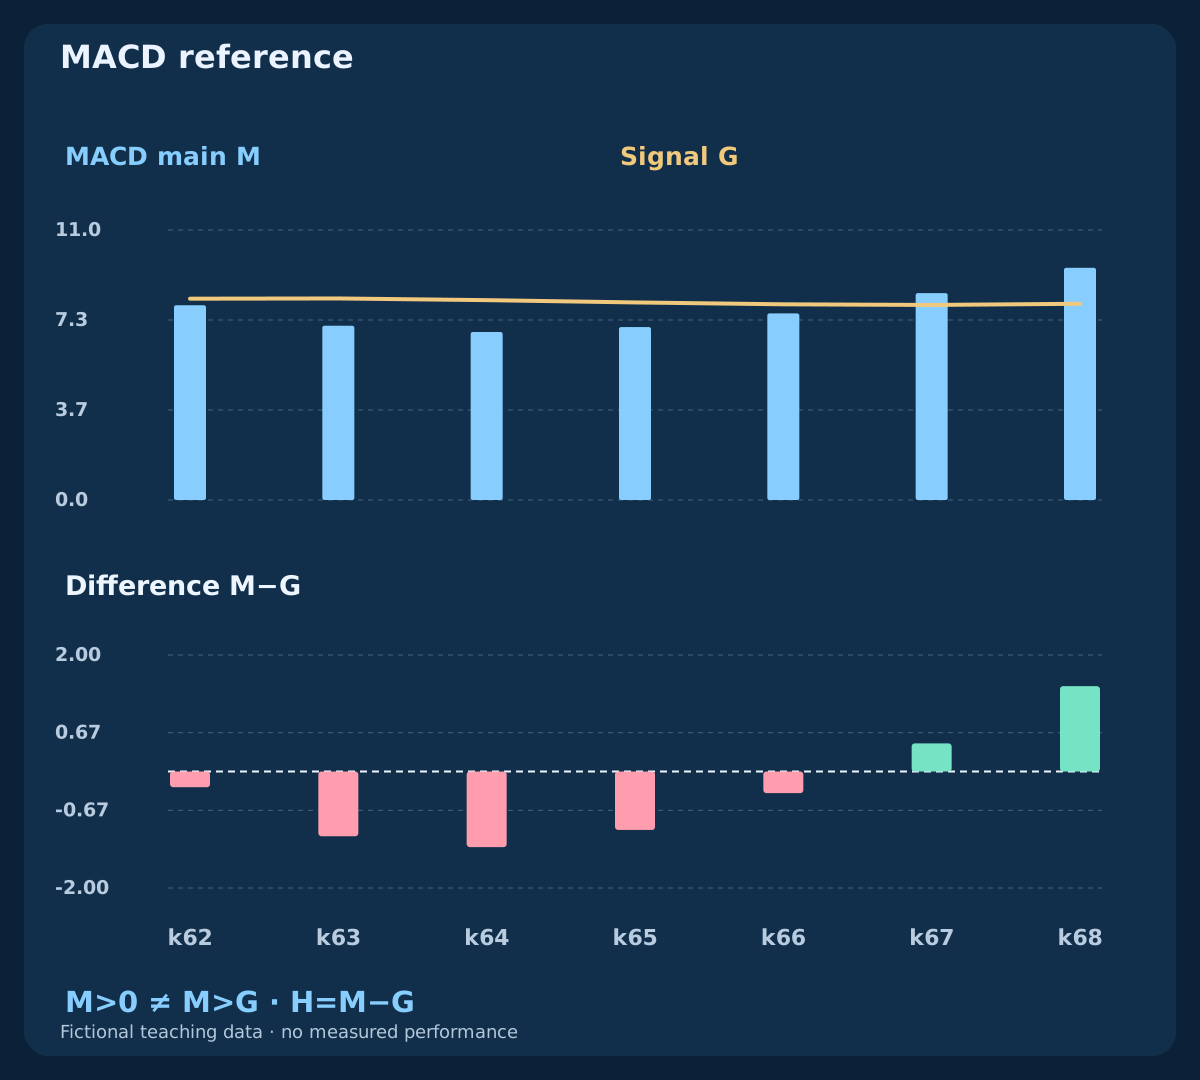
In native MT4, the MACD bars represent M, not the difference between M and G. Define that separate difference as H=M−G. M crossing zero and H crossing zero are not the same event: the first compares the two price EMAs, the second compares MACD main with its signal. M can remain positive while H is negative. A green bar above zero alone does not establish a fresh main/signal cross.
In MQL4, MODE_MAIN returns M and MODE_SIGNAL returns G. Some other implementations use an EMA signal rather than the SMA9 reference here, or call H the MACD histogram. Read actual formulas instead of inferring meaning from colors or names. The diagram keeps M, G and H separate; changing the signal smoothing defines another series and can change crossover times.
4. Specify Stochastic K and D completely
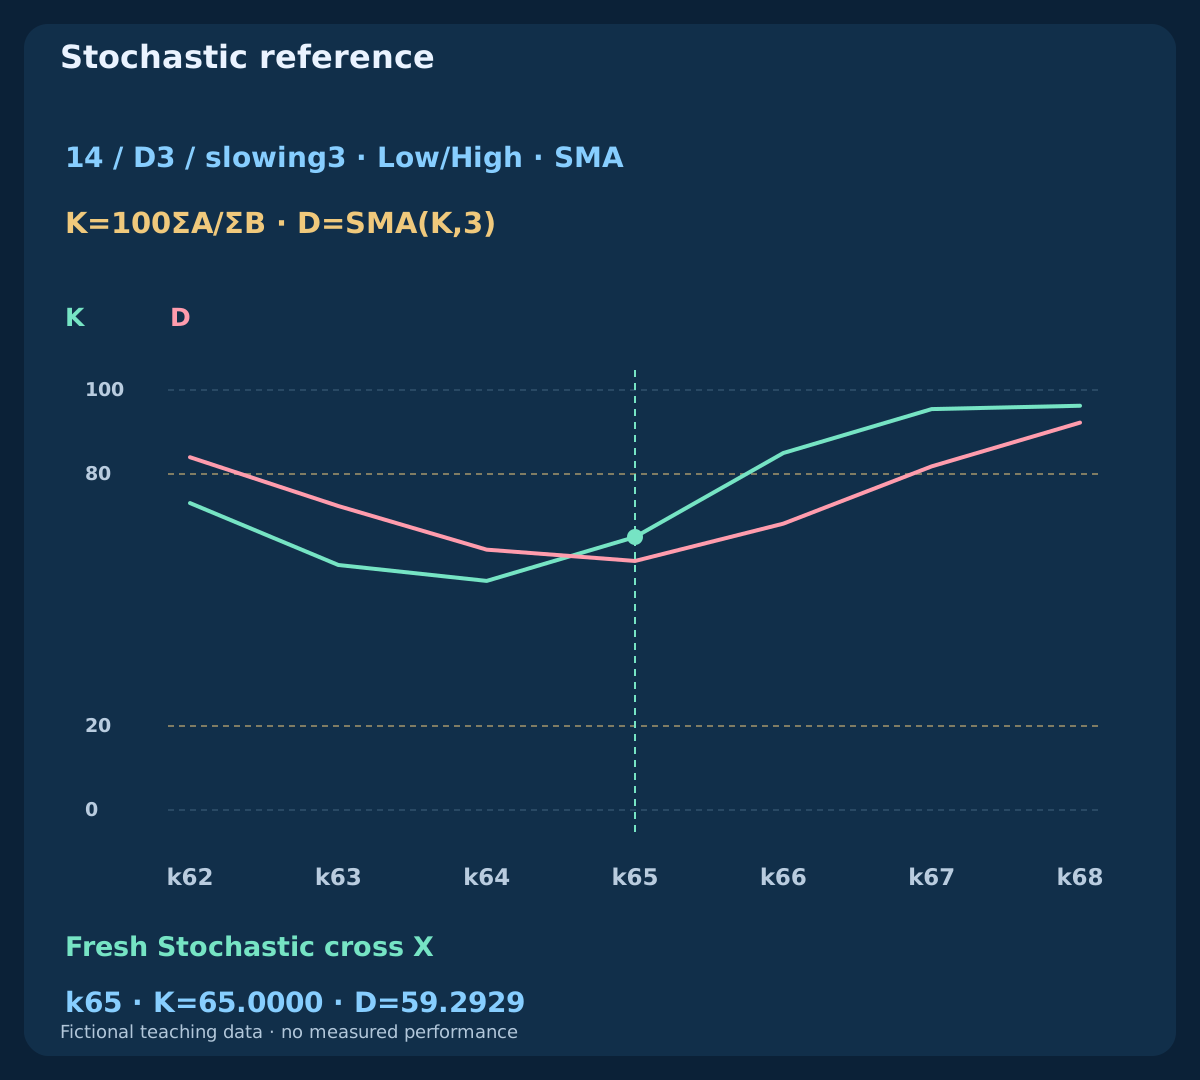
For each completed bar, let LL(k)=min[L(k−13)…L(k)], HH(k)=max[H_price(k−13)…H_price(k)], A(k)=C(k)−LL(k) and B(k)=HH(k)−LL(k). Our main line is K(k)=100ΣA/ΣB over k−2 through k; D(k)=[K(k)+K(k−1)+K(k−2)]/3. This ratio-of-sums slowing is generally different from averaging three raw percentages. K first exists at k15 and D at k17 if the required windows are valid.
Low/High is price_field=0 in iStochastic; Close/Close is a different input choice. The main and signal modes select K and D respectively. If the summed range is zero, K is unavailable; D requires three valid K values. Do not fill gaps with zero or stale readings. This guide does not impose a 20/80 threshold: a crossover and an exit from an extreme zone remain different observations.
5. Define the fresh events before combining them
The Stochastic event is X(k)=[K(k−1)≤D(k−1)] AND [K(k)>D(k)]. The MACD main/signal event is Y(k)=[M(k−1)≤G(k−1)] AND [M(k)>G(k)]. Both need valid current and previous readings. Equality is allowed on the previous side only. A persistent K>D or M>G state does not create a new X or Y on every candle.
For the simultaneous observation, define Q_same(k)=X(k) AND Y(k). It requires two fresh crosses on the same completed bar. It does not mean that one indicator crossed earlier and remains bullish now. A MACD zero-line event is a separate experiment, as in the existing MACD–RSI strategy. Opposite-direction SELL rules also need explicit definitions; they are not supplied by these BUY observations.
6. Give ordered confirmation a finite lifetime
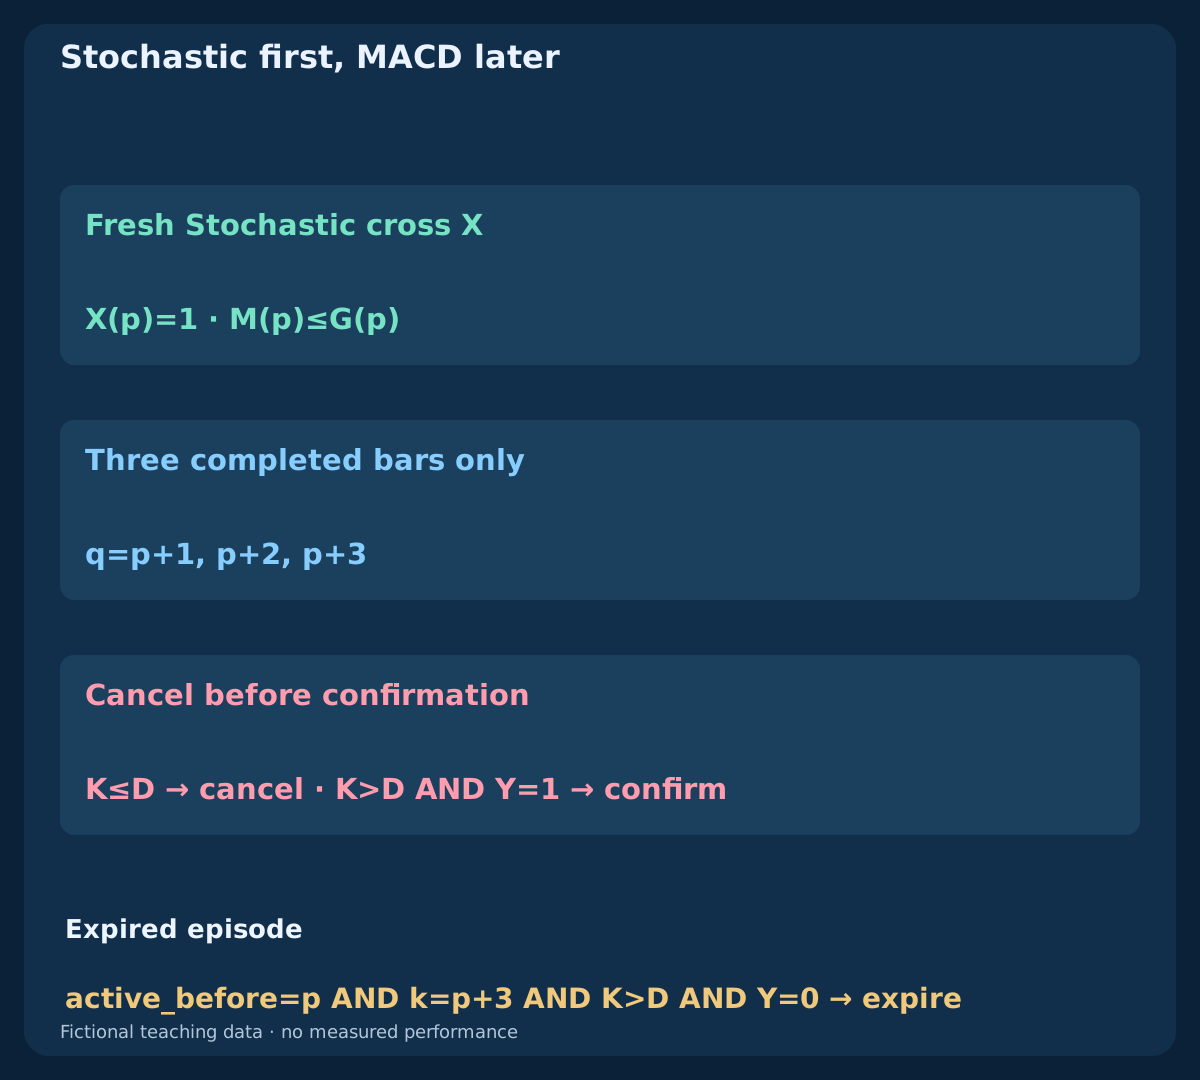
Our separate ordered model starts only when there is no active episode and X(p)=1 AND M(p)≤G(p). This requires Stochastic to move first while MACD has not yet crossed above its signal. The confirmation window is p+1≤q≤p+3. A fresh Y must arrive inside it while K>D remains continuously true on each intervening completed bar and on q. The three-bar choice is illustrative, not optimized.
Cancel before confirming if K≤D or any required input becomes unavailable. Otherwise check Y, including on p+3; if no confirmation arrives, expire after that bar. Additional X readings while active do not move p or extend the deadline. Confirmation, cancellation and expiry consume the episode; no rearming on that same bar. If X and Y happen together while idle, the simultaneous model can qualify, but this ordered model cannot arm because M>G already holds.
7. Use completed timestamps and deterministic priority
In the current MT4 H1 series, shift=1 is the last completed candle, shift=2 the preceding one, and shift=0 is forming. Read both indicator pairs on the same completed intervals. Count completed bars, not elapsed wall-clock hours. Evaluate once per newly available completed timestamp and keep the episode’s original start time; a delayed application must not silently turn three bars into three new bars from reconnect time.
Use unrounded values for decisions and round only for display. The teaching reference uses exact rational arithmetic to make equality deterministic; reconstruct it from the supplied OHLC and formulas rather than comparing rounded CSV decimals. Verify actual terminal behavior separately. After missing data or a restart with uncertain state, rebuild the event chronology before taking a new decision; an already bullish display cannot reconstruct a missing fresh cross.
8. Rebuild four separate fictional histories
Every case starts at 2026-07-06 00:00 UTC with close 1.10000 and 1 pip=0.00010. Each begins with 0×39 close changes, followed by +2×20. The timely case then uses −3×4,+6×6; the late case −3×8,+5×8. The reversed case continues the timely history with −1×1,+2×5. The short simultaneous case instead uses only 0×39,+2×4 from the starting close.
Each open is the previous close, with k0 open equal to its close. High is one pip above max(open,close), and low one pip below min(open,close). The four cases contain 70,76,76,44 rows, 266 in total, and are separate histories rather than consecutive trades. CSV includes OHLC, timestamps, intermediate values, X/Y, both observation flags, and episode actions. Blank means unavailable. These fabricated paths verify definitions, not measured trading results.
9. Follow a timely Stochastic-then-MACD episode
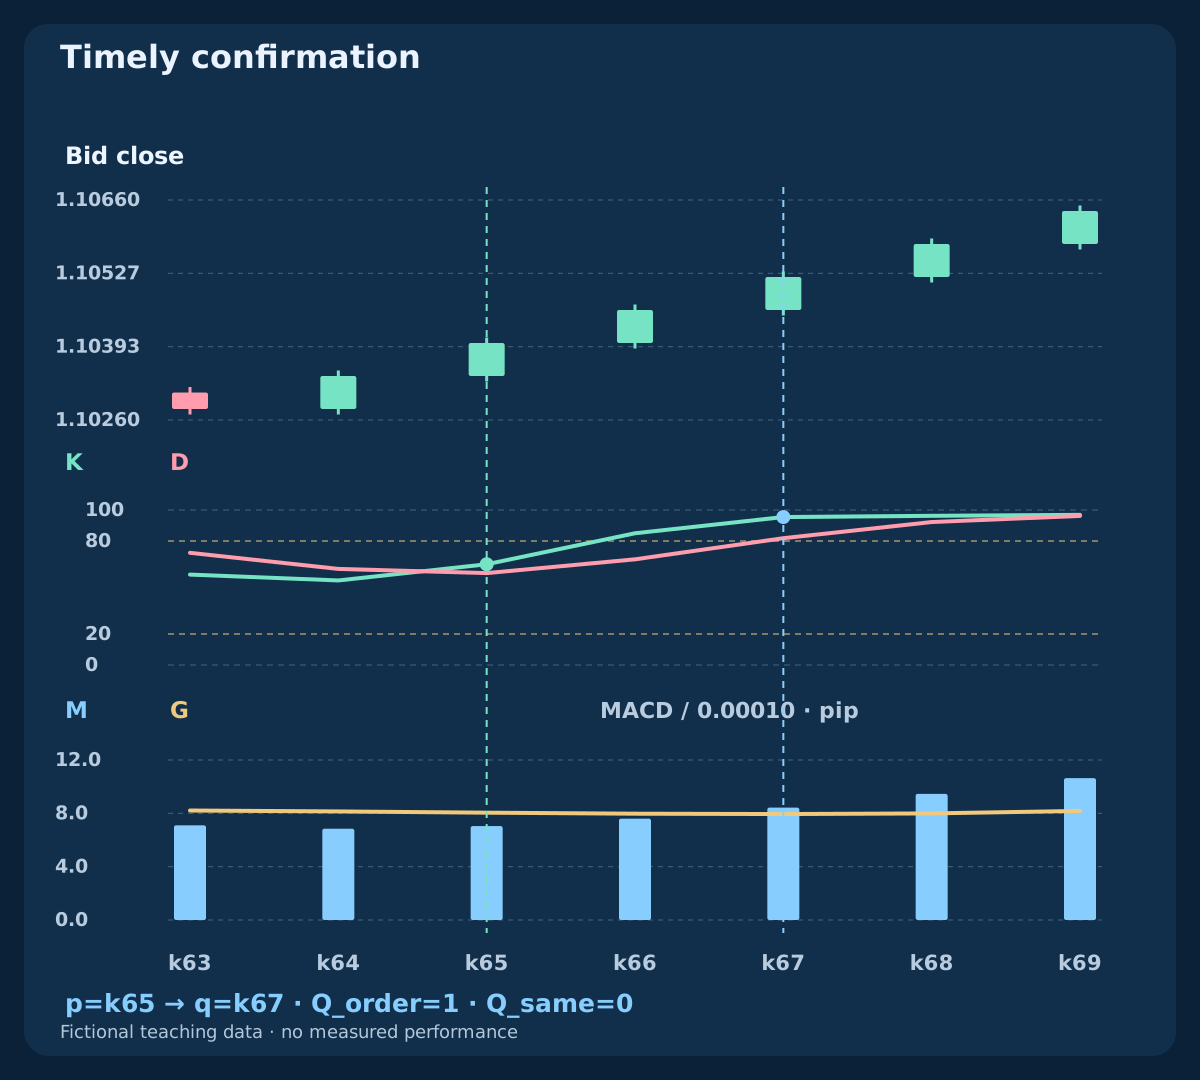
In the timely case, X occurs at k65, with K 65.0000, D 59.2929 and M<G. The episode starts at 2026-07-08 17:00 UTC. Its candidate closes are k66, k67 and k68. K>D remains true, and a fresh Y arrives at k67, 2026-07-08 19:00 UTC, so Q_order is one. X is already zero there; Q_same is zero.
At confirmation K is 95.4545 and D 81.8182. M and G are approximately 8.428732 and 7.946248 pips. There is no upper-Stochastic veto in this model, so the high reading does not invalidate it. Adding K<80 would create a different gate. The price, Stochastic and MACD panels share one bar axis; no fill, stop or profit is attached to the flag.
| Case / bar | K | D | M (pip) | G (pip) | X | Y | Q_same | Q_order |
|---|---|---|---|---|---|---|---|---|
| Timely · k65 | 65.0000 | 59.2929 | 7.045487 | 8.049025 | 1 | 0 | 0 | 0 |
| Timely · k67 | 95.4545 | 81.8182 | 8.428732 | 7.946248 | 0 | 1 | 0 | 1 |
| Late · k68 | 10.6667 | 8.1794 | 2.192409 | 5.845400 | 1 | 0 | 0 | 0 |
| Late · k71 | 61.5385 | 42.3077 | 3.089991 | 3.869205 | 0 | 0 | 0 | 0 |
| Late · k72 | 79.7468 | 61.1977 | 3.945735 | 3.518799 | 0 | 1 | 0 | 0 |
| Reversed · k72 | 96.6102 | 96.4761 | 12.446648 | 9.531243 | 1 | 0 | 0 | 0 |
| Same bar · k40 | 62.5000 | 54.1667 | 0.159544 | 0.017727 | 1 | 1 | 1 | 0 |
10. Let late confirmation expire instead of extending the window
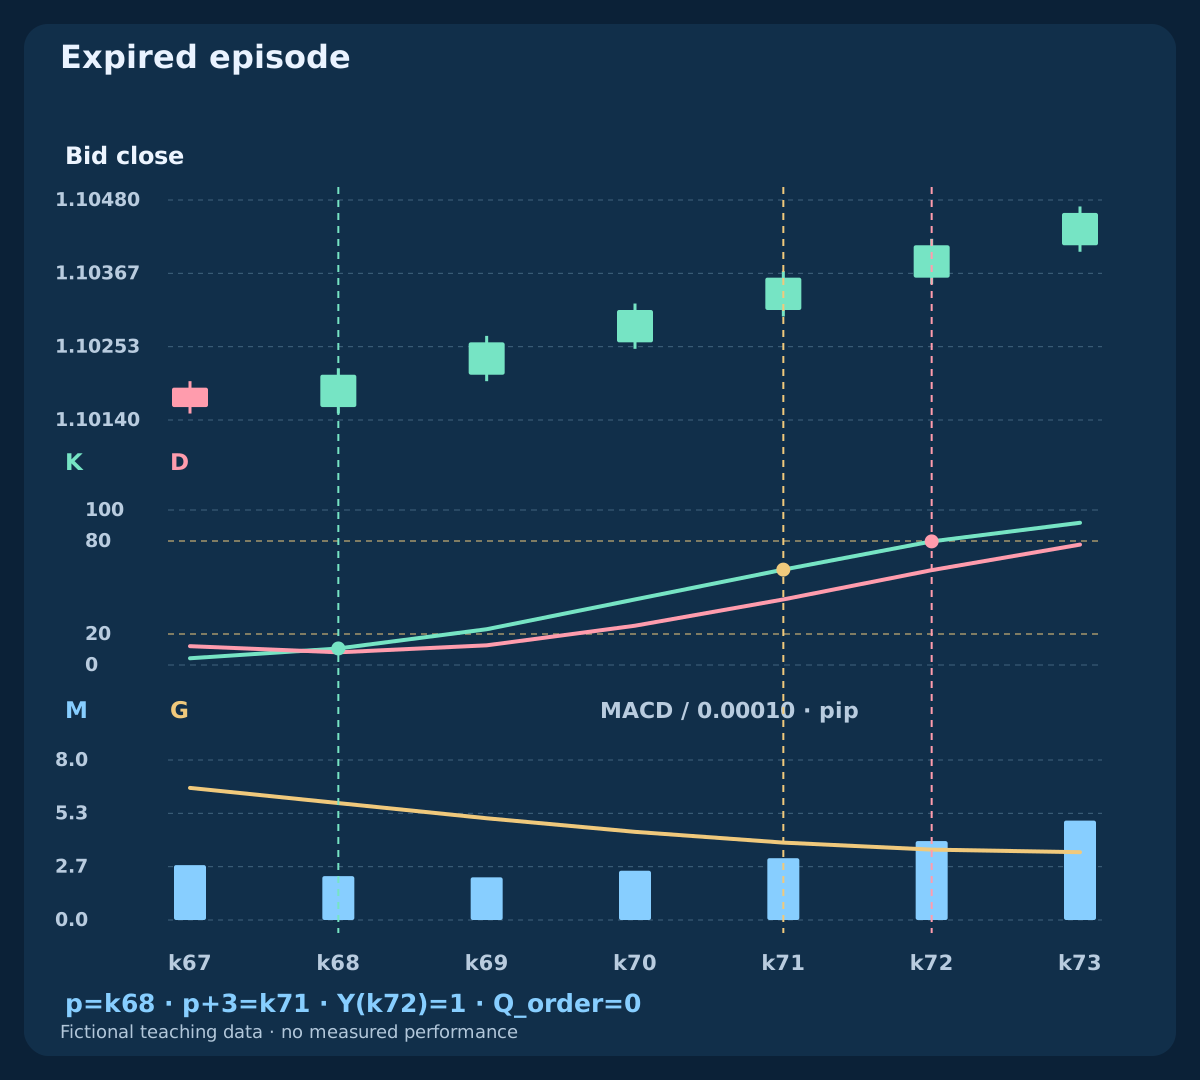
In the late case, X starts the episode at k68, 2026-07-08 20:00 UTC. The eligible closes are k69,k70,k71. K stays above D, but Y does not occur by k71, so the episode expires after evaluating that close. A visually improving MACD line is not enough; the model requires its fresh crossing event within the window.
Y finally arrives at k72, 2026-07-09 00:00 UTC. It is four bars after p, so Q_order remains zero even though both indicators look bullish. No new X occurs at k72, so no new episode starts. Extending the window to include the attractive late case would be a new model selected after seeing the example, not a correction to the original rule.
11. Keep reversed order and simultaneous events distinct
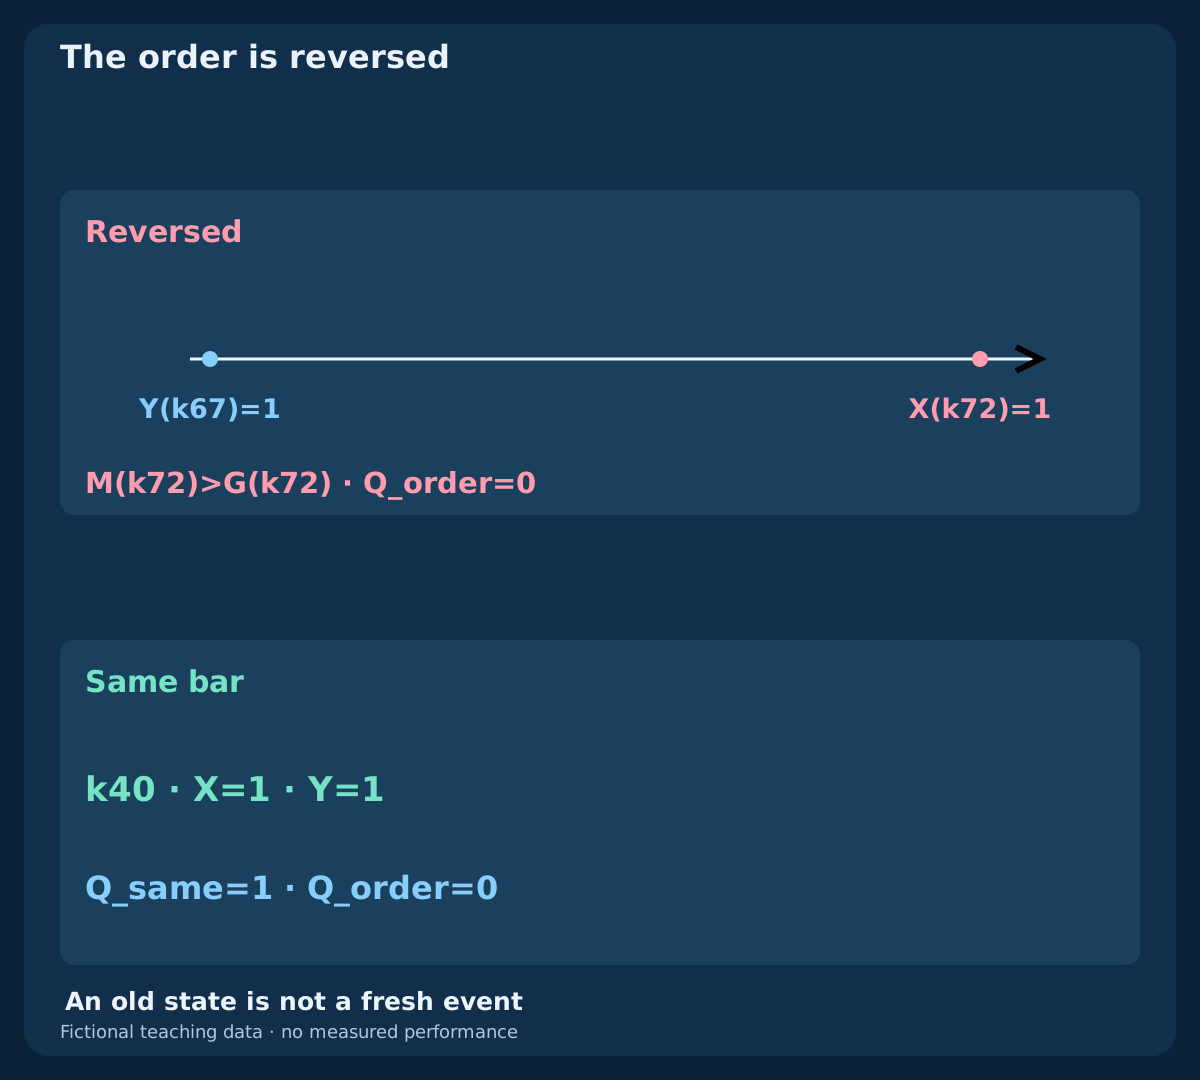
In the reversed case, the earlier episode confirms at k67. A new X appears at k72, but M is already above G from the earlier MACD cross. The arming condition fails, so the old Y cannot be reused as a fresh later confirmation. This history shares the timely prefix but adds a new small pullback; it is not the same event relabeled at a later entry.
In the separate simultaneous case, X=1 AND Y=1 at k40, 2026-07-07 16:00 UTC. Q_same is one and Q_order is zero. The ordered rule requires Y after p, not on p. Neither model is universally better: different order and timing define different observation sets. Mixing their successful-looking examples would conceal which rule was actually evaluated.
12. Separate an observation window from an order window
An eligible MACD confirmation is not an executable order. A complete strategy must still define the first quote to evaluate after q, quote age, maximum sending delay, spread and entry-distance limits, initial protection, exits and whether rejection consumes the opportunity. The three completed bars describe an observation deadline; they are not permission to keep retrying a rejected order throughout that window.
Specify position limits, request identity and restart handling before testing results. A timeout does not prove rejection: reconcile actual broker orders and fills before retrying. Record observation rejection, expiry, submitted request, uncertain status and fill separately. The later ordered-double-cross strategy will supply a separate complete specification rather than treating every flag here as a trade.
13. Compare BUY quote geometry before and after waiting
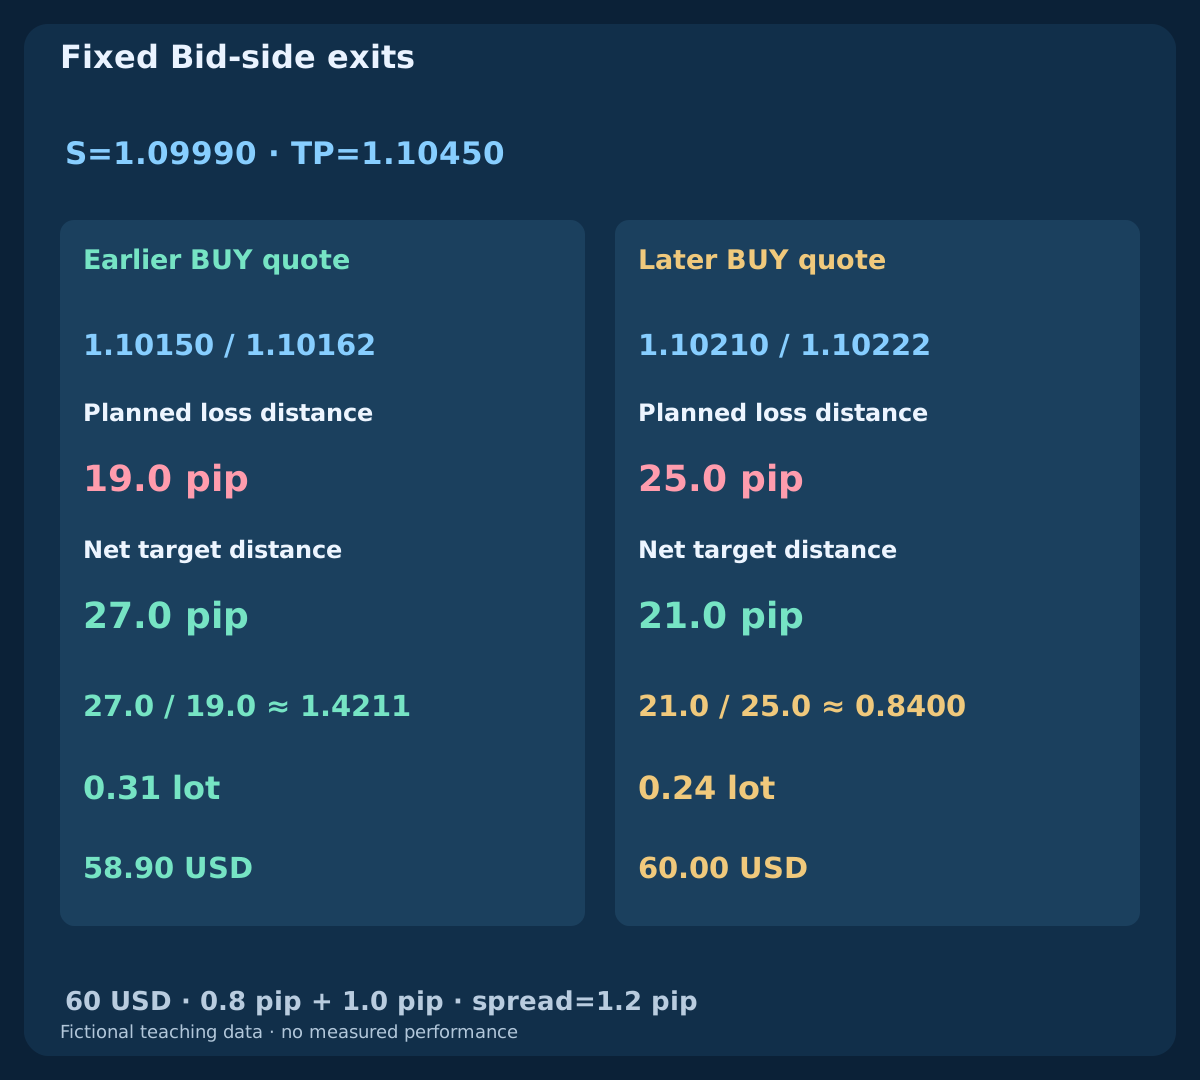
This independent example buys at Ask and exits at Bid, with fixed stop 1.09990 and target 1.10450. Earlier Bid/Ask is 1.10150 / 1.10162, later 1.10210 / 1.10222. Gross stop distances are 17.2 and 23.2 pips. Add round-trip commission 0.8 pip and total adverse-execution reserve 1.0 pip: planned losses become 19.0 and 25.0 pips, net target distances 27.0 and 21.0 pips, ratios about 1.4211 and 0.8400.
Assume equity 10000 USD, budget 0.6%=60 USD, standard contract 100000 EUR, pip value 10 USD per lot and volume step 0.01. Rounding down gives 0.31 lots with planned risk 58.90 USD earlier, versus 0.24 lots and 60.00 USD later. The quotes are separate from the four OHLC cases and are not fills. Confirmation can reduce uncertainty about an event without improving the remaining price geometry.
| Quote | Bid / Ask | Stop (pip) | Loss + costs | Net target | Ratio | Lots | Risk USD |
|---|---|---|---|---|---|---|---|
| Earlier | 1.10150 / 1.10162 | 17.2 | 19.0 | 27.0 | 1.4211 | 0.31 | 58.90 |
| Later | 1.10210 / 1.10222 | 23.2 | 25.0 | 21.0 | 0.8400 | 0.24 | 60.00 |
14. Keep quote side, currency conversion and execution uncertainty explicit
Ask entry against Bid exits already captures the quote-side spread effect; do not add it again. Both example spreads are 1.2 pips. On an assumed five-decimal EURUSD quote, point and tick are 0.00001, while a pip is ten such points. Actual tick size, tick value in account currency, contract size and lot step must come from the traded symbol; decimal digits alone are insufficient.
The cost reserve is a planning allowance, not a cap on loss. Gaps, slippage, swaps or failure to attach protection can change the outcome. Validate broker stop distances, price grid, exposure and free margin, round volume down and skip below the minimum. If the account currency differs, convert with appropriate current values. A mathematically qualified observation cannot guarantee accepted execution or bounded realized risk.
15. Compare three models without moving old signals
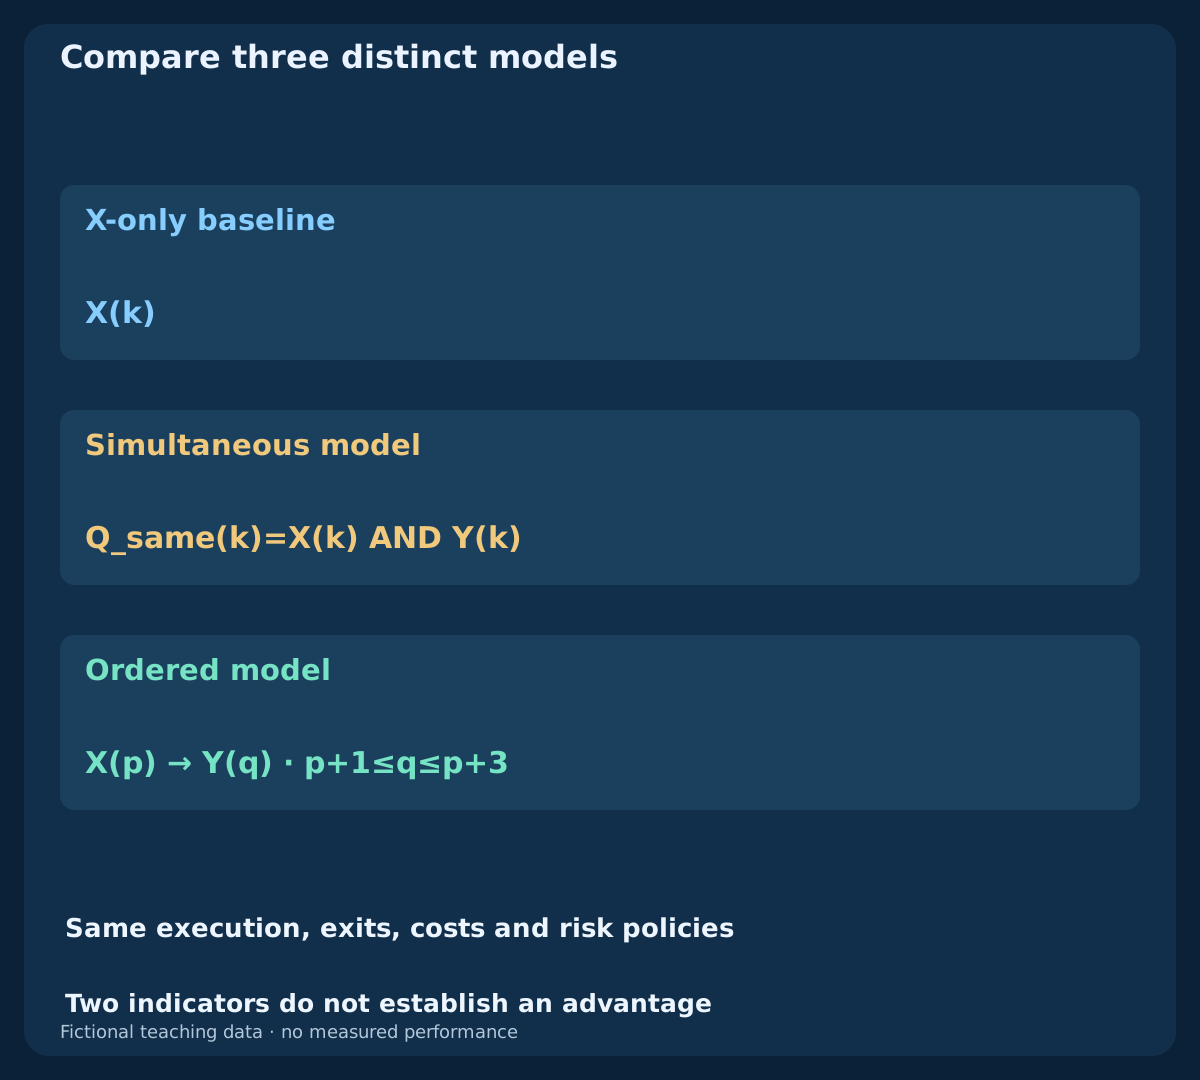
Log the same candidate X calendar, then compare an X-only baseline, Q_same and the ordered model as three distinct rules. Keep the data and full execution, exit, cost and risk policies fixed, but use each model’s actual decision time and first eligible quote. Ordered confirmation deliberately changes entry timing; do not backdate its fill to p or assume the earlier quote remained available.
Include every rejected start, cancellation, expiry, missed winner and failed execution. Reserve later data and retain all tried smoothing choices and window lengths. Review net expectancy, drawdown, sample uncertainty, turnover and cost sensitivity, not just win rate or cleaner charts. These synthetic observations test chronology and calculation, not profitability; more filtering can remove winners, losses or both.
16. Review the complete specification before writing a strategy
Name the feed, H1 completion clock, EMA seeds, native SMA9 signal, Stochastic K/D/slowing and price field. Distinguish M from M−G and zero-line events from main/signal events. State exact crossing equality, arming condition, deadline, cancellation priority, one-episode behavior and missing-data handling. Another reader should reproduce the flags without choosing a convenient chart afterward.
This is the second guide in the new three-pair cluster. Next comes Parabolic SAR with ADX, then the three separately specified strategies. Use the related EMA–Stochastic, MACD–RSI, cost, position-size and backtesting guides to compare roles and complete a research design. Two indicators can make a rule clearer; their agreement does not establish a trading advantage.
Frequently asked questions
Does a MACD histogram above zero mean a fresh signal crossover?
Not necessarily. Native MT4 MACD bars represent the main value M. The separate difference M−G crosses zero when main crosses signal. M crossing zero is another event. Check the actual implementation before interpreting the display.
Does native MT4 MACD use an EMA signal line?
The official MT4 reference uses a nine-value simple average of MACD main for the standard 12/26/9 calculation. Other platforms or custom indicators may use different smoothing, so matching period labels alone does not prove matching values or event times.
Must Stochastic be below 20 for the ordered model?
No. This guide requires a fresh upward K/D cross and the declared order, not an oversold episode. At timely confirmation K is already above 80. Adding a zone requirement is a separate rule.
Can the MACD confirmation arrive on the third bar?
Yes. The window includes p+1 through p+3. Check cancellation first, then a fresh Y; only if it has not confirmed does the episode expire after p+3. An event at p+4 is too late.
Why not reuse an earlier MACD cross when Stochastic turns up?
Because the ordered model requires Stochastic first and a fresh MACD event later. An already bullish MACD state is not a new cross. Simultaneous confirmation and reversed-order models need separate definitions.
Do two fresh crosses prove a profitable strategy?
No. They define observations. Executable entries, protection, exits, costs, volume, portfolio limits and evaluation on later data are still needed. The four fictional histories contain no measured trading returns.
Sources and educational notes
Official MetaQuotes sources document the MACD and Stochastic interfaces and reference calculations. The finite EMA seeds, four invented OHLC histories, event-order model and independent BUY quote example are original teaching specifications. Exact rational arithmetic defines the reference comparisons; CSV decimals are display approximations and the flags can be rebuilt from OHLC. No live-terminal parity, commercial EA behavior or historical trading returns are claimed.
- MetaTrader 4 Help: MACD calculation
- MQL4 Reference: iMACD
- MQL4 Reference: iStochastic
- MetaQuotes: Stochastic Oscillator reference
Educational content. All histories, calculations and BUY quotes are fictional. Forex trading involves risk. Indicator agreement, planned protection and cost reserves cannot guarantee profit or cap actual loss.