

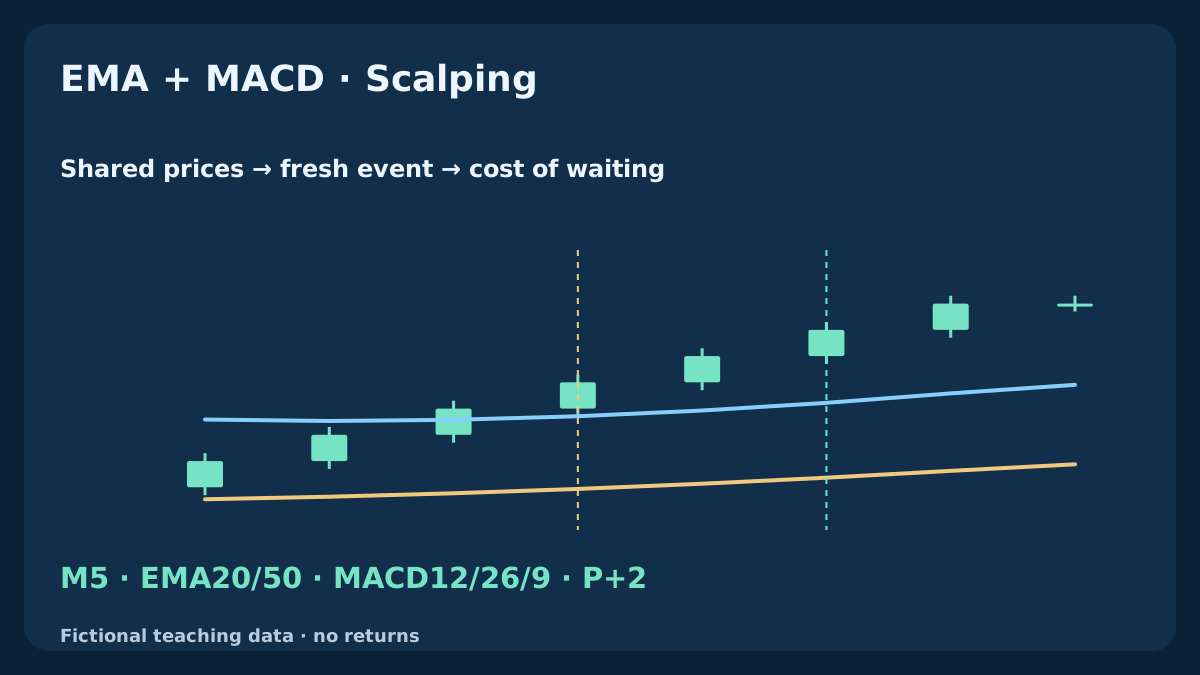
An EMA filter and MACD can appear to give two independent confirmations even when they express the same calculation. Waiting for another MACD crossing also changes the observation time and the available price. This guide separates shared information from a new event, defines an early observation and a finite delayed alternative, and reconstructs five M5 paths. A cleaner-looking chart is not evidence that the additional wait improves net results.
1. Ask what the second indicator actually adds
An EMA smooths a chosen price stream. MACD subtracts two EMAs of that stream, then compares the difference with a signal average. Their agreement is not independent evidence merely because it appears in separate chart panels. A sustained rise can make several related conditions positive together; sideways movement can create repeated crossings. Neither appearance establishes a useful trading edge after realistic costs.
The useful question is whether a precisely defined extra condition improves a fixed research process enough to justify its timing and execution consequences. We compare an early BUY-side observation A with a delayed observation B. These are recorded events, not market orders or complete strategies. Sessions, protection, exits, acceptable quotes, request timing and portfolio limits still require explicit rules before evaluating trading results.
2. Fix the price stream and every indicator input
Use fictional EURGBP Bid OHLC on M5, with Close as input. Context uses EMA20 / EMA50; MACD uses 12 / 26 / 9, with an SMA signal. Chart offset is 0. After observing a new bar, read completed buffers at shift=1 and their predecessors at shift=2. A chart offset is not the buffer index that selects a completed value.
The period choices and 2 bars confirmation window are declared examples, not optimized settings or a universal scalping recipe. Freeze symbol, quote side, missing-data policy and numerical comparisons before examining the outcome. If a required completed input is absent, terminate the pending observation, rebuild sufficient contiguous history and wait for a new eligible event. Do not silently carry an origin across an invented bar or a data gap.
| Component | Reference | Decision role |
|---|---|---|
| Price and clock | EURGBP · Bid · M5 · Close | One completed-bar calendar |
| Context | EMA20 / EMA50 · C>E50 | Price location, not independent proof |
| MACD | 12 / 26 · SMA9 · D=M−S | Separate X and Z events |
| Delayed observation | P+1...P+2 · T=1 · D>0 | Cancellation before expiry before Z |
3. Calculate the EMAs and expose the exact overlap
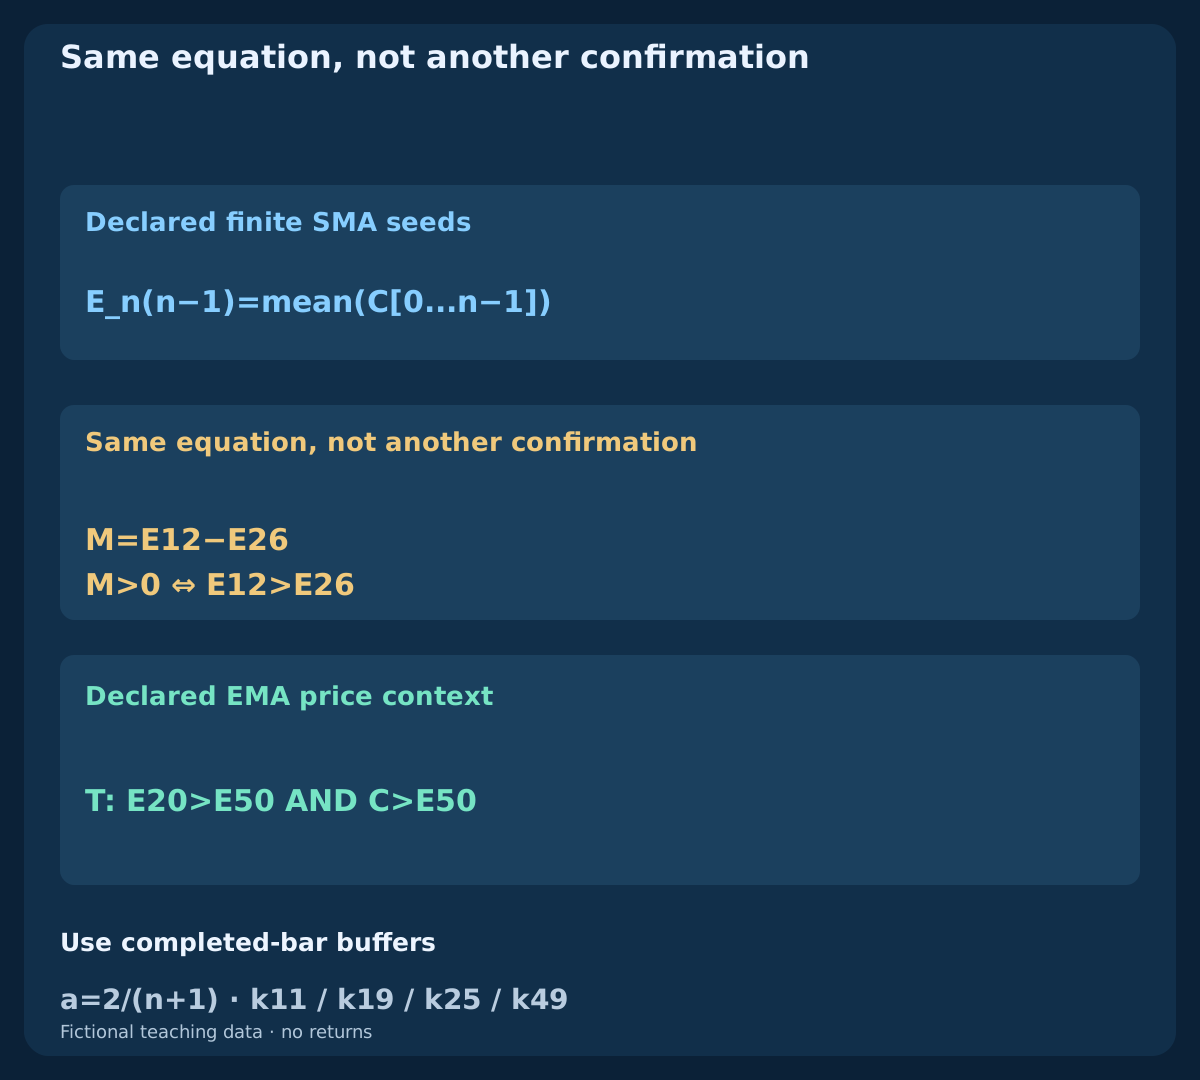
For period n, use a_n=2/(n+1). Our finite reference seeds E_n(n-1)=mean(C[0...n-1]), then applies E_n(k)=a_n*C(k)+(1-a_n)*E_n(k-1). First values occur at k11 / k19 / k25 / k49 for periods 12/20/26/50. An earlier history or another seed can change subsequent values; these reproducible seeds do not prove equality with a live terminal’s full history.
With identical inputs and alignment, M=E12-E26, so M>0 iff E12>E26. Asking for both does not add a second filter. Our context uses a different pair, 20/50, so it is not that exact duplicate, but all series still reuse the same closes. Separate logical duplication from statistical dependence. More indicator names do not automatically supply more independent information or reduce uncertainty.
4. Separate the main line, signal and OsMA
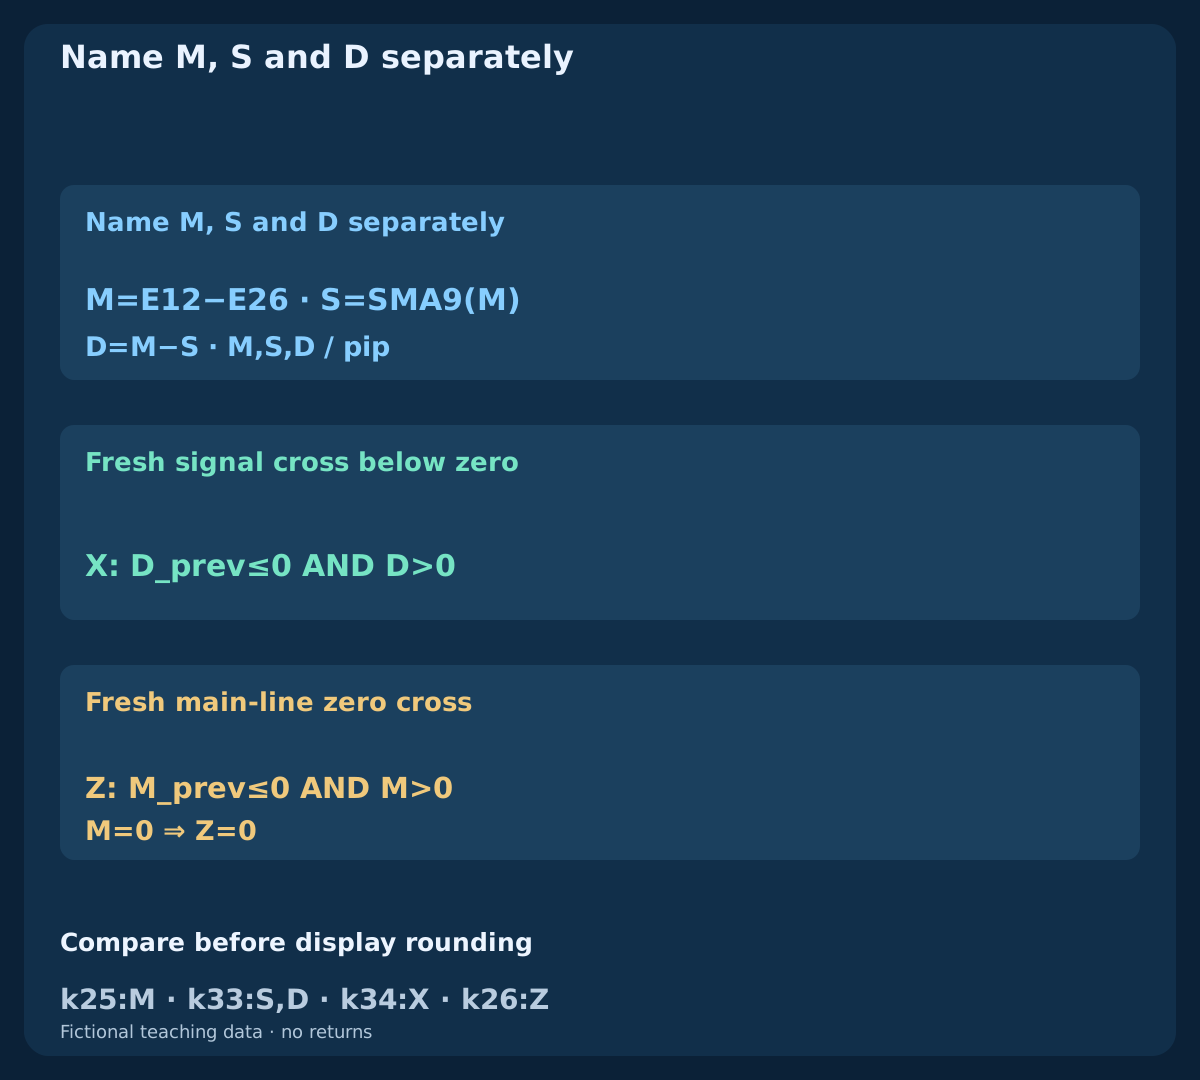
The reference defines M(k)=E12(k)-E26(k), S(k)=mean(M[k-8...k]) and D(k)=M(k)-S(k). M starts at k25, S and D at k33. A fresh signal-line crossing is X(k)=[D(k-1)<=0 AND D(k)>0], first assessable at k34. A fresh main-line zero crossing is Z(k)=[M(k-1)<=0 AND M(k)>0], assessable from k26.
In MT4’s standard MACD display the main series is drawn as bars; it is not automatically the main-minus-signal series often called a MACD histogram elsewhere. That difference is OsMA here. Identify the numerical buffer, not the drawing style. An EMA9 signal instead of our SMA9 changes the experiment. Calculations and comparisons use exact fractions before exporting decimals; rounding a small negative main value to zero must not create a crossing.
5. Define context and the eligible early origin
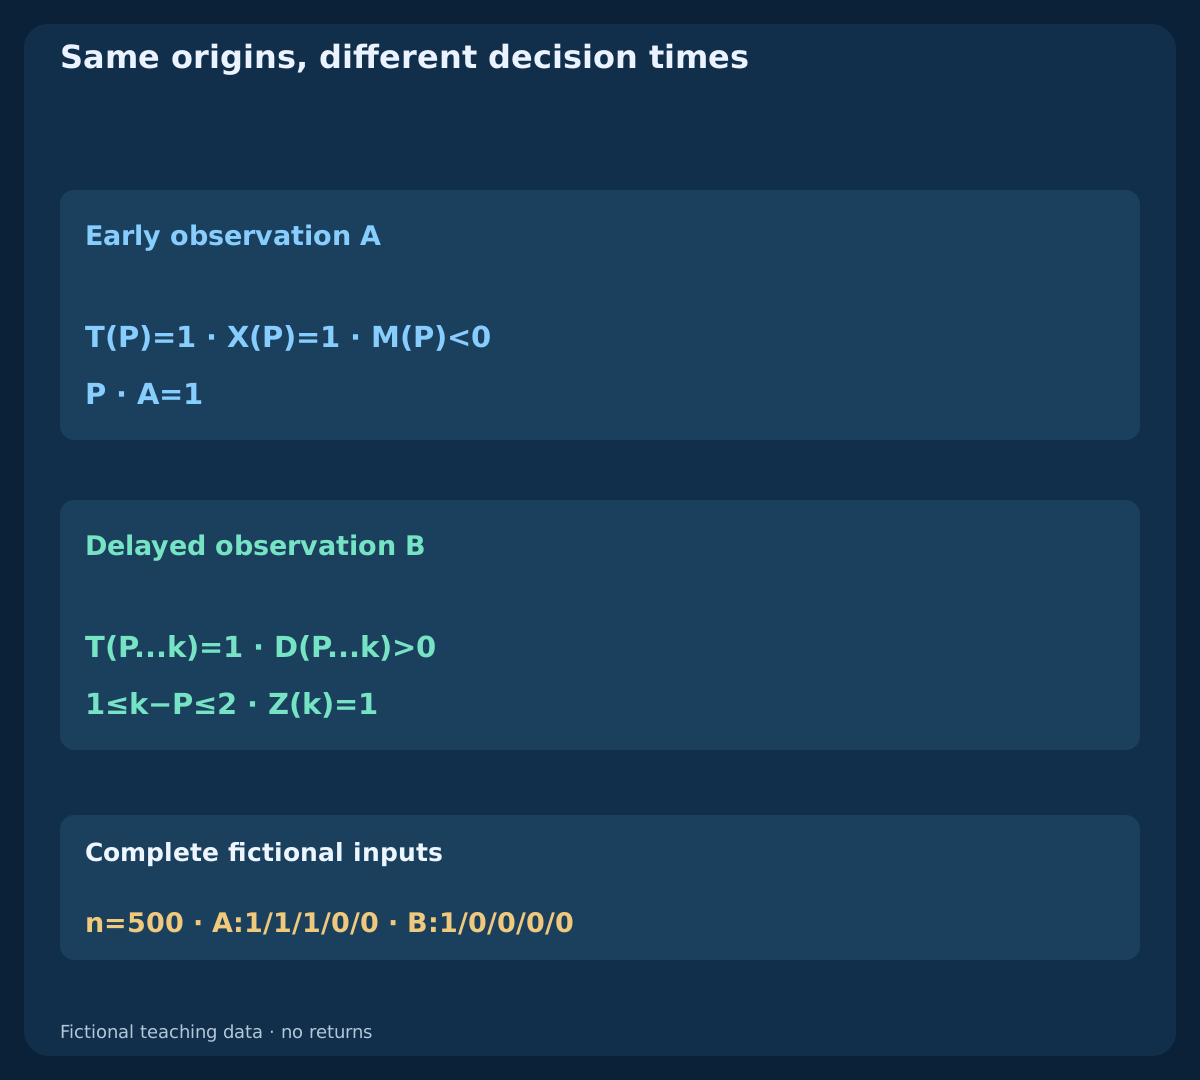
Let T(k)=[E20(k)>E50(k) AND C(k)>E50(k)], first available at k49. This is a declared price-location context, not proof of a persistent uptrend. An eligible origin P requires T(P)=1 AND X(P)=1 AND M(P)<0. Record A(P)=1 and open one delayed observation. Equality fails each strict price condition; a main value already at or above zero is outside this particular below-zero-origin study.
This origin asks about early improvement in MACD relative to its signal while the main line remains negative. It does not require an EMA20/50 cross on that same bar. A persistent positive D is not a new X. If T fails when X occurs, a later improvement in context cannot adopt that old event. Retain rejected raw crosses so a reader can see why a candidate was not eligible rather than only seeing selected successful examples.
6. Give the delayed alternative a finite ordered rule
Only P+1 and P+2 may confirm. At each subsequent completed bar first cancel if T=0 OR D<=0, next expire if k>P+2, then accept a fresh Z(k)=1 and record B(k)=1. Otherwise wait. A main value equal to zero is not positive. Context and main-above-signal must remain valid at every intervening completed bar, not merely at the eventual crossing.
After confirmation, cancellation or expiry, that P is closed. A later positive main line cannot revive it, and a row already processed as pending is never reused to open another origin on the same bar. A future independent X can start another observation only if all origin conditions pass anew. This is not a ban on future research events; it prevents a failed episode from acquiring a convenient later confirmation or a silently extended deadline.
7. Reconstruct five fictional histories from their beginning
The public file contains 5 independent histories of 100 bars, 500 rows. Three share their first 76 closes: 60 increasing tick-grid values, 10 declining values and 6 recovery values. Their branches are timely / late_zero / signal_lost. A fourth, context_late, uses another slower advance and recovery; the fifth has constant OHLC. The file includes every EMA, M, S, D, context, crossing, origin and observation flag.
Rows carry scheduled UTC completion times beginning at 01:45 UTC. The shared origin is P=k75 / 08:00 UTC. The separate context_late crossing occurs at k72 / 07:45 UTC. Recalculate each history independently, including the declared seeds. OHLC bodies and wicks are constructed from closes on a fixed price grid. These paths test definitions, precision and ordering; they supply neither market frequencies nor measured trade returns.
Download fictional EMA–MACD M5 inputs and calculations (CSV)
8. Read a signal cross below zero and a timely confirmation
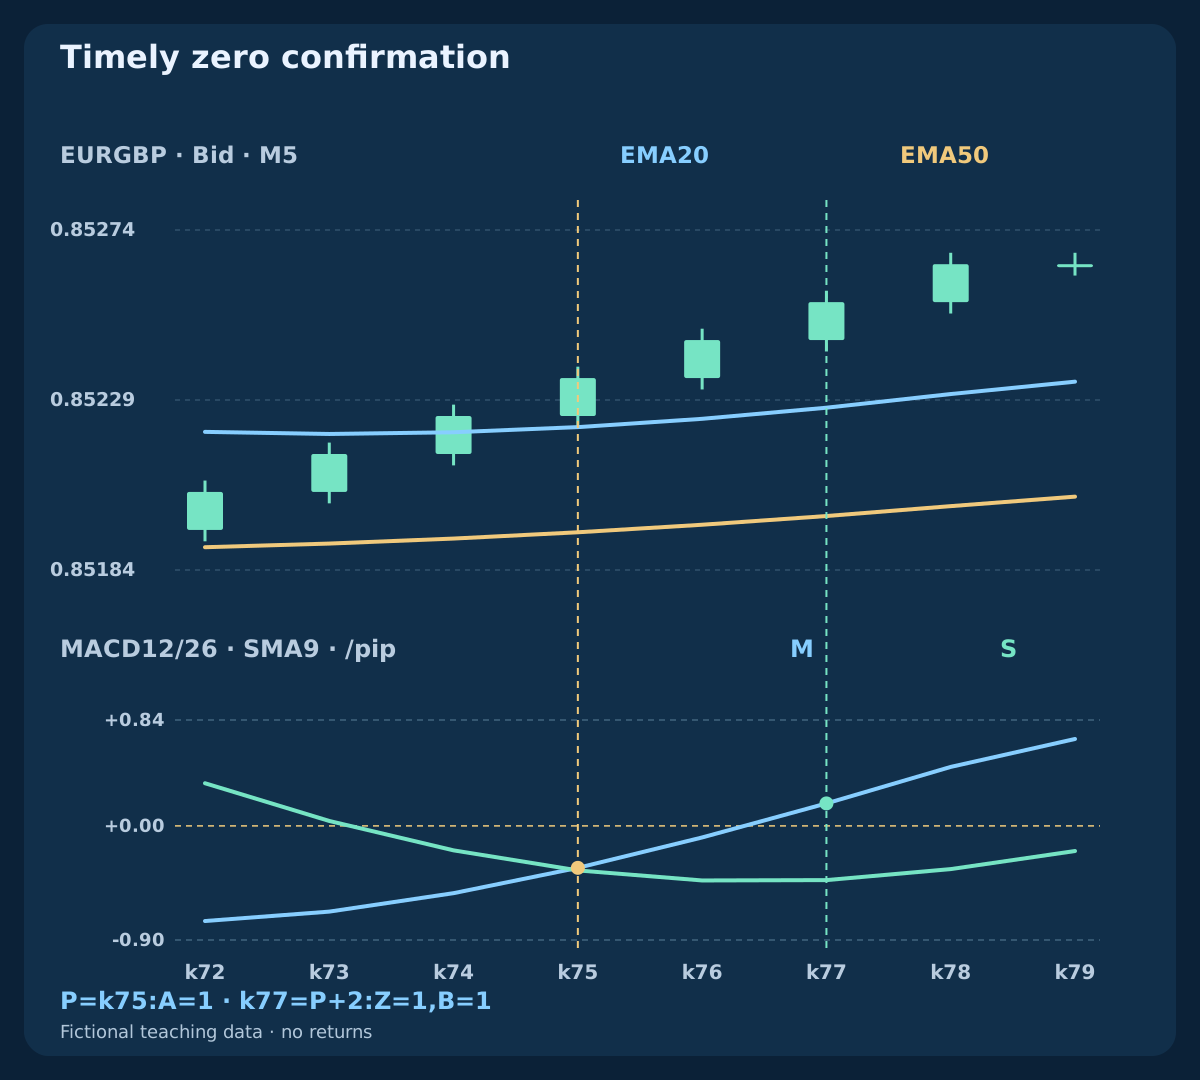
At the shared P, close is 0.85235 and T passes. In pip-scaled units, M is -0.3316, S -0.3520 and D +0.0204; the previous D was negative. Thus X=1 and A=1 while M is still below zero. Main and signal are different negative numbers, so an upward signal cross does not require a positive main line.
The next main value remains negative. At k77 / 08:10 UTC, close is 0.85255, M is +0.1778 pips and S -0.4285 pips. Context and D stayed valid, so Z=1 confirms at P+2 and B=1. The plotted closes differ by 2.0 pips. That is a price-path observation, not an executable entry difference or evidence that either observation earned a profit.
| Branch / bar | Close Bid | M / pip | S / pip | T | X | Z | A | B | Status |
|---|---|---|---|---|---|---|---|---|---|
| timely · k75 | 0.85235 | -0.3316 | -0.3520 | 1 | 1 | 0 | 1 | 0 | Fresh signal cross below zero |
| timely · k77 | 0.85255 | 0.1778 | -0.4285 | 1 | 0 | 1 | 0 | 1 | Timely zero confirmation |
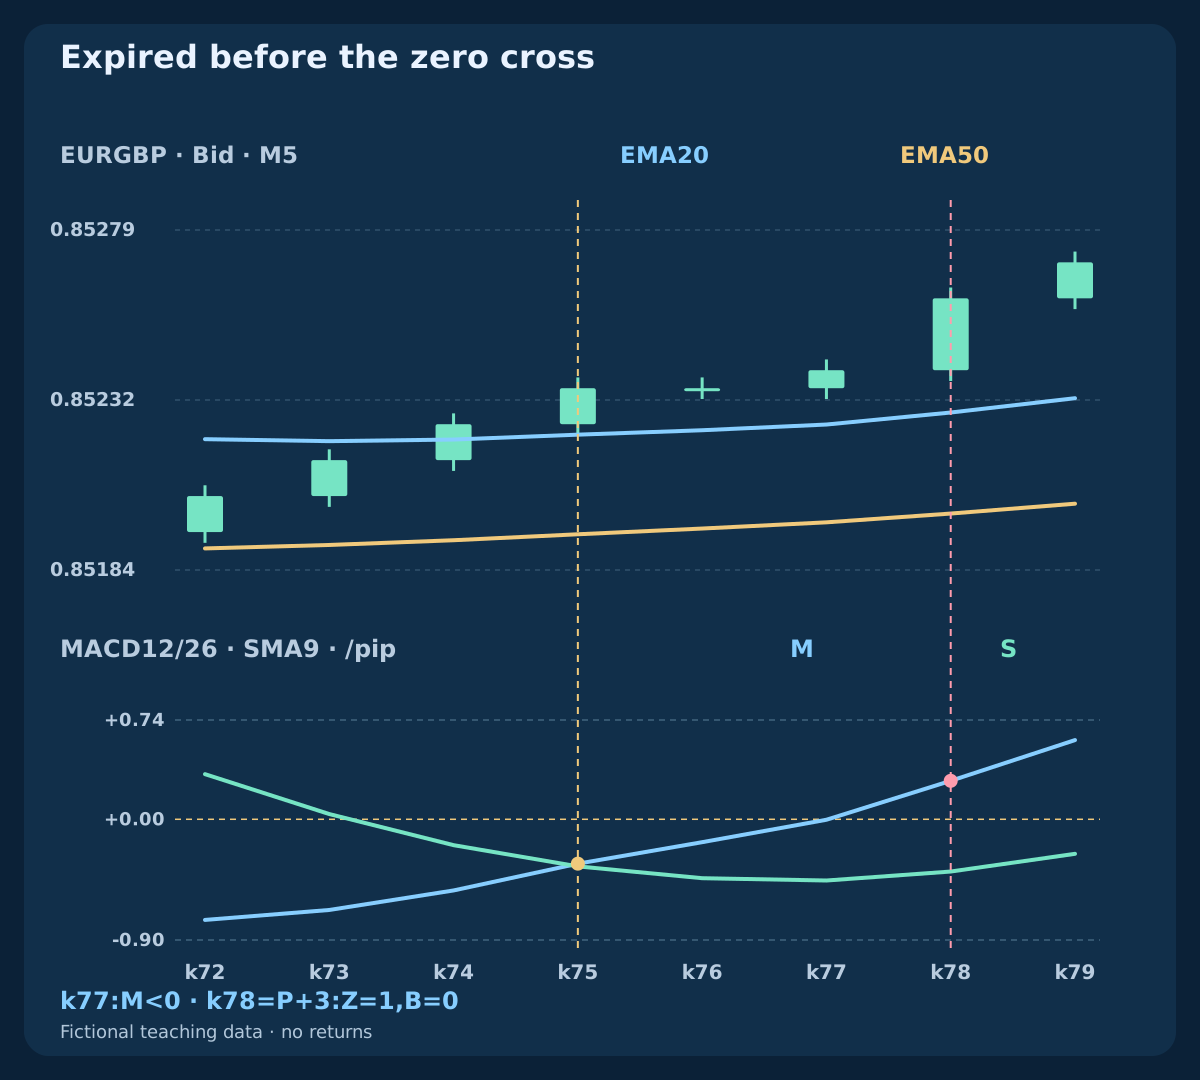
| late_zero · k77 | 0.85240 | -0.0035 | -0.4575 | 1 | 0 | 0 | 0 | 0 | Delayed observation B |
| late_zero · k78 | 0.85260 | 0.2874 | -0.3904 | 1 | 0 | 1 | 0 | 0 | Expired before the zero cross |
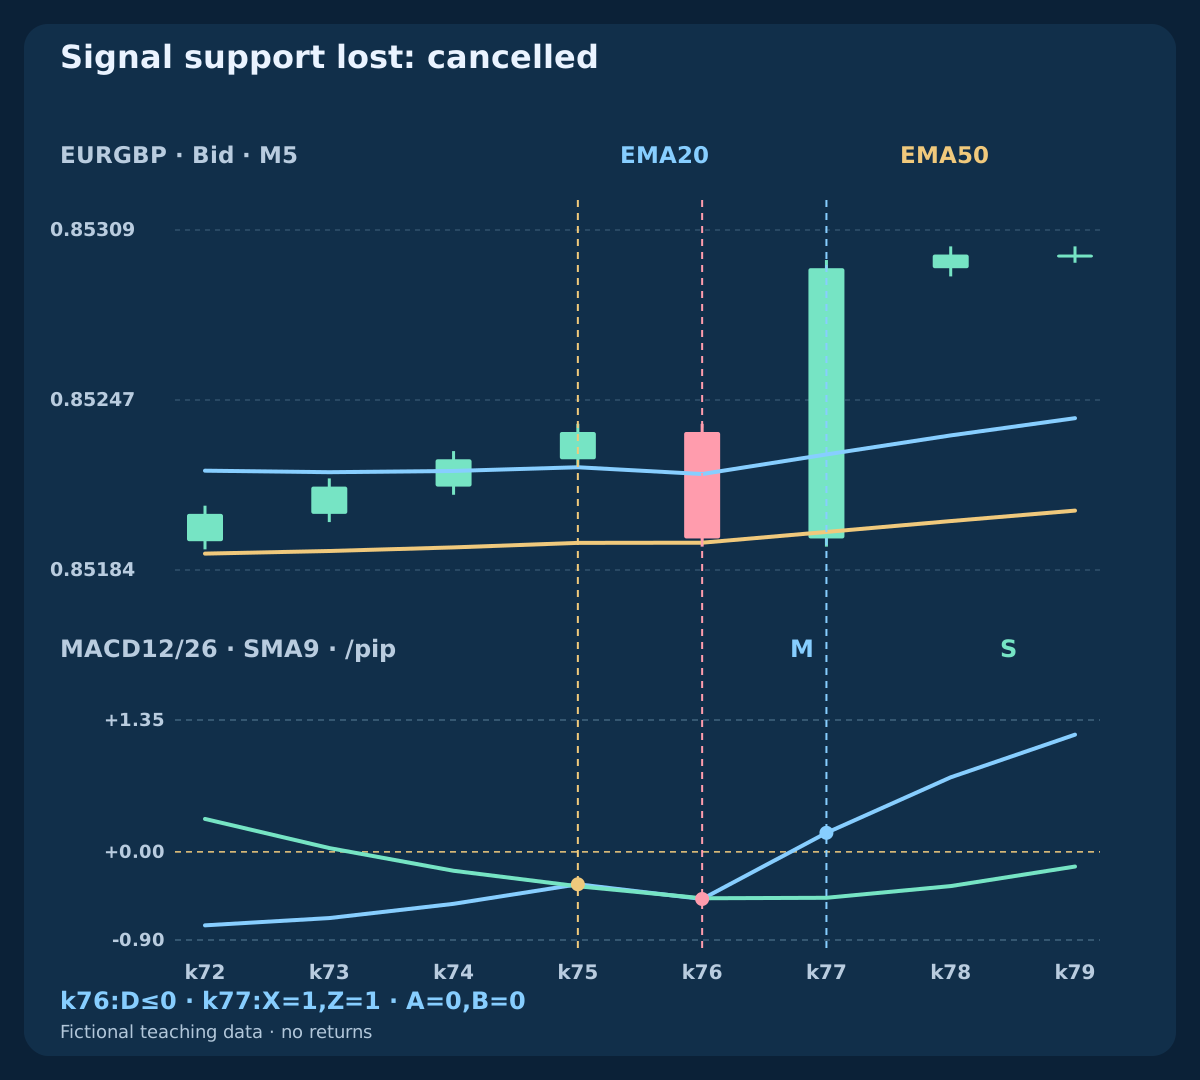
| signal_lost · k76 | 0.85196 | -0.4822 | -0.4749 | 1 | 0 | 0 | 0 | 0 | Signal support lost: cancelled |
| signal_lost · k77 | 0.85295 | 0.1951 | -0.4700 | 1 | 1 | 1 | 0 | 0 | New cross outside the start condition |
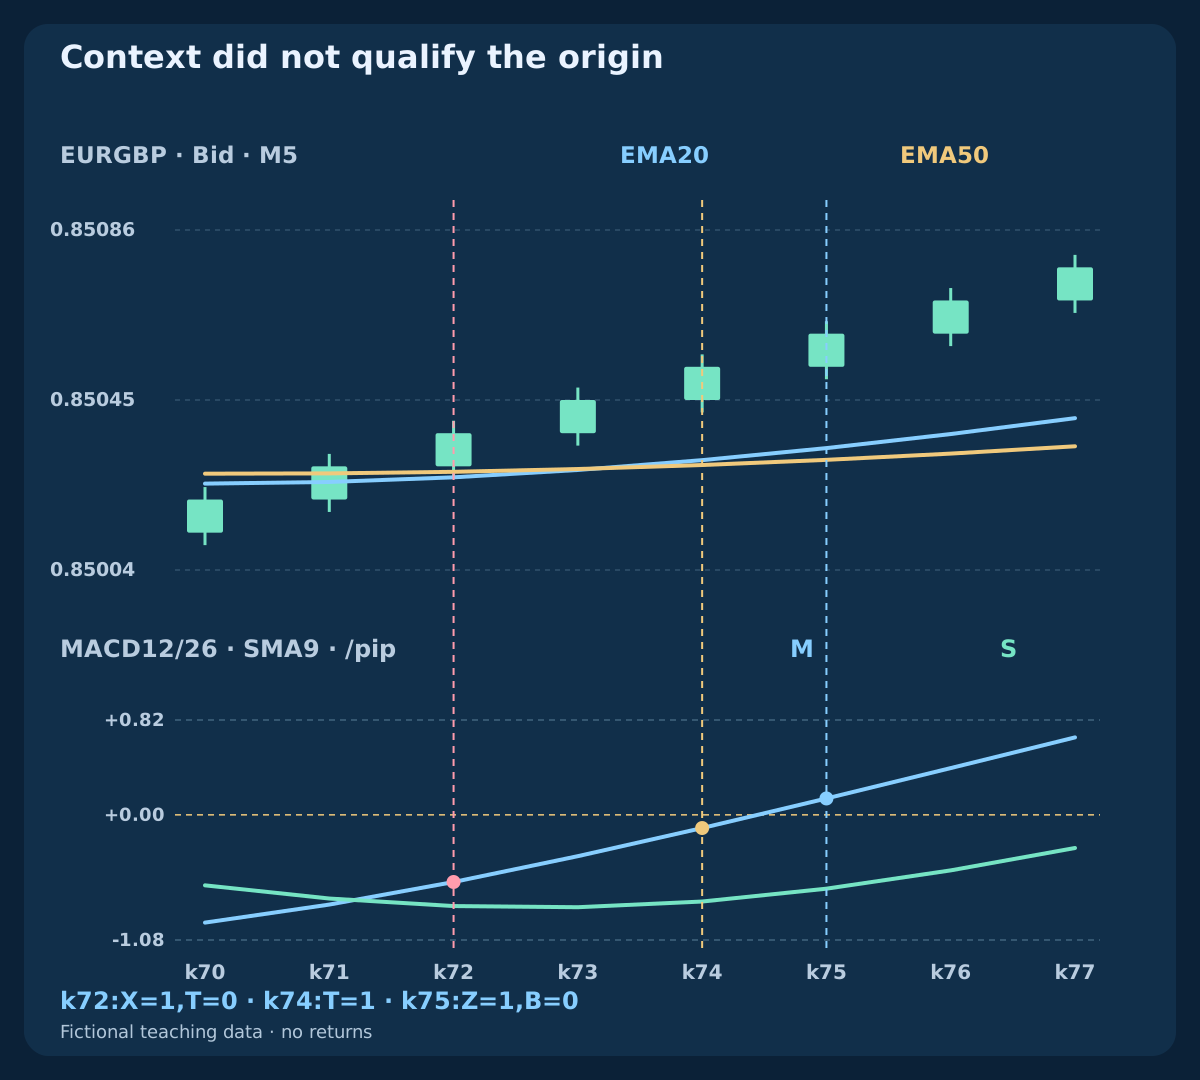
| context_late · k72 | 0.85037 | -0.5790 | -0.7865 | 0 | 1 | 0 | 0 | 0 | Context did not qualify the origin |
| context_late · k74 | 0.85053 | -0.1137 | -0.7474 | 1 | 0 | 0 | 0 | 0 | Declared EMA price context |
| context_late · k75 | 0.85061 | 0.1414 | -0.6366 | 1 | 0 | 1 | 0 | 0 | Zero cross without an active origin |
| flat · k77 | 0.85000 | 0.0000 | 0.0000 | 0 | 0 | 0 | 0 | 0 | Flat inputs: no strict events |
9. Keep the near-zero value and the late crossing distinct
In late_zero, the main line at k77 is still about -0.0035 pips. D is positive and T remains valid, but there is no strict main-line zero crossing. Rounding the price-unit main value to a few decimal places could erase its negative sign or make it look like zero. The comparison uses the exact underlying value; the displayed precision does not define the event.
At k78 / 08:15 UTC, M turns positive and Z=1. This is P+3. Expiry takes priority, so B=0 even though the chart now looks more convincingly aligned. The earlier A remains an earlier observation; it cannot lend its timestamp or price to the late alternative. A longer window would be a separately declared candidate with its own full comparison, not a retrospective repair.
10. Cancel the delayed observation when signal support fails
In signal_lost, the close at k76 is 0.85196. EMA context still passes, but D is approximately -0.0073 pips. Main no longer exceeds signal, so the delayed observation is cancelled immediately. The loss of that mathematical condition is an observation invalidation; it is not an executed stop, a realized loss or a money-risk boundary.
At k77, a strong recovery produces X=1 AND Z=1 with M now positive. The old P stays cancelled and B=0. This new X also fails the below-zero origin requirement, so A=0 on that bar. A different model allowing simultaneous positive-main starts is possible, but must be specified and tested independently rather than borrowing this history’s earlier origin or treating every crossing as interchangeable.
11. Do not attach restored context to an old event
The independent context_late path has a fresh X at k72, but E20=0.85026351 is below E50=0.85027680. T fails, so A=0 and no delayed observation opens. At k74, context passes, but X is no longer fresh. At k75, the main line crosses zero without an active P, leaving B=0.
This is a different rejection from losing support after an eligible start. Keep both categories in the record. The flat history adds an equality check: matching seeded averages give zero M and D, no strict X or Z and no T. Exact calculations prevent a rounding plateau from manufacturing events. Real choppy prices are less tidy; passing a declared EMA context can still be followed by reversals, repeated crosses and costly turnover.
12. Separate completed-bar time from the order clock
The P bar opens at 07:55 UTC and completes at 08:00 UTC. Its two later M5 slots complete at 08:05 UTC and 08:10 UTC; 08:15 UTC is outside the window. The final indicator value is available only after subsequent data reveal the bar has ended. A historical boundary is not proof that an executable quote or a filled order existed at that instant.
Convert the broker clock with the actual offset for that date and keep the mapping. A complete strategy needs a separate maximum quote age, request delay, acceptable price distance and retry policy. Moving to M1 changes the input history and real elapsed window. The same numerical periods do not preserve signals across timeframes. Compare the faster version as a new frozen experiment, including its own turnover and execution costs.
| Stage UTC | Available information | Still undecided |
|---|---|---|
| P · 08:00 | Eligible X below zero; A | Future Z and executable quote |
| P+1 · 08:05 | First later completed bar | Second bar and actual request |
| P+2 · 08:10 | Last eligible Z; B if all checks pass | Actual request and fill |
| P+3 · 08:15 | Expired if no earlier confirmation | No reuse of the old origin |
13. Compare independent EURGBP BUY quotes after costs
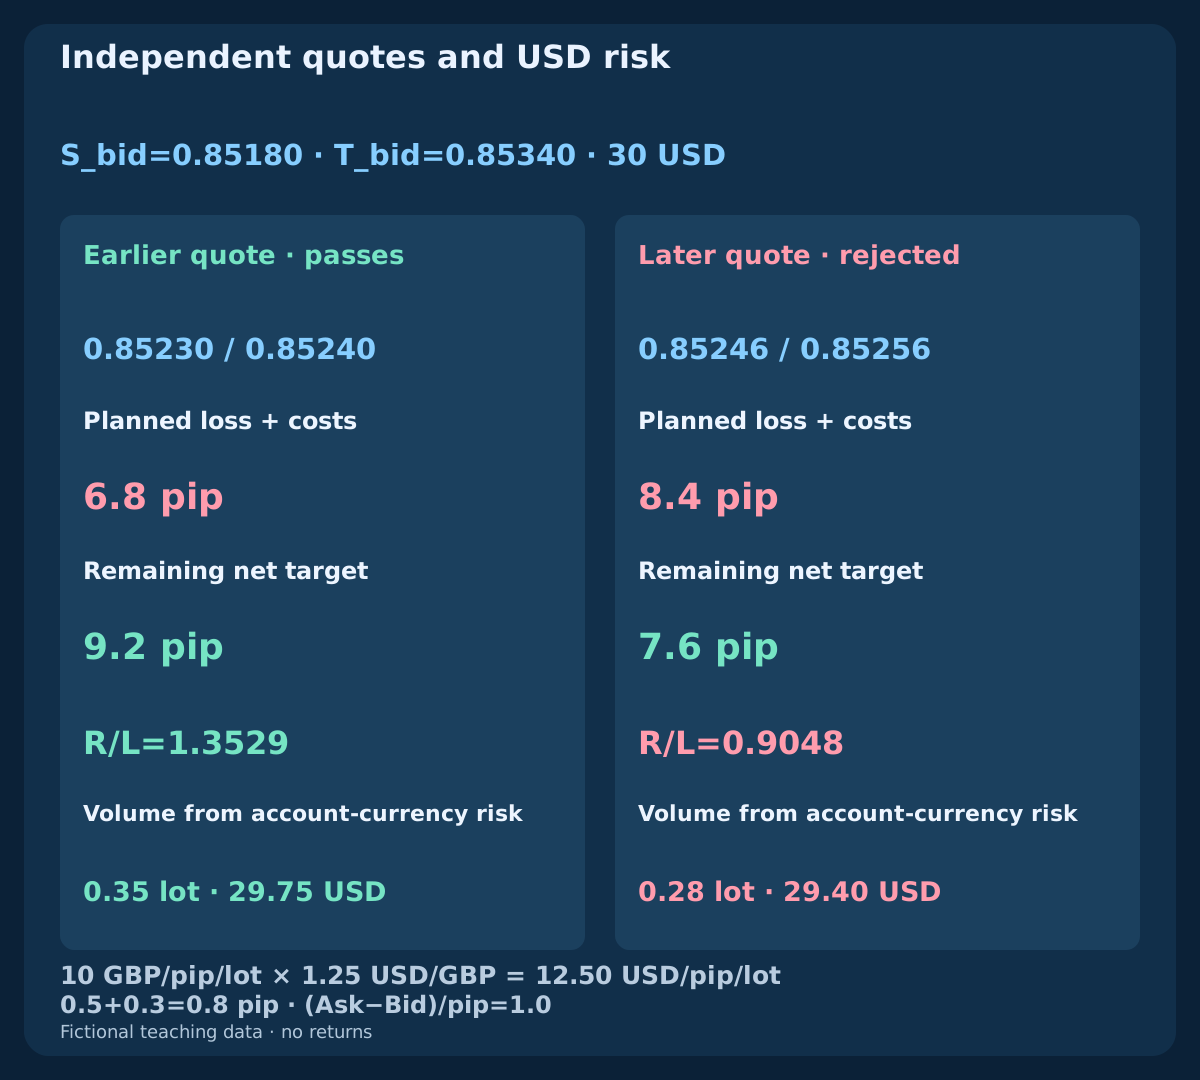
This separate comparison fixes Bid-side stop 0.85180 and target 0.85340. Earlier Bid/Ask is 0.85230 / 0.85240; later it is 0.85246 / 0.85256. Both spreads are 1.0 pip. Round-trip commission 0.5 pip plus a total adverse-execution reserve 0.3 pip adds 0.8 pip. Earlier planned loss is 6.8 pips, net target 9.2 pips and ratio 1.3529; later these are 8.4 pips, 7.6 pips and 0.9048.
The declared comparison threshold is net reward / planned loss >=1.20. Only the earlier quote passes. Equity 10000 USD and budget 0.30%=30 USD, with assumed pip value 12.50 USD per standard lot and 0.01 lot step, allow 0.35 lots / 29.75 USD earlier. Later comparison-only sizing is 0.28 lots / 29.40 USD; a smaller volume does not fix its failed ratio. These alternative quotes are independent of the histories, not recorded fills after the plotted bars.
| Quote | Bid / Ask | Stop (pip) | Loss + costs | Net target | Ratio | Lots | Risk USD |
|---|---|---|---|---|---|---|---|
| Earlier quote · passes | 0.85230 / 0.85240 | 6.0 | 6.8 | 9.2 | 1.3529 | 0.35 | 29.75 |
| Later quote · rejected | 0.85246 / 0.85256 | 7.6 | 8.4 | 7.6 | 0.9048 | 0.28 | 29.40 |
14. Convert quote-currency risk and count spread once
Assume a 100000 EUR contract and pip 0.0001. One standard-lot pip is 10 GBP, not 10 USD. With the fictional planning conversion 1 GBP=1.25 USD, it is 12.50 USD. Point and tick are assumed 0.00001. Verify the actual contract, quote-to-account conversion, lot constraints, margin and stop rules. The conversion can change before an actual exit, so this fixed planning assumption is not a guaranteed future cash value.
For BUY, use (Ask-S_bid)/pip and (T_bid-Ask)/pip before commission and reserve. The executable-side spread effect is already present; do not add the spread again. SELL uses Bid entry and Ask exits under separately defined rules. Planned protection and an execution reserve cannot cap real losses through gaps, slippage or rejected requests. After a timeout, reconcile actual orders and fills before retrying; an indicator’s renewed agreement does not resolve an unknown order outcome.
15. Compare early and delayed rules on common origins
Compare A and B using the same eligible P calendar, retaining cancellations, expiry and missing observations. A is earlier and B has an additional condition and another decision time. Once trading rules are complete, give both variants the same quote-availability policy, protection, exits, costs and sizing method, applied at their respective actual observation times. Do not assign A’s earlier price to B or judge only the subset that eventually confirms.
Freeze the search space and reserve untouched later data. Record every tried EMA pair, MACD period, signal method, context and deadline. Assess net expectancy, drawdown, turnover, uncertainty and cost sensitivity; a reduced event count or selected higher win rate does not settle usefulness. Tick order matters when exits compete inside one bar. The five constructed paths validate mechanics only, and provide no estimate of which variant will perform better on unseen market data.
16. Finish the guide foundation before defining a strategy
The research record must identify price side, timeframe, EMA seeds, MACD signal method, buffer alignment, exact comparisons and data availability. It must separate M, S and D, state X and Z explicitly, identify redundant predicates and freeze origin, cancellation and expiry priority. Another reader should obtain the same event calendar without choosing a favourable chart after seeing the outcome or changing settings on a difficult branch.
This is the third guide in the scalping-combination group. EMA–RSI examines a finite momentum-reset sequence; Bollinger–Stochastic examines a first return above a frozen edge. Their rules remain separate. The next phase builds complete strategies after the guide foundation and live checks. Related articles on scalping data, currency conversion and existing MACD models supply context, while actual entry, protection, exit, session and portfolio specifications still have to be completed.
Frequently asked questions
Is MACD above zero a second confirmation of EMA12 above EMA26?
With the same prices, periods, seeds and alignment, those predicates are identical because the main line is EMA12 minus EMA26. Counting them twice adds no new selection. EMA20/50 is a different pair but still uses overlapping prices.
Are the bars in standard MT4 MACD the same as OsMA?
The standard MT4 MACD draws its main line as bars. OsMA is main minus signal. Other chart packages can use the word histogram for that difference. Verify the series and signal method instead of relying on its visual style.
Can a fresh signal cross happen below zero?
Yes. The main line may rise above a more negative signal while both remain negative. In timely, X appears at k75 and the main-line zero cross only at k77. They have different conditions and timestamps.
Does a main value equal to zero confirm the delayed observation?
No. Z requires the preceding main value at or below zero and the current value strictly above it. Display rounding does not define that comparison. A confirmation must also remain inside the two-bar window with continuous context and signal support.
Can later EMA agreement rescue an earlier rejected cross?
No. Context must pass at the fresh origin. In context_late, it fails at k72 and passes later without a new eligible X. The subsequent zero cross has no active P. A different timing rule must be studied separately.
Do A and B describe profitable scalping strategies?
They describe BUY-side observations only. No trading returns are measured. Complete order, protection, exit, session, quote, cost and portfolio rules, then test suitable unseen data and execution assumptions before assessing performance.
Sources and research notes
MetaQuotes documents iMA and iMACD inputs, the MACD main line with a simple signal average, OsMA as main minus signal, and executable order prices. Our finite SMA seeds, exact rational comparisons, observation windows and fictional histories are declared research choices, not a terminal-parity claim or demonstrated optimum. Both downloads expose the inputs and calculations; the independent quote comparison uses an assumed currency-conversion rate.
- MetaTrader 4 Help: MACD
- MQL4 Reference: iMA
- MQL4 Reference: iMACD
- MetaTrader 4 Help: OsMA
- MQL4 Reference: OrderSend
Educational content. All histories, quotes and conversion rates here are fictional. Forex trading involves risk. Related indicators, confirmation waits, planned stops and cost reserves cannot guarantee profitable execution or limit actual losses.