

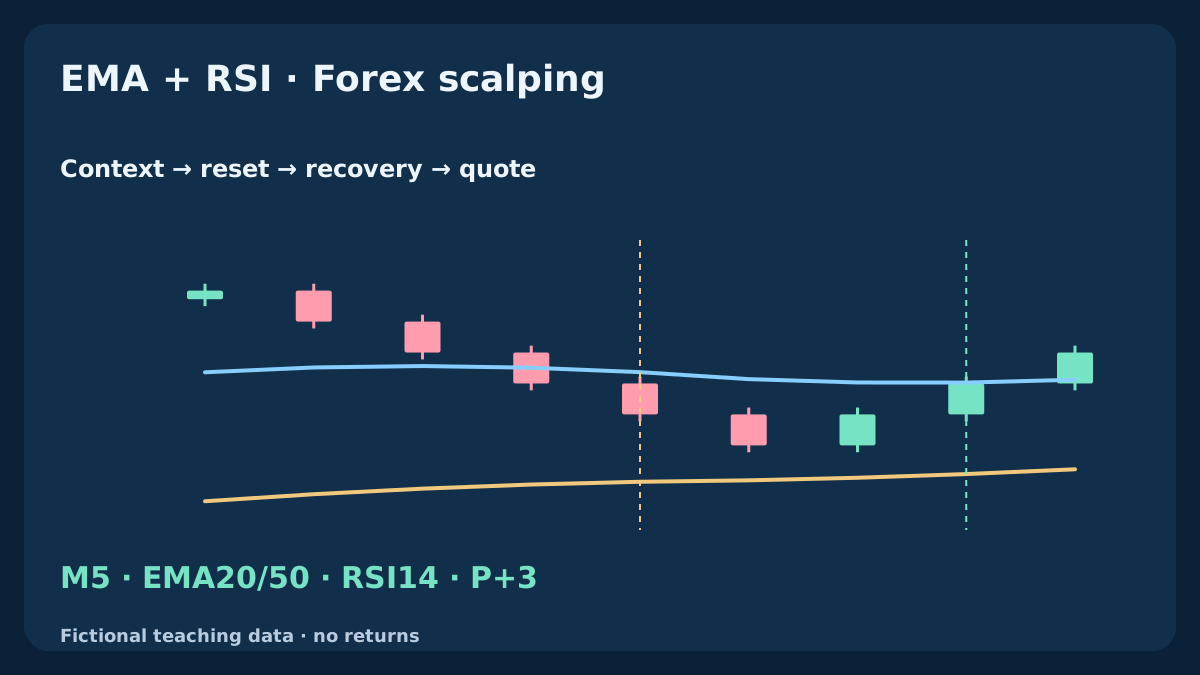
An EMA trend filter and an RSI recovery can describe two stages of a scalping idea: the background direction and a new change after a pullback. The difficult part is deciding when that change is still fresh, when its context has failed and whether the next executable quote leaves enough room after costs. This guide builds a reproducible M5 observation model before any complete trading strategy is specified.
1. Start with the decision the combination must change
EMA and RSI both transform price history. Giving them different jobs makes the rules easier to inspect, but their agreement is not two independent pieces of evidence. Here EMA describes a directional background, while RSI identifies a pullback episode and its later recovery. A chart with price rising above an average and RSI above its midpoint is only a state until a fresh event is defined.
The question is whether a recent reset adds useful selectivity to an otherwise comparable momentum observation. This guide defines a BUY-side observation called Q, not an order instruction. It deliberately stops before a full strategy: trading sessions, protection construction, execution deadlines, exits and portfolio limits still need a separate specification and testing.
For the scalping interpretation of band location and oscillator timing, see Bollinger Bands and Stochastic for Forex scalping. It compares the first return above a frozen edge with moving-band effects and late confirmation; its observation model is separate from this page’s rules.
2. Freeze the reference settings and the data clock
Use fictional EURUSD Bid OHLC bars on M5, close-price EMA20/50 and RSI14. EMA chart shift is 0; completed-bar reads use buffer shift=1 after a new bar is observed. The trend slope compares the slow EMA with its value 3 completed bars earlier. Inputs and all observation decisions stay on this same timeframe.
The thresholds 45 / 50 / 35 and the recovery window of 3 bars are declared research choices, not recommended optimal settings. Use full-precision values for comparisons. Define missing-history handling before computing flags: if a required bar is absent or the indicator is not ready, end any active episode and wait for sufficient contiguous data rather than filling the gap with an invented candle.
| Component | Reference | Decision role |
|---|---|---|
| Price and clock | EURUSD · Bid · M5 · Close | One completed-bar calendar |
| EMA | 20 / 50 · shift 0 · slope 3 | Trend context T |
| RSI | 14 · Wilder-style smoothing | Reset 45 · recovery 50 · floor 35 |
| Episode | P+1...P+3 | No extension after expiry |
3. Calculate the EMA context without inventing support
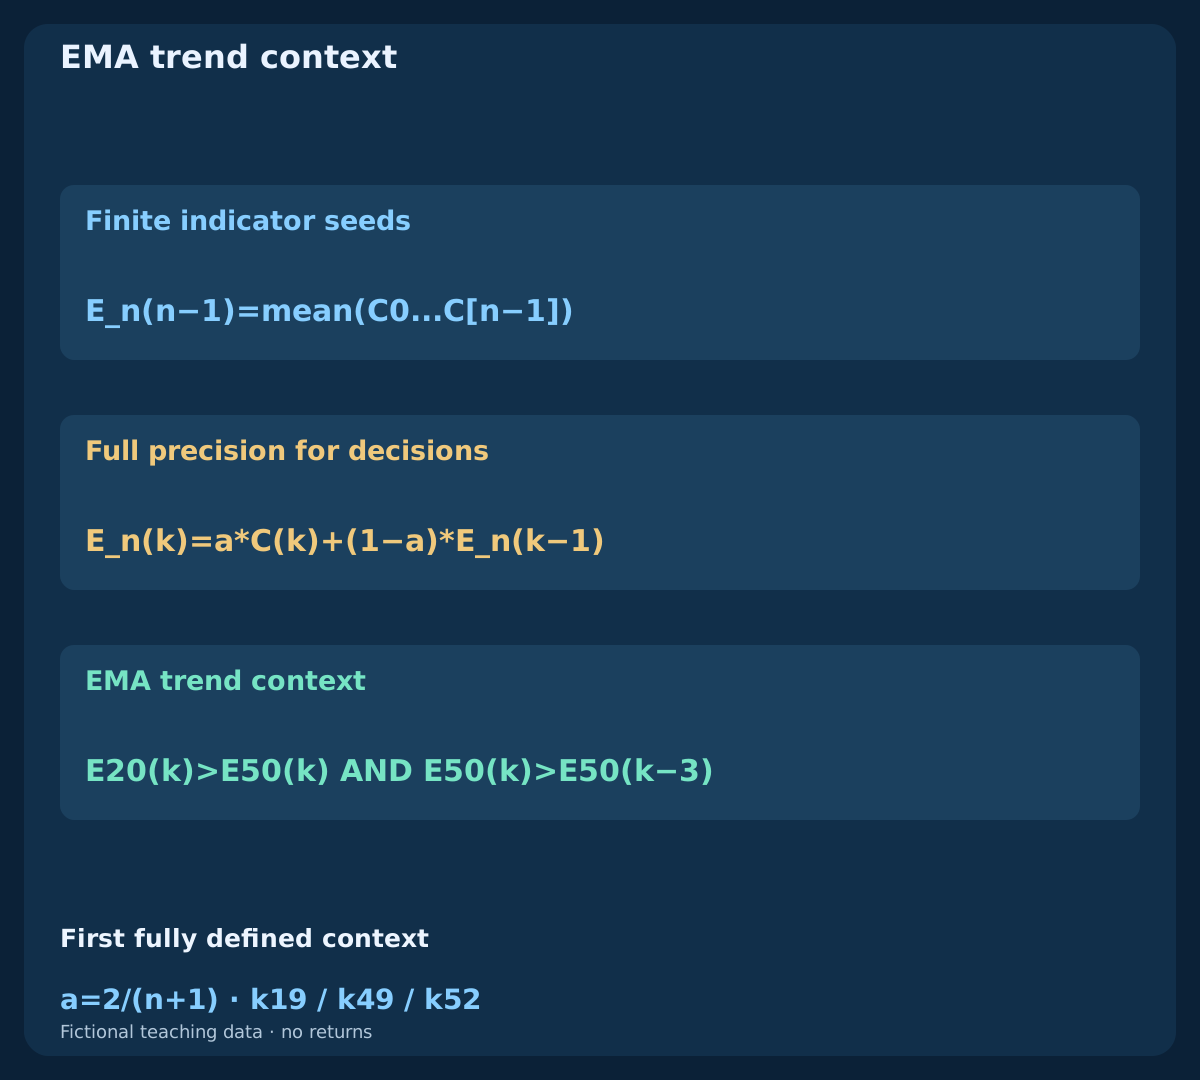
For period n, use alpha=2/(n+1). Seed the finite example at k=n-1 with the arithmetic mean of the first n closes, then update E_n(k)=alpha*C(k)+(1-alpha)*E_n(k-1). The first EMA20 and EMA50 values are at k19 and k49. Seed choice and available earlier history can change terminal comparisons, especially near a threshold.
The context is T(k)=[E20(k)>E50(k)] AND [E50(k)>E50(k-3)]. It first becomes assessable at k52. Strict equality fails either comparison. This permits price to dip below the fast average during a pullback; no EMA touch or reclaim is required by T. A rising smoothed average neither establishes a support level nor prevents a continued decline.
4. Make the RSI smoothing and zero cases reproducible
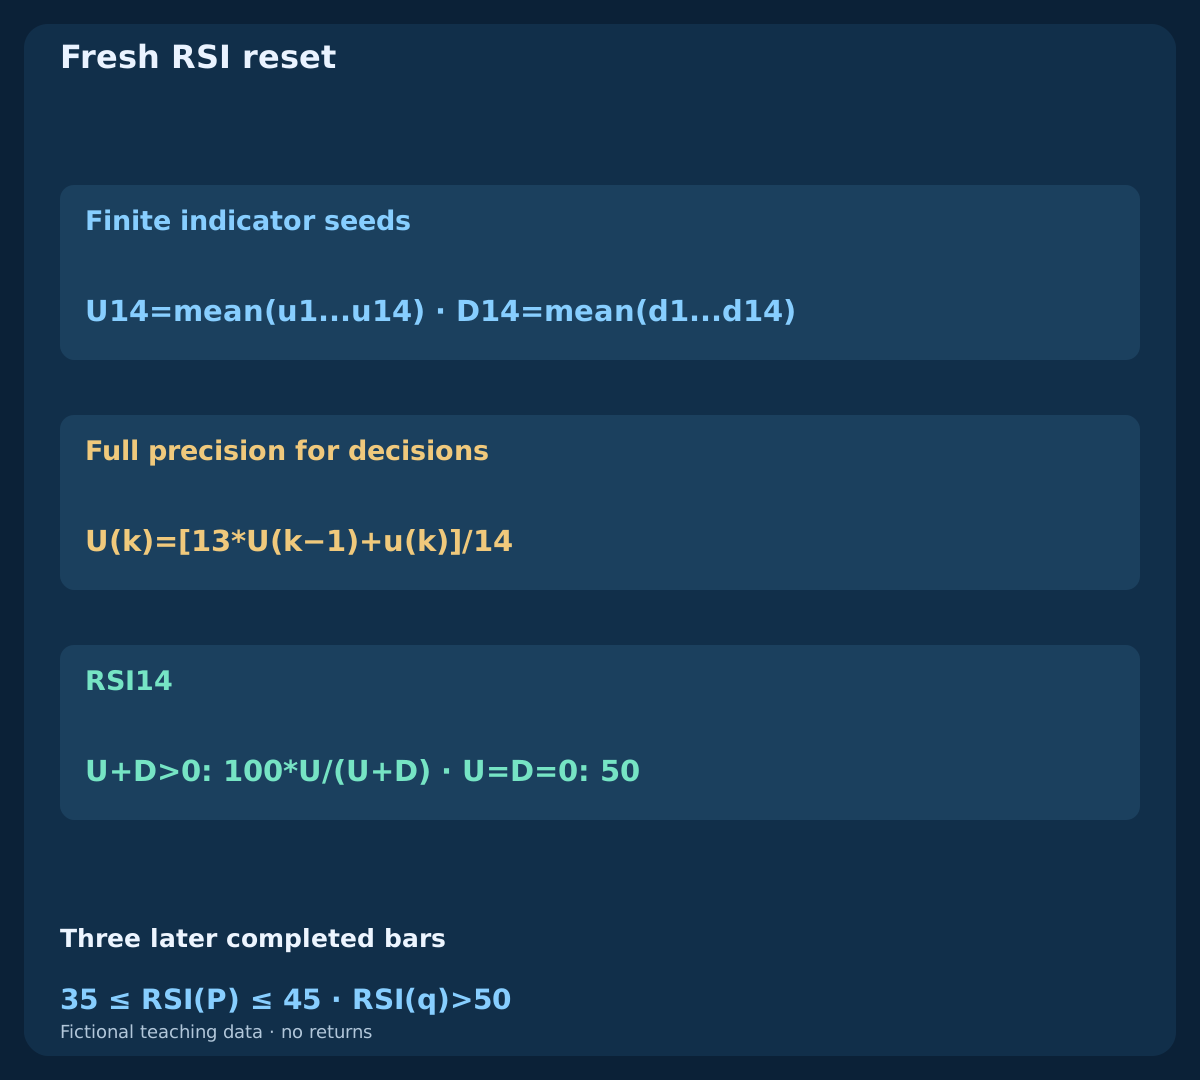
For each close change, define u(k)=max(C(k)-C(k-1),0) and d(k)=max(C(k-1)-C(k),0). At k14, seed U and D with the respective means of changes k1...k14. Later use U(k)=[13*U(k-1)+u(k)]/14 and the same recurrence for D. Calculate RSI=100*U/(U+D) when the denominator is positive.
If only D is zero, RSI is 100; if only U is zero, it is 0. When both are zero, this finite model assigns 50. That flat-data convention is explicit, not a claim about every implementation. RSI summarises smoothed up and down changes; a high reading can persist in a rise, and a low reading can persist in a fall. Neither extreme alone commands a reversal trade.
5. Distinguish a reset, a recovery and a persistent state
A fresh reset crossing is RSI(k-1)>45 AND 35<=RSI(k)<=45. It can open an episode only when T passes and no earlier episode is active. Record its completed bar as P. An RSI reading already below the reset threshold on several bars does not create a new P every time the chart is inspected. A reset names a threshold event; it never restarts the RSI calculation.
A fresh midpoint recovery is X50(k)=[RSI(k-1)<=50 AND RSI(k)>50]. RSI exactly at the midpoint has not yet recovered; remaining above it on the next bar is not another crossing. An X50 without an active, unexpired reset remains an unarmed observation. These distinctions prevent one attractive price move from being counted repeatedly as several new signals.
6. Give the reset a finite lifetime and deterministic priority
After a reset at P, only bars P+1, P+2, P+3 can qualify. On every later completed bar, first cancel if T=0, then cancel if RSI<35, then expire if k>P+3. Only after those checks may a fresh X50 produce Q=1. The context must therefore hold throughout the active episode, not merely return on the recovery bar.
A qualifying event consumes the episode. Cancellation or expiry also consumes it, with no same-bar rearming. Ignore additional reset crossings while an episode is active; they cannot move P or extend its deadline. A separate later reset can start a new episode. A wider waiting window, a different floor or a rule that waits for context to return would be a different model and needs its own comparison.
7. Rebuild the fictional histories before interpreting the flags
The input download contains 4 independent histories of 82 bars each, for 328 rows. Three share the first 70 closes, starting at 1.10000 and increasing by 0.00005 per bar. The timely, expired and invalid branches then use different declared changes. The fourth history has a constant close. OHLC values, EMA seeds, smoothed gains and losses, RSI, flags and episode origins are included.
Each row records its scheduled UTC completion time, not the broker's bar opening time or a fill timestamp. The first close is 01:55 UTC; the shared reset occurs at 08:00 UTC. Recalculate the indicators from the beginning of each branch, without rounding between updates. These artificial paths verify chronology and arithmetic; their clean structure, frequency of events and shapes say nothing about real-market profitability.
8. Read the timely recovery at the final eligible bar
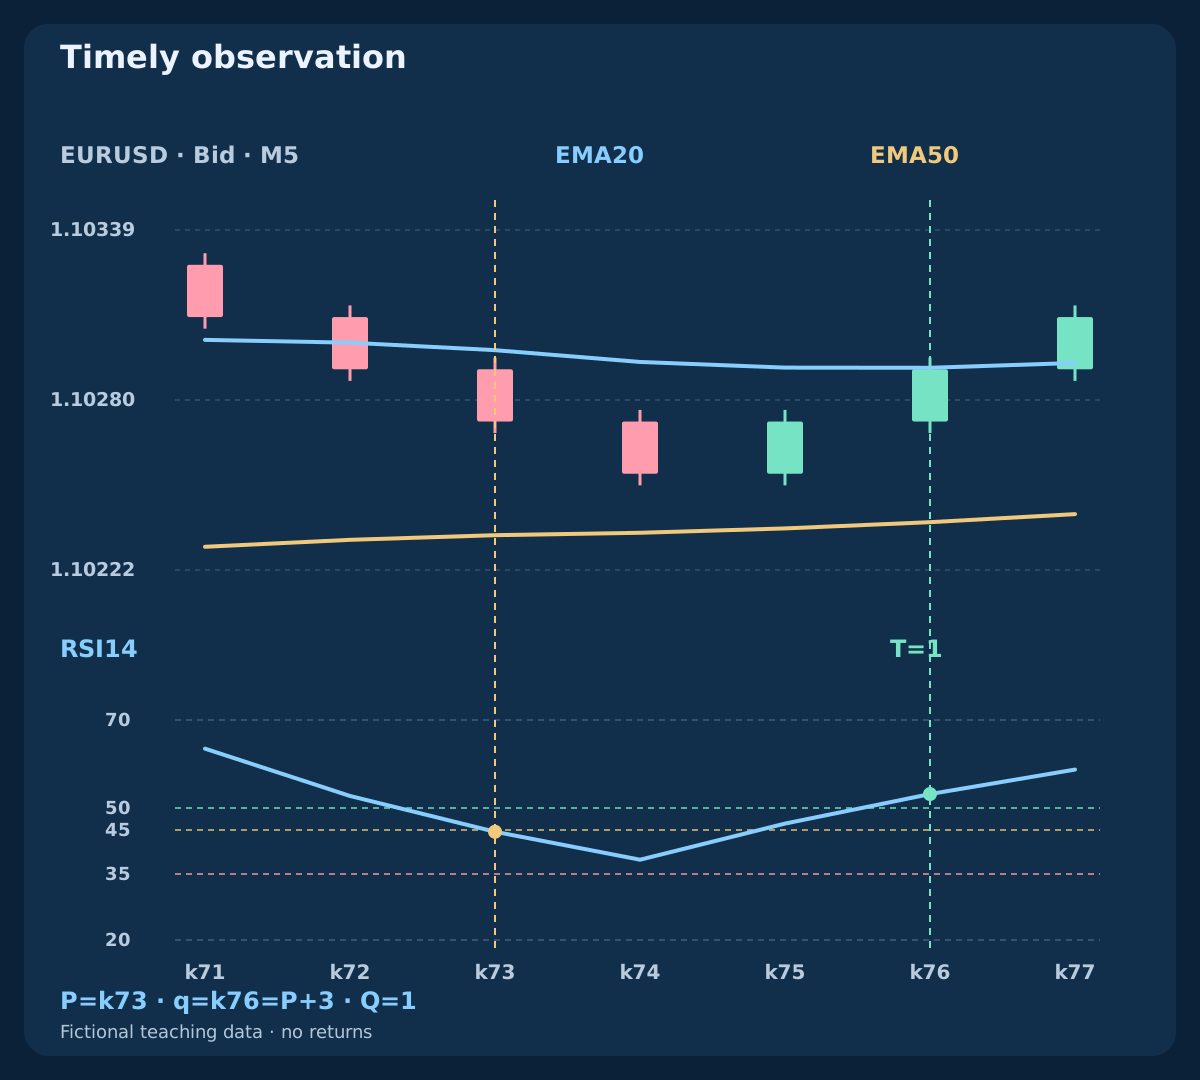
In the timely branch, k73 resets at 08:00 UTC with RSI=44.5994 when displayed to four decimals. T passes. The next bar reaches 38.2459, staying above the floor, then RSI rises to 46.4598 at k75. These bars preserve the episode but have not crossed above the midpoint.
At k76 / 08:15 UTC, RSI reaches 53.1680. This is a fresh X50 at exactly P+3, and T has held throughout, so Q=1. The flag becomes knowable only after that bar is complete and its data arrive. It does not authorize entry at the old close or prove that a subsequent quote satisfies any particular trading plan.
| Branch / bar | Close UTC | RSI14 | T | X50 | Q | Status |
|---|---|---|---|---|---|---|
| timely · k73 | 08:00:00 | 44.5994 | 1 | 0 | 0 | Fresh RSI reset |
| timely · k76 | 08:15:00 | 53.1680 | 1 | 1 | 1 | Timely observation |
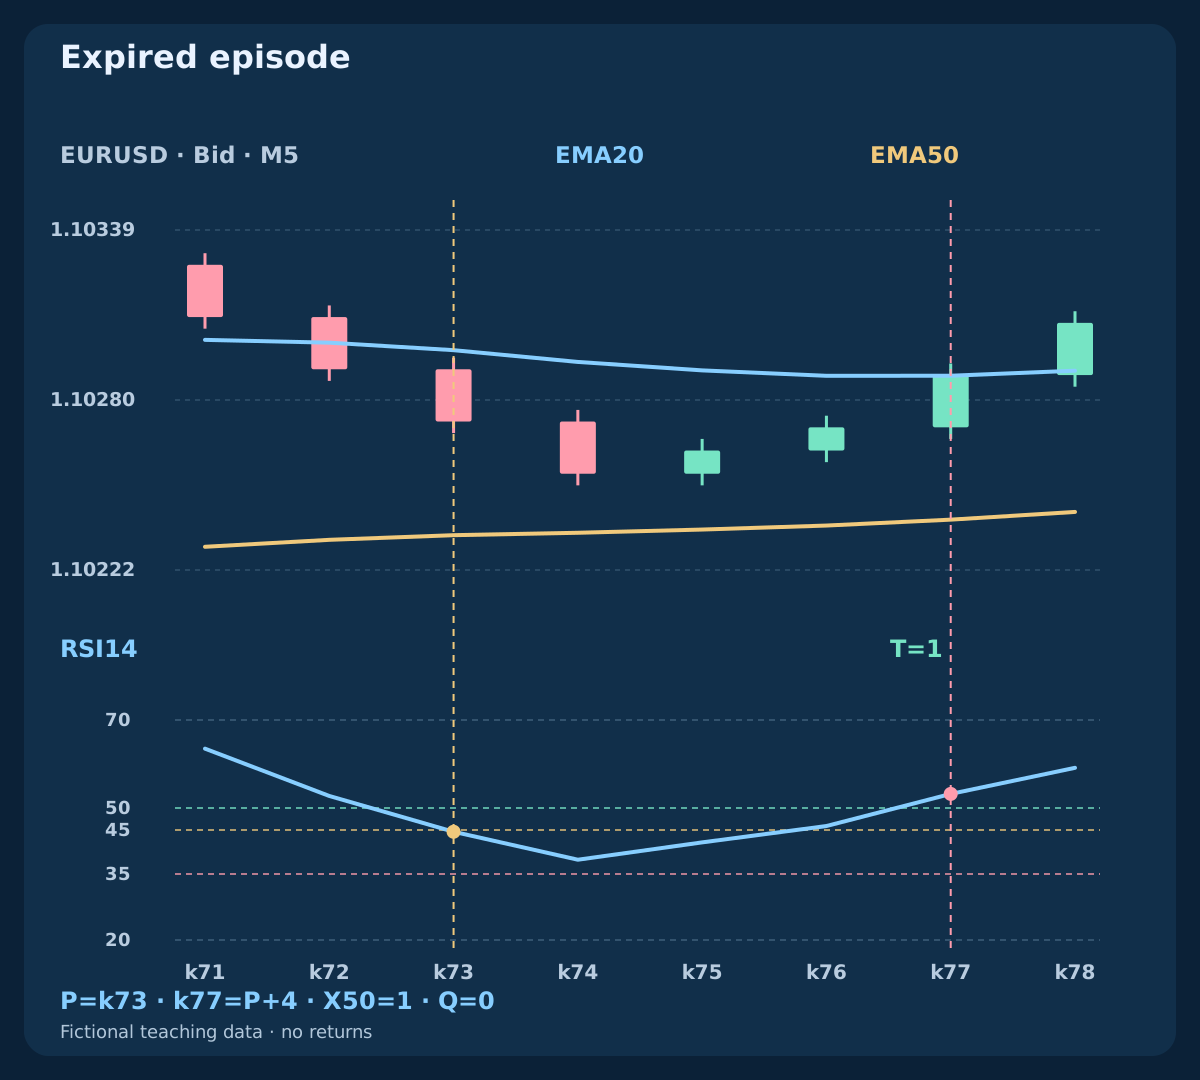
| expired · k76 | 08:15:00 | 45.9063 | 1 | 0 | 0 | Three later completed bars |
| expired · k77 | 08:20:00 | 53.2002 | 1 | 1 | 0 | Expired episode |
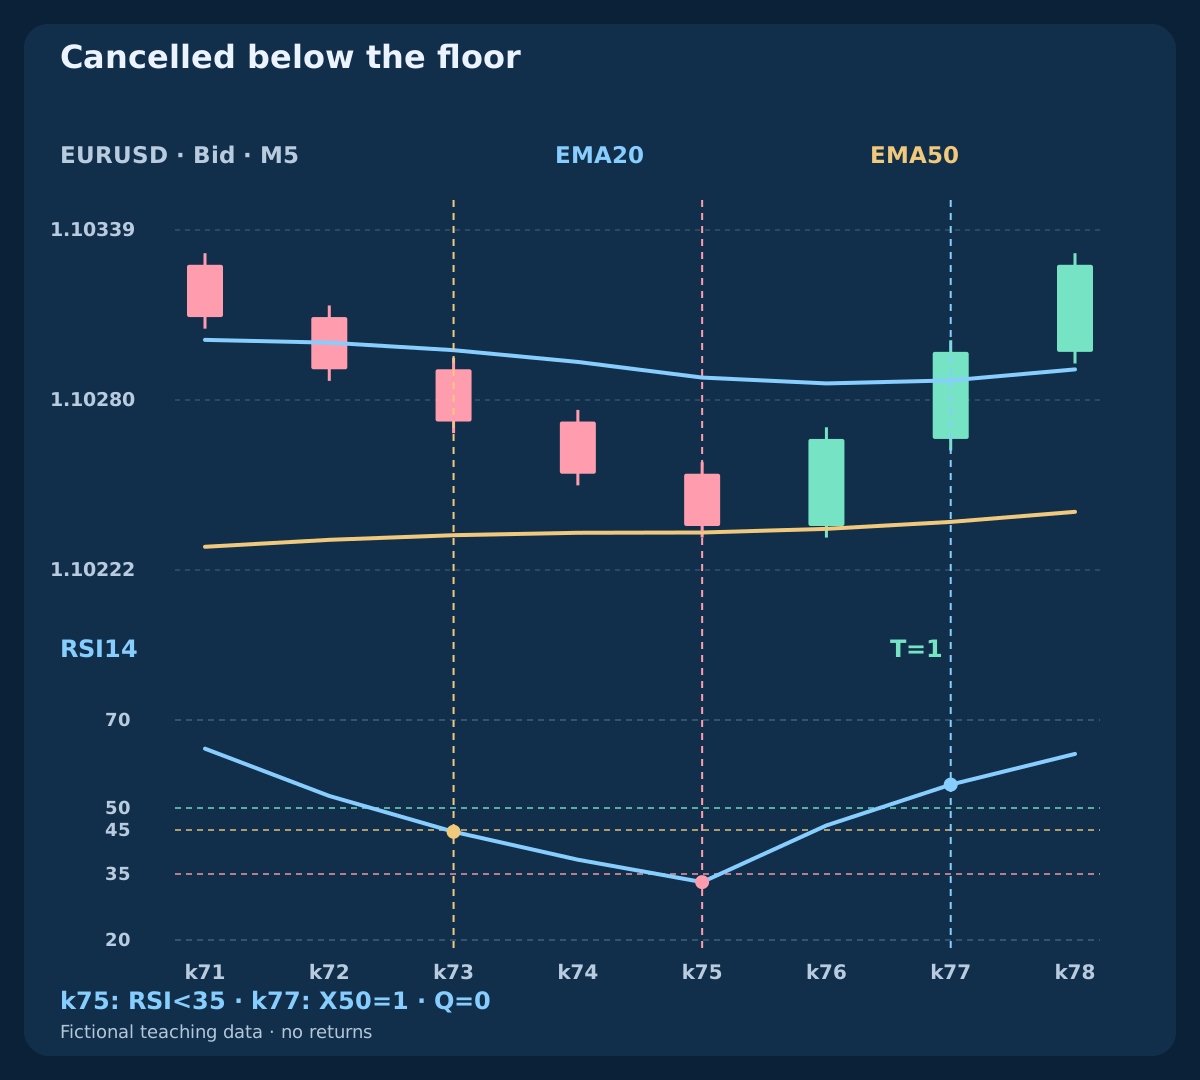
| invalid · k75 | 08:10:00 | 33.1588 | 1 | 0 | 0 | Cancelled below the floor |
| invalid · k77 | 08:20:00 | 55.3151 | 1 | 1 | 0 | Crossing without an active reset |
| flat · k76 | 08:15:00 | 50.0000 | 0 | 0 | 0 | Flat price: no context |
9. Keep the fourth-bar recovery expired
The expired branch starts with the same reset. Its slower recovery stays below the midpoint through k76, the last eligible bar. At k77 / 08:20 UTC, RSI reaches 53.2002 and a fresh X50 appears, while T still passes. The episode has nevertheless exceeded its three-bar window: Q=0.
Expiry is checked before recovery on this bar. Do not redraw P nearer to the crossing, interpret the slow recovery as a fresh reset or extend the window because price later rises. The late crossing remains visible in the event log. If a four-bar window is worth researching, freeze it as another candidate and evaluate it on the same data calendar, including its additional costs and failures.
10. Close an invalid episode before looking at a later rebound
In the invalid branch, the shared reset is followed by another decline. At k75 / 08:10 UTC, RSI is 33.1588, below the declared floor, so the episode is cancelled even though T still passes. At k77, RSI recovers to 55.3151, but there is no active P and Q=0. A rebound does not reopen the cancelled episode.
Loss of the EMA context would also cancel before recovery, under the same stated priority. The constant-price branch shows another limit: after initialization, both EMAs equal price, RSI uses the flat convention, T fails and no reset qualifies. Actual sideways markets are less tidy and can produce repeated valid-looking episodes. A trend filter needs evidence of its contribution after costs, not merely a clean teaching chart.
11. Separate bar opening, completion and the first usable quote
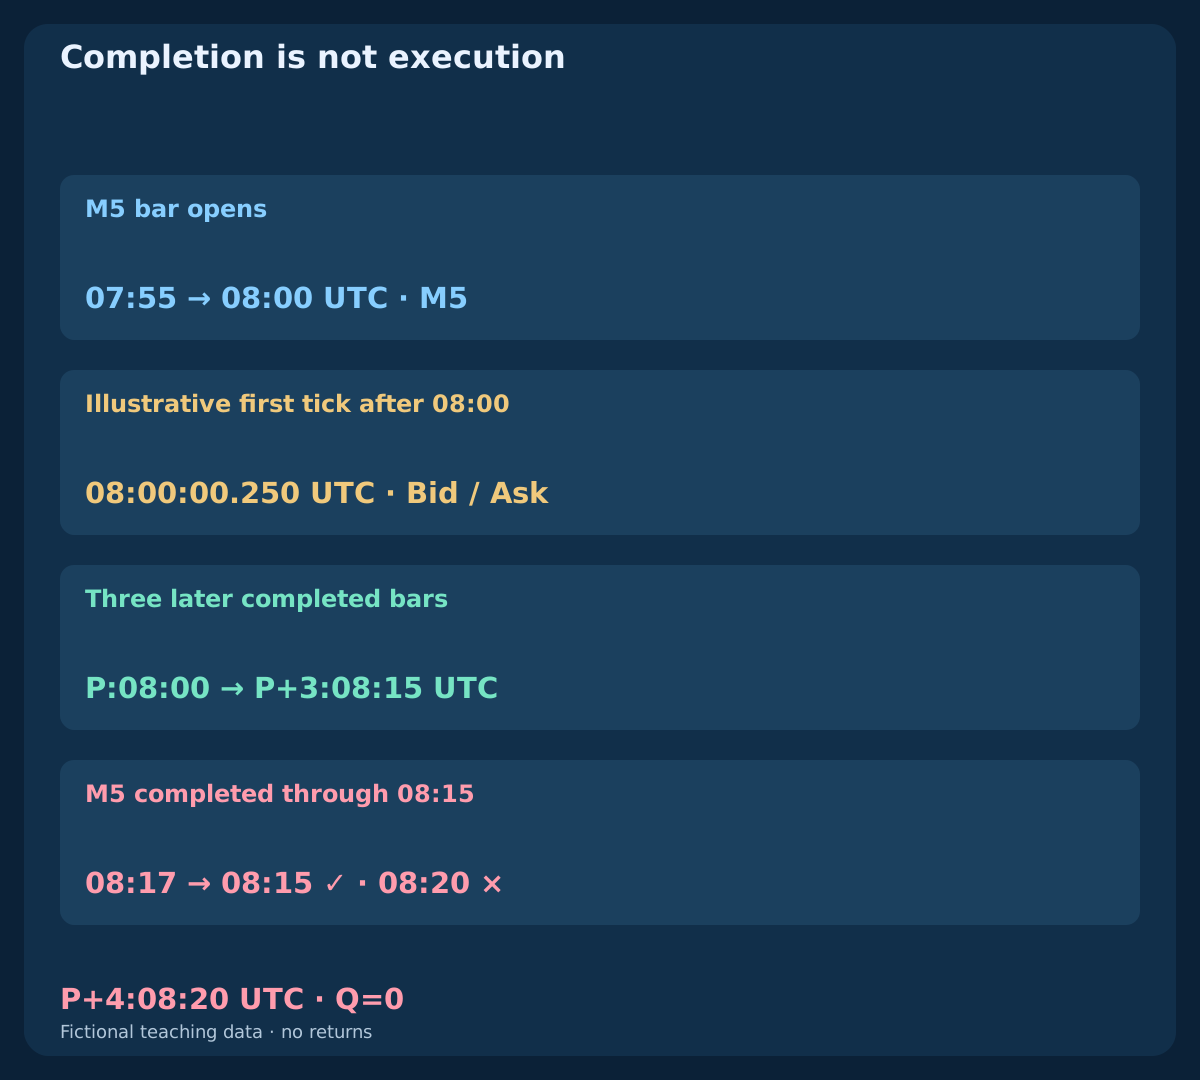
An MT4 bar time identifies its opening. A bar opening at 07:55 UTC covers the interval up to 08:00 UTC on the M5 clock used here. Its final data become observable on the first subsequent tick; an illustrative arrival at 08:00:00.250 UTC is later than the scheduled boundary. Historical timestamps alone do not establish that arrival, a request time or an execution time.
Convert server time to UTC using the actual offset for the date, and retain the conversion rule. At 08:17 UTC, the latest scheduled completed M5 bar ends at 08:15 UTC; the bar ending at 08:20 UTC is still open. A complete execution model must separately limit quote age and request delay. The observation's three-bar recovery window is not permission to keep trying orders for another three bars.
| Time UTC | Available information | Still unavailable |
|---|---|---|
| 07:55 | M5 bar opens | Its final close |
| 08:00:00.250 | Illustrative first tick after 08:00 | Any earlier executable fill |
| 08:17 | M5 completed through 08:15 | M5 close at 08:20 |
12. Treat M1 as another experiment, not a faster copy
With the same period number, M1 and M5 use different price sequences and time spacing. A nominal 20 bars corresponds to 20 minutes on M1 and 100 minutes on M5, but an EMA also retains older decaying information. An RSI calculated from five-minute close changes is not the average of five one-minute RSI readings.
Moving this model to M1 changes resets, crossings and the elapsed duration of its window. More observations can also increase turnover and exposure to costs. Keep this guide's flags on M5; compare any M1 variant with independently frozen rules and the same realistic execution assumptions. A future multi-timeframe model must specify which completed higher-timeframe value is available at every lower-timeframe decision.
13. Compare two executable quotes against the same fixed plan
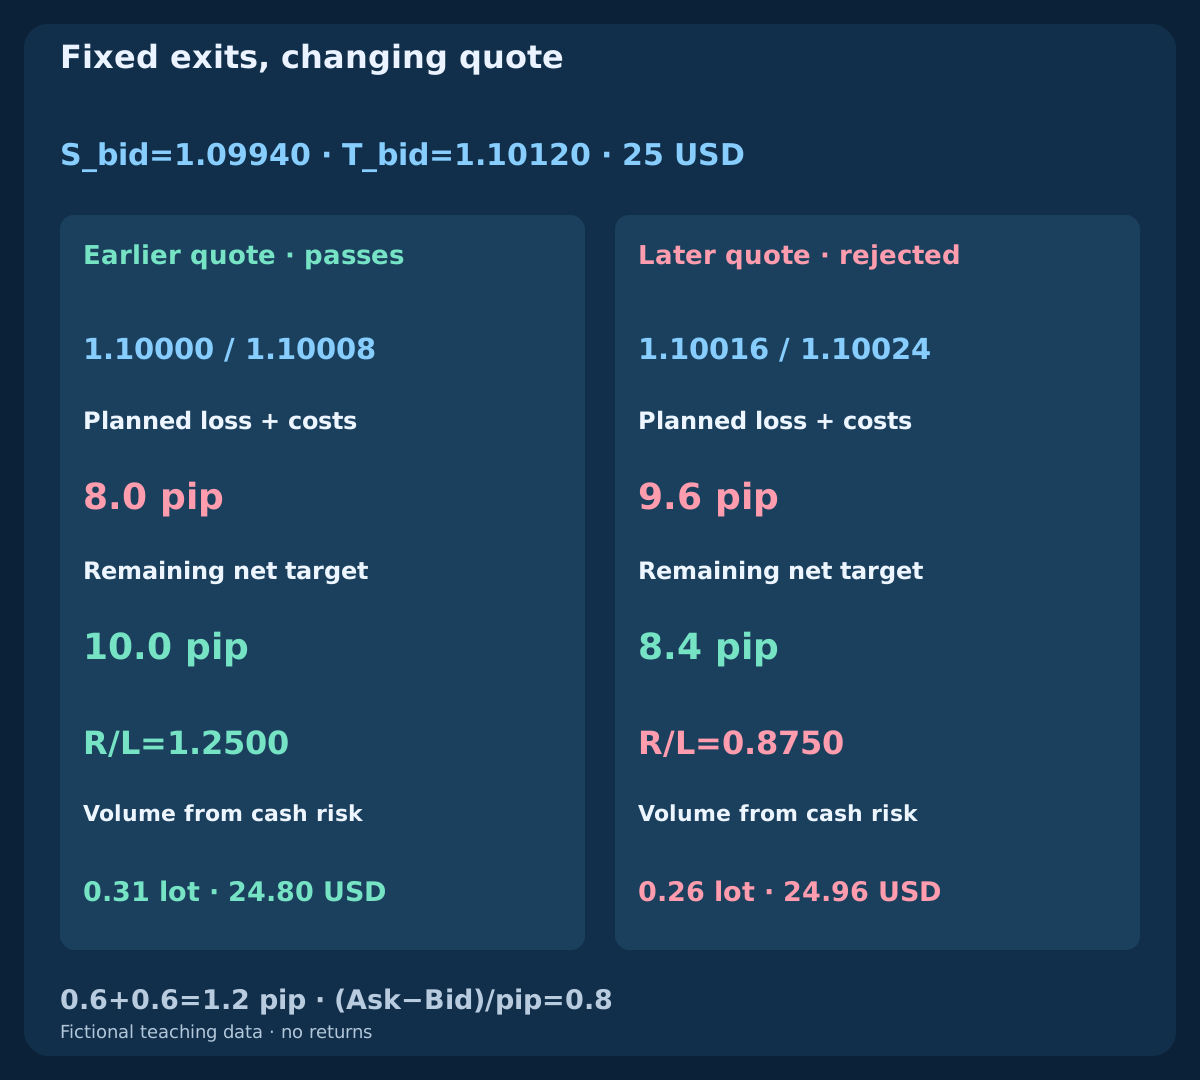
This independent BUY geometry example uses Ask entry, fixed Bid-side stop 1.09940 and target 1.10120. Earlier Bid/Ask is 1.10000 / 1.10008; later it is 1.10016 / 1.10024. Each spread is 0.8 pip. Add round-trip commission 0.6 pip and a total adverse-execution reserve 0.6 pip. Earlier planned loss is 6.8+1.2=8.0 pips, remaining net target 11.2-1.2=10.0 pips and ratio 1.2500. Later these become 9.6 pips, 8.4 pips and 0.8750.
For a declared comparison filter of net reward / planned loss >=1.20, the earlier quote passes and the later quote fails. With equity 10000 USD, budget 0.25%=25 USD, pip value 10 USD per standard lot and volume step 0.01, rounding down gives 0.31 lots and planned risk 24.80 USD earlier. The later arithmetic gives 0.26 lots / 24.96 USD, but a smaller size cannot repair its failed ratio. These are alternative quotes, independent of the histories, not orders or measured fills.
| Quote | Bid / Ask | Stop (pip) | Loss + costs | Net target | Ratio | Lots | Risk USD |
|---|---|---|---|---|---|---|---|
| Earlier quote · passes | 1.10000 / 1.10008 | 6.8 | 8.0 | 10.0 | 1.2500 | 0.31 | 24.80 |
| Later quote · rejected | 1.10016 / 1.10024 | 8.4 | 9.6 | 8.4 | 0.8750 | 0.26 | 24.96 |
14. Keep quote sides, units and actual execution risk explicit
For BUY, calculate loss distance as (Ask-S_bid)/pip before commission and the execution reserve; target room is (T_bid-Ask)/pip. The spread effect is already in those executable distances. For SELL the corresponding distances are (S_ask-Bid)/pip and (Bid-T_ask)/pip. Do not add the displayed spread again. This short-side price explanation does not define a mirrored SELL observation model.
The example assumes a EURUSD pip of 0.0001, point and tick of 0.00001, and a contract of 100000 EUR with a USD account. Real symbol properties, account-currency conversion, minimum lot, margin and broker stop constraints must be checked. Reserves and stops cannot cap actual losses. Gaps, changing quotes, rejected protection or an uncertain request can change the outcome; reconcile actual orders and fills before retrying after a timeout.
15. Test what the reset adds on a common event calendar
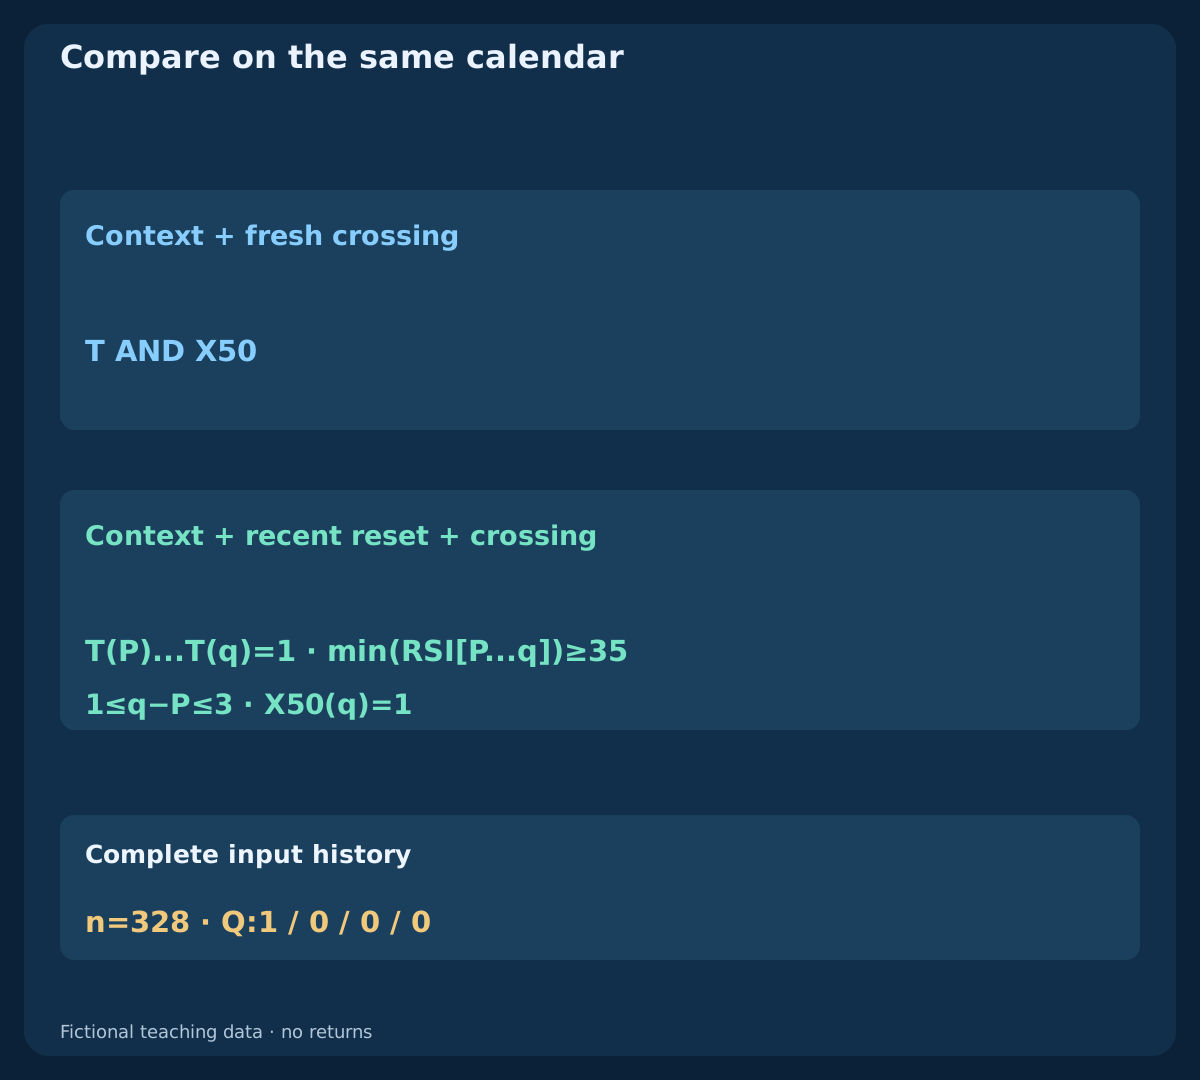
Use T AND X50 as an observation baseline and compare it with the finite-reset Q model. Keep every crossing timestamp, including unarmed, expired and cancelled observations. Once complete trading rules exist, apply the same quote-selection policy, protection, exits, position sizing and cost assumptions to both. Do not move a filtered observation to a later, more convenient price or silently omit rejected requests.
Freeze development choices, reserve untouched later data and record all periods, thresholds and windows tried. Examine net expectancy, drawdown, turnover, uncertainty and sensitivity to spread and adverse execution. Check chronological tick data when stop and target can both occur inside one bar. The downloadable examples test definitions only; neither fewer signals nor a higher selected win rate establishes a dependable edge.
16. Review the specification before turning it into a strategy
Another reader should reproduce the same context, reset and recovery from the same complete history. Record indicator formulas and seeds, symbol and quote side, timeframe, buffer shifts, equality, missing data, cancellation priority, episode lifetime and the exact relationship between the signal clock and the execution clock. Keep input precision separate from rounded display labels.
This first scalping-combination guide provides a foundation for a later, complete EMA-and-RSI strategy. The next guides examine Bollinger Bands with Stochastic and EMA with MACD. Related articles cover the underlying scalping costs, sessions and testing process; the existing M1 EMA pullback studies a different event sequence. Connect the ideas through those references while keeping each research hypothesis identifiable.
Frequently asked questions
Are EMA20/50 and RSI14 the best scalping settings?
They are reference inputs for a declared example. This guide provides no optimization result or measured advantage. Seeds, thresholds, timeframe, execution and costs also affect comparisons; freeze alternatives before testing later data.
Does RSI above 50 mean a new BUY signal?
It is a state. A fresh crossing needs the previous reading at or below 50 and the current reading above 50. This guide also requires an active recent reset and an uninterrupted EMA context before recording Q.
Can a cancelled reset recover when RSI rises later?
The cancelled episode remains closed. A later rebound without a separate new reset is unarmed. The invalid history shows this explicitly; a rule that waits for recovery after cancellation would be a different model.
Is a recovery at exactly the third later bar allowed?
Yes, if context and floor checks pass. P+1, P+2 and P+3 are eligible. At P+4 expiry takes priority even if RSI crosses above 50 on that same completed bar.
Can I use the same rules on M1?
That creates another experiment. Indicator paths, event counts and the elapsed recovery window change. Recalculate from M1 data and test with a separately fixed execution model rather than transferring M5 conclusions.
Does a qualified observation demonstrate a profitable strategy?
No. Q identifies an event under declared conditions. A complete order, protection, exit, cost and risk specification is still needed, followed by testing on suitable market data. The supplied histories and quote comparison are fictional.
Sources and research notes
MetaQuotes documents moving averages, RSI, indicator buffer shifts, bar opening times and executable order prices. The finite initialization, thresholds, event priority, synthetic histories and independent quote comparison here are our declared teaching model. They are not platform defaults, a live-terminal parity claim or evidence of an optimum. Both downloads expose the numbers used in the examples.
- MQL4 Reference: iMA
- MQL4 Reference: iRSI
- MetaTrader 4 Help: Relative Strength Index
- MQL4 Reference: iTime
- MQL4 Reference: OrderSend
Educational content. All histories and quote examples are fictional. Forex trading involves risk. Indicator agreement, planned stops and cost reserves cannot guarantee profitable execution or cap actual losses.