

A completed Donchian breakout and alignment with EMA200 are different conditions. This USD/JPY H1 study compares them on the same fixed daily calendar. In the 2024–2025 replay, Base admits 292 positions and EMA200 retains 217. Both include two unresolved paths, so the costed totals use 290 and 215 resolved trades: −3.66 R and −4.30 R at 2 pips. The filter takes fewer trades, but this sample does not demonstrate a better or safer strategy.
1. Define the breakout and the trend filter separately
The baseline buys a fresh completed Close above a prior-20 Donchian high and sells a fresh Close below its low. EMA200 adds a direction condition on the same completed signal. It cannot change the price path of a retained position. The comparison therefore asks what the filter excludes from a fixed calendar, rather than letting each model search for a different attractive trade.
This is a separate model from the expanded Donchian 20/10 H4 strategy. Here the timeframe is USD/JPY H1, risk is fixed from ATR14, the target is 2R and holding time is limited. There is no shorter-channel exit, moving stop or immediate reversal. An indicator name alone does not identify those execution rules.
2. Keep the signal candle outside its prior-20 reference
At signal S, U is the highest High and L the lowest Low of the previous 20 recorded H1 groups, excluding S. A long requires Close_S > U_S and the previous Close at or below its own prior-20 upper boundary. A short reverses the comparisons at the lower boundary. A boundary-equal Close is not a breakout. Comparing both closes with the same later boundary would change the rule.
These are recorded groups, not necessarily 20 elapsed hours. Empty intervals are not filled, and partial earlier groups remain in the reference history. S and the immediately previous group must each contain 60 consecutive minutes and end exactly one hour apart. A current-inclusive channel cannot confirm a Close outside the same group’s own High/Low range.
U[S] = max(High[S−20 : S−1])
L[S] = min(Low[S−20 : S−1])
LONG: Close[S] > U[S] and Close[S−1] ≤ U[S−1]
SHORT: Close[S] < L[S] and Close[S−1] ≥ L[S−1]
3. State EMA200, ATR14 and the warmup explicitly
EMA200 uses Close. Its initial value is the mean of the first 200 recorded closes; later values use alpha 2/201. The first 1000 recorded H1 groups cannot signal. Earlier history remains in the recursion, including across the year boundary; the visible chart does not restart it. A long EMA lags prices, and warmup reduces seed influence without making it exactly zero.
ATR14 uses Wilder smoothing: True Range is the maximum of High−Low, |High−previous Close| and |Low−previous Close|; the first group uses High−Low. The first 14 TR values form the seed, followed by weight 1/14. The source quotes have two decimals. Six displayed decimals for EMA reproduce a calculated reference and add no precision to the observations.
EMA200[S] = (2 × Close[S] + 199 × EMA200[S−1]) / 201
LONG filter: Close[S] > EMA200[S]
SHORT filter: Close[S] < EMA200[S]
Risk_pips = ceil(1.5 × ATR14[S] / 0.01)
Target = Entry + direction × 2 × Risk_pips × 0.01
4. Reserve each date for its first eligible signal
Inspect completed H1 endpoints from 06:00 through 14:00 UTC inclusive, Monday to Friday. Only the first qualifying fresh breakout in either direction reserves the date. It remains consumed for both models after an entry cancellation or EMA rejection. The window is a fixed research convention, not an assertion about a local session opening.
There are 292 such first events in these inputs, and all 292 obtain a baseline entry. No price-entry cancellation occurs in this sample, although the frozen protocol still defines late quotes and invalid risk. EMA200 keeps 217 and rejects 75. A rejected event is not replaced by another breakout later that date.
5. Use the completed signal Close for the EMA gate
A baseline long is retained only when Close_S > EMA200_S; a baseline short only when Close_S < EMA200_S. Equality rejects. This is not an EMA crossover, a slope test or a demand for another confirmation candle. The comparison uses the unrounded calculation at the completed signal, not a rounded display or the later entry quote.
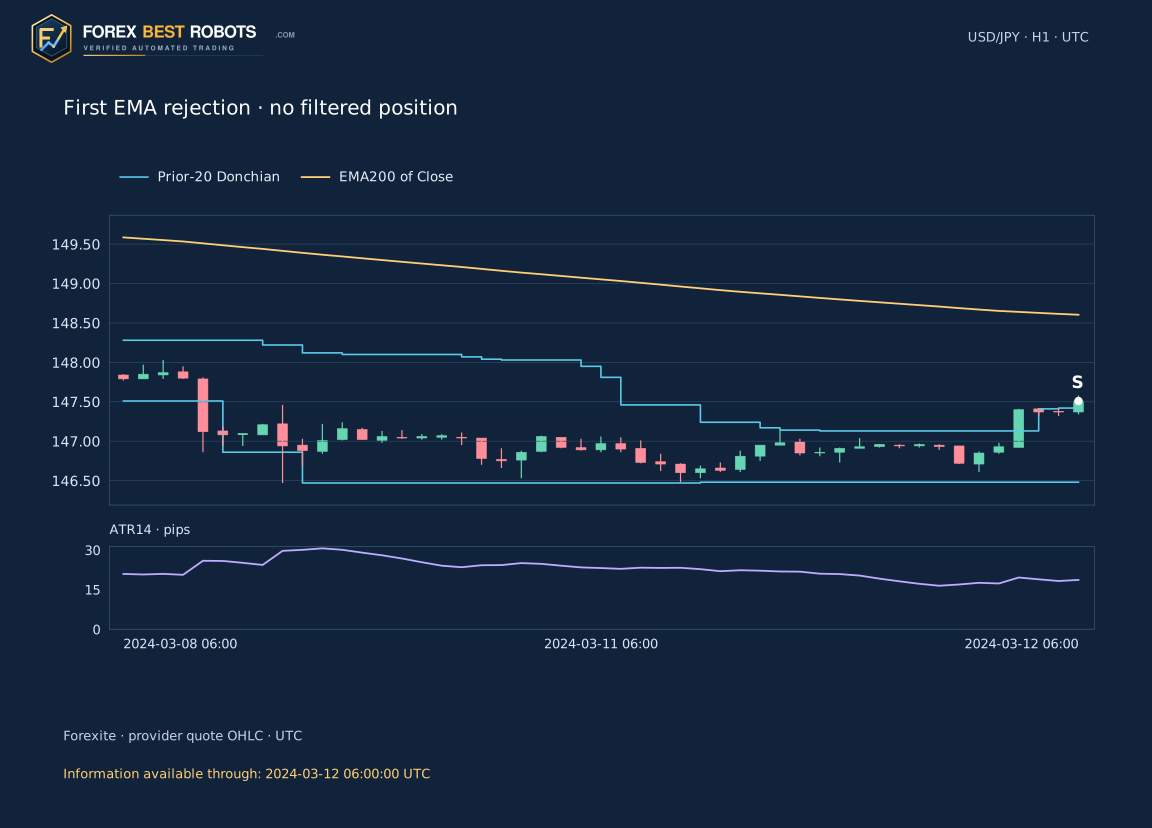
The first rejection is event 7 on 12 March 2024. At 06:00 UTC, Close 147.51 is above the prior upper boundary 147.42 but below EMA200 148.604008. Base can enter; the EMA model cannot. Its decision chart stops at S and contains no filtered position, stop, target or hypothetical result. Select Base explicitly to inspect that separate admitted path.
6. Use the next opening quote and round risk upward
After S, use the first recorded M1 Open whose interval starts at or after S ends. Cancel if it arrives more than five minutes later or reaches 20:00 UTC. There is no position before that actual opening quote. Source OHLC is a research price proxy; it does not establish executable Bid/Ask, observed spread or guaranteed broker fills.
Freeze initial risk at ceil(1.5 × ATR14_S / one pip) whole pips. One USD/JPY pip is 0.01 JPY per USD. Place the stop one risk distance against the entry and the target two distances in its favour. Both stay fixed. There is no net-target-room screen in this model. Scenario costs do not reselect signals or alter the initial R unit.
7. Give opening events and missing minutes a defined priority
Use the earlier of entry plus six elapsed hours and 20:00 UTC that date as the holding deadline. A missing minute while exposed makes the path unresolved before an apparent next opening fill. Otherwise, inspect stop at/beyond Open, target at/beyond Open, and time exit at Open, in that order. A gap can produce a result beyond the frozen level; an Open exactly equal to the stop is not evidence of a worse-price gap.
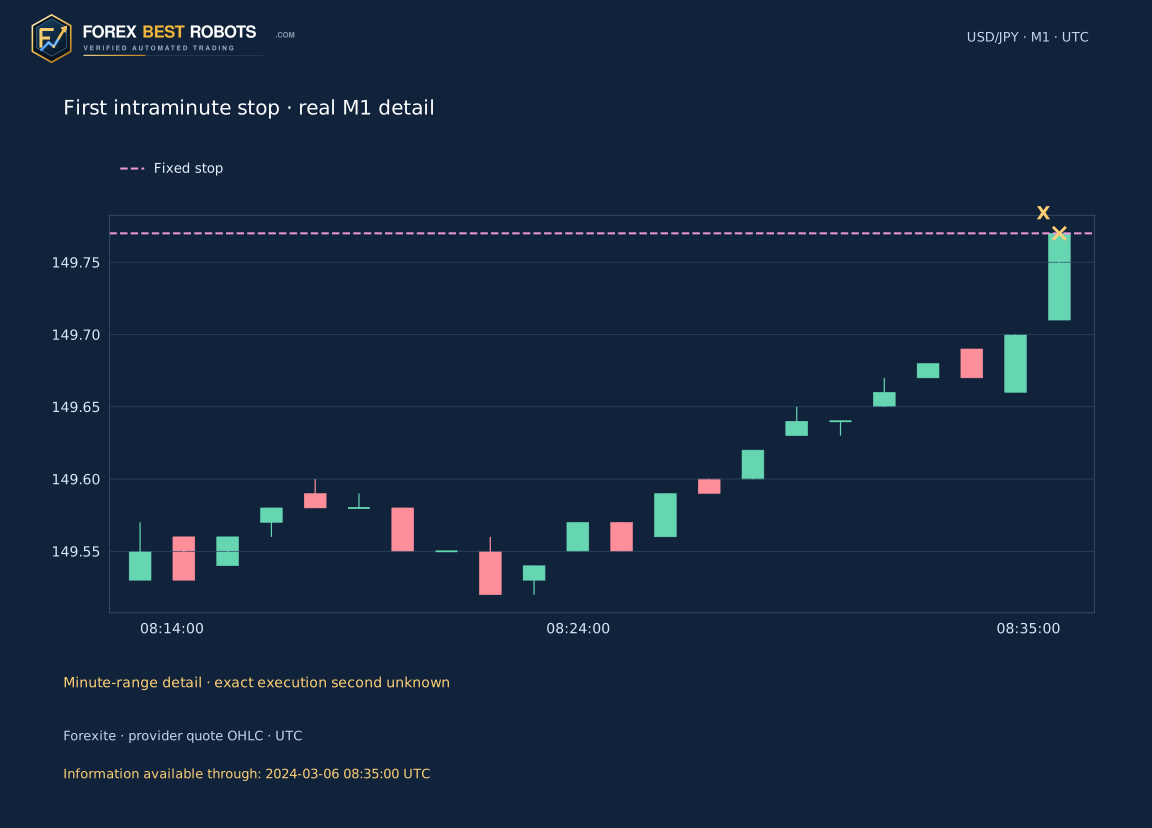
If no opening event closes the position, inspect that minute’s High/Low. One touched level uses that frozen level; both levels in one minute leave the order unresolved. A range hit is shown as its minute interval, not an invented execution second. This method does not simulate position sizing, leverage, pyramiding or a stop that follows EMA200.
8. Follow the first baseline and EMA-retained position
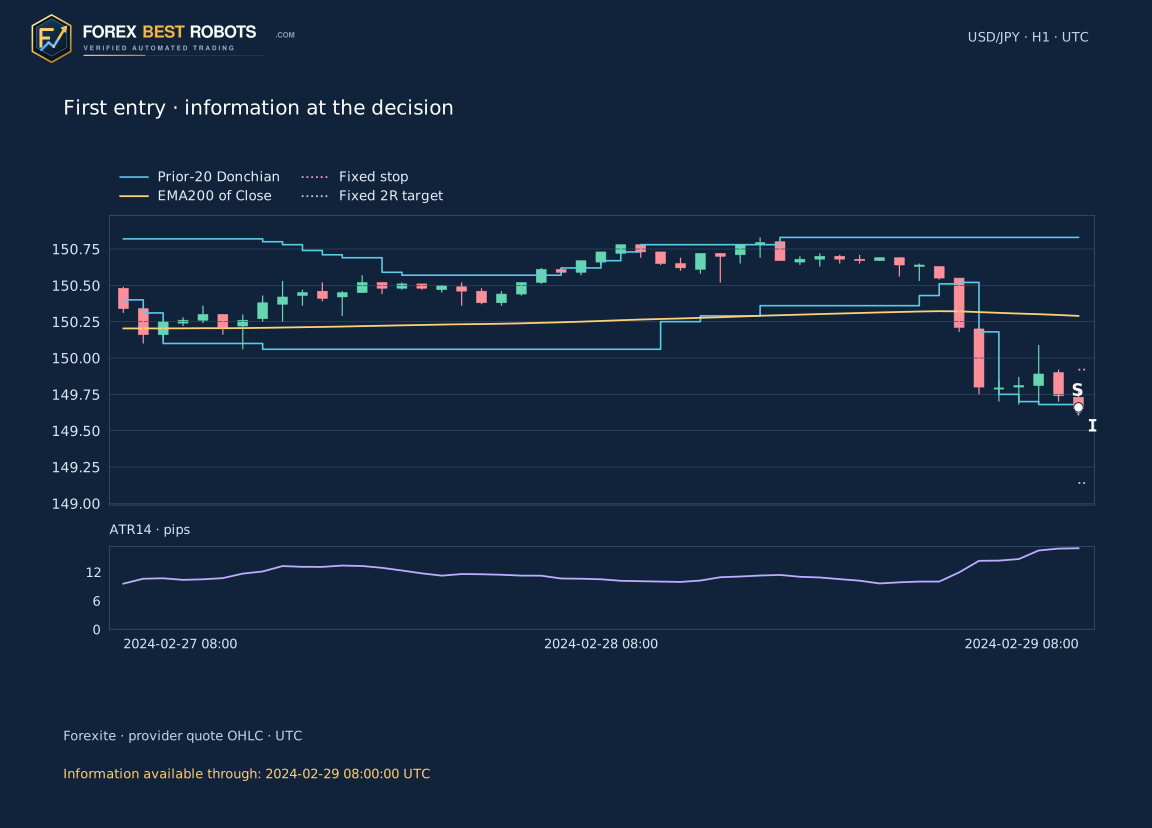
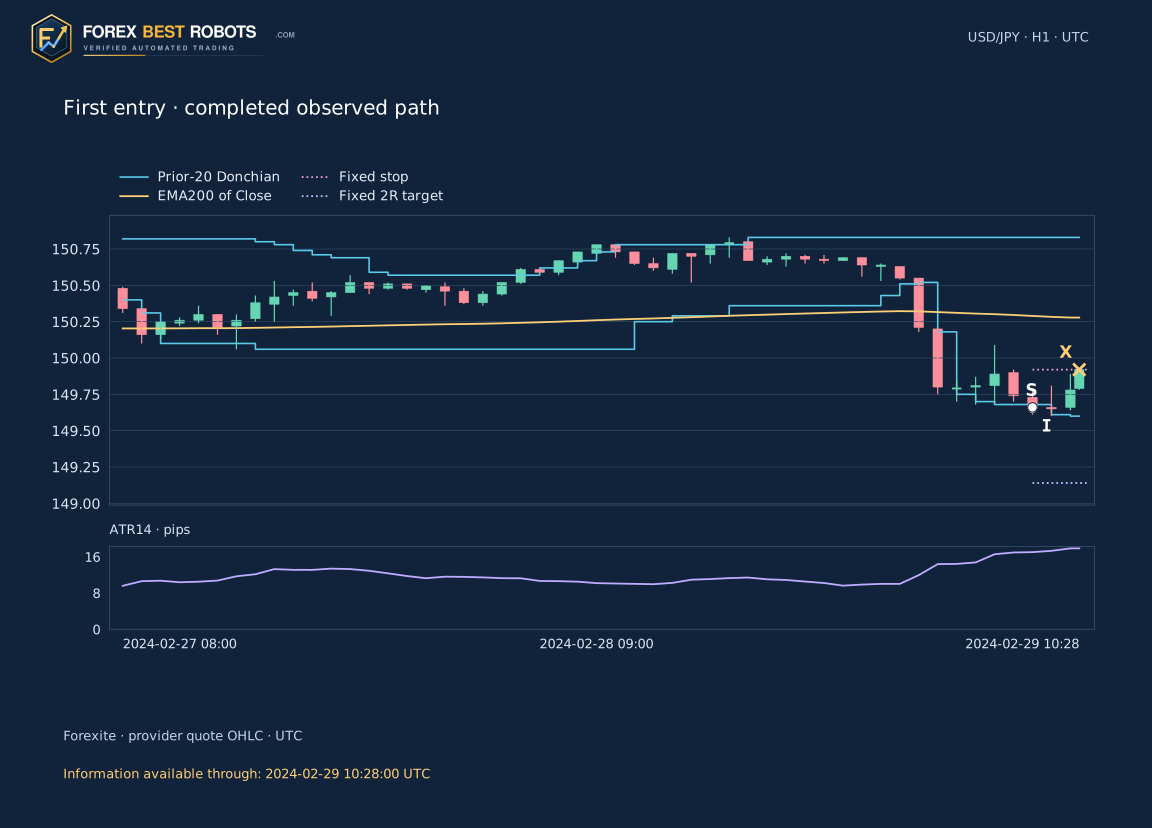
Event 1 is a short on 29 February 2024. S ends at 08:00 UTC with Close 149.65 below the prior lower boundary 149.68 and below EMA200 150.289560. The next observed Open is 149.66, not S’s Close. ATR14 is 17.0149 pips: 1.5 times that rounds upward to 26 pips. Entry 149.66 gives stop 149.92 and fixed 2R target 149.14. Both models admit this same position.
The recorded 10:28 UTC opening quote equals the stop. Gross result is −26 pips; with a 2-pip allowance, net R is (−26−2)/26 = −1.0769. The decision image stops at 08:00, and the separate completed image at 10:28. S/I/X mean signal, observed entry, and exit or end of an unresolved observed path. The M1 detail is a different first-occurrence case: position 4 on 6 March.
9. Keep the two unknown paths visible in the counts
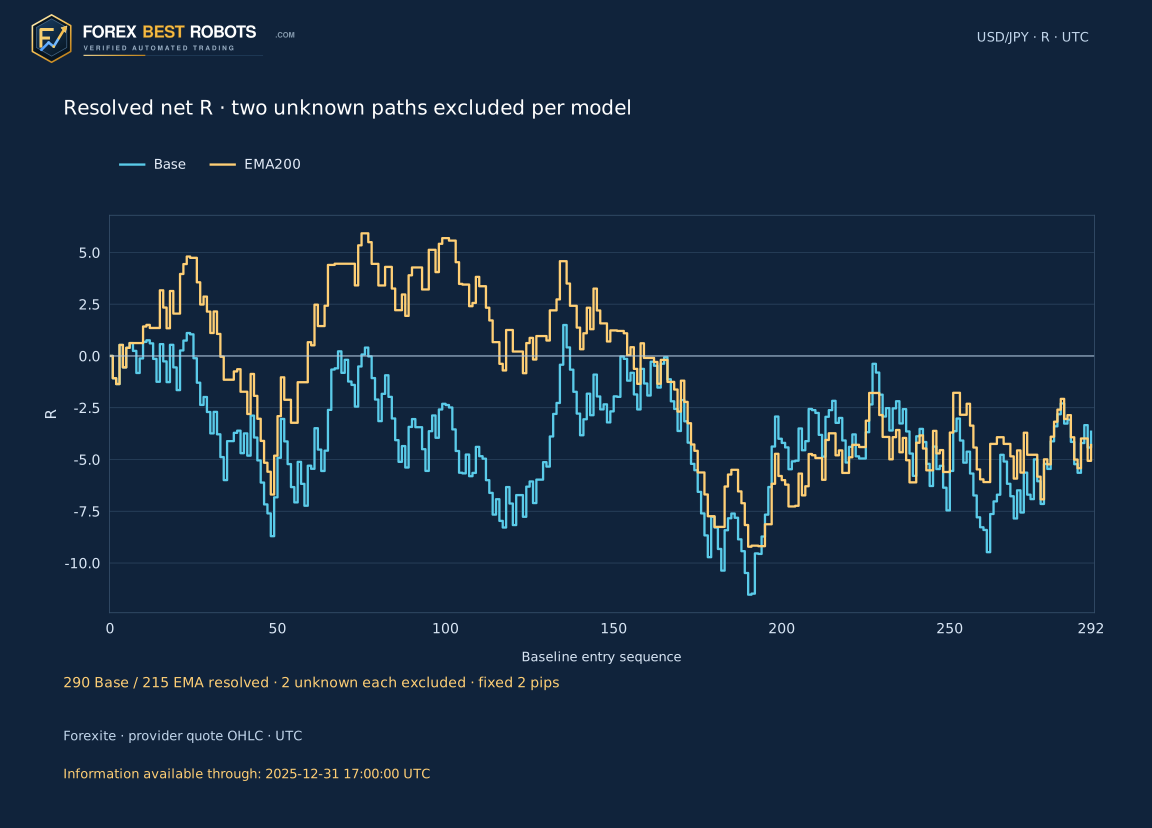
Baseline positions 122 and 128 encounter unobserved minutes on 5 and 16 December 2024. Both pass EMA200. They remain in entered counts, but receive no invented gross or net result. Base therefore has 292 entries and 290 resolved paths; EMA200 has 217 entries and 215 resolved paths. The explorer’s completed view identifies the unknown reason instead of presenting a fill.
Returns, profit factor and closed-position R drawdown use resolved paths only. The cumulative lines omit both unknown outcomes and are explicitly incomplete. Omitting them does not establish their possible loss or the account’s risk. Their absence can affect a performance interpretation even though each model has the same two affected entries.
10. Read the annual split before interpreting the filter
At 2 pips total cost, Base’s 133 resolved 2024 positions sum to +1.49 R and its 157 resolved 2025 positions to −5.15 R, giving −3.66 R combined. EMA200 has 94 and 121 resolved positions, returning +4.58 R and −8.88 R, or −4.30 R combined. The two unresolved entries are additional 2024 counts in each model; do not silently turn them into zero-return trades.
The filtered sample is smaller, while its combined resolved-only drawdown is 15.13 R against Base’s 13.02 R. This does not demonstrate a better or safer strategy. The 2025 calculation keeps the frozen rules but is not unseen-data or live forward validation. The same retained quote input was used for the preceding Envelopes study; reusing it is not independent market confirmation.
Resolved positions only. Both models have two unknown 2024 paths, excluded from results and drawdown. This is not full account equity.
Assumed total cost per completed trade · pips: 2.0 pip.
| Period | Model | Entered | Resolved | Unresolved | Net R | Profit factor | Closed-trade drawdown · R |
|---|---|---|---|---|---|---|---|
| 2024 | Base | 135 | 133 | 2 | +1.49 | 1.02 | 9.81 |
| 2024 | EMA200 | 96 | 94 | 2 | +4.58 | 1.10 | 11.49 |
| 2025 | Base | 157 | 157 | 0 | -5.15 | 0.93 | 13.02 |
| 2025 | EMA200 | 121 | 121 | 0 | -8.88 | 0.85 | 13.79 |
| 2024 + 2025 | Base | 292 | 290 | 2 | -3.66 | 0.97 | 13.02 |
| 2024 + 2025 | EMA200 | 217 | 215 | 2 | -4.30 | 0.96 | 15.13 |
11. Change the total cost scenario without moving the trade
The control spans 0–8 pips in 0.5 steps; static comparisons use 0/1/2/3/5 and the default is 2. Net pips = gross pips − scenario cost, and net R = net pips / frozen initial risk pips. These are assumed total round-trip costs, not measured spread, commission, slippage or financing. Unknown paths remain unknown at every setting.
Before this deduction, resolved totals are +14.78 R for Base and +9.53 R for EMA200; at 2 pips they are −3.66 R and −4.30 R. This illustrates cost sensitivity, not a profitable validation. The control updates net output and tables, without changing calendar, EMA admission, quotes, stop, target or SVG price chart. R sums are not money, compounded returns or account equity; closed-R drawdown omits intratrade changes.
| Assumed total cost per completed trade · pips | Model | Net R | Profit factor | Closed-trade drawdown · R |
|---|---|---|---|---|
| 0 | Base | +14.78 | 1.11 | 10.34 |
| 0 | EMA200 | +9.53 | 1.10 | 11.78 |
| 1 | Base | +5.56 | 1.04 | 11.68 |
| 1 | EMA200 | +2.61 | 1.03 | 13.25 |
| 2 | Base | -3.66 | 0.97 | 13.02 |
| 2 | EMA200 | -4.30 | 0.96 | 15.13 |
| 3 | Base | -12.87 | 0.91 | 17.95 |
| 3 | EMA200 | -11.21 | 0.90 | 17.46 |
| 5 | Base | -31.31 | 0.80 | 33.82 |
| 5 | EMA200 | -25.04 | 0.78 | 28.30 |
12. Inspect the decision before unfolding the later path
Choose one of the 292 first events, Base or EMA200, and At decision or Complete path. Shortcuts select the named first case and its model, starting at the decision. Later candles, exit and realized result remain hidden in that mode, including the numerical formula. An EMA rejection ends at S with no admitted position and disables Complete path.
The completed path uses only source minutes through its displayed information cutoff; the last H1 can be partial or an opening point alone. A gap-ended path shows an observed market cutoff rather than a fabricated execution price. Net R is beside the cost control. Read the reason and cutoff together, then use the self-contained inputs and fixed protocol for a separate demo investigation. This replay does not validate deployment with real funds.
The interactive example could not load. Use the static charts and downloadable observations.
Choose the inclusion model
Change the cost allowance
2.0 pip
Net result · R—
Scenario changes net results only. The signal calendar, EMA decision and levels stay fixed.
- Completed signal S · UTC
- —
- Signal Close
- —
- Prior-20 upper boundary at S
- —
- Prior-20 lower boundary at S
- —
- EMA200 at S · calculated price
- —
- Signal Close minus EMA200 · pips
- —
- ATR14 at S · pips
- —
- Selected model decision
- —
- Information available through · UTC
- —
- Entry quote · UTC
- —
- Frozen stop
- —
- Frozen 2R target
- —
- Initial risk · pips
- —
- Gross target distance · R
- —
- This allowance · R
- —
- Exit quote / interval · UTC
- —
- Exit reason
- —
- Gross result · R
- —
On narrow screens, scroll the chart or formula within its block, or open a static chart at full size.
Show the numerical result
Show all first daily breakout events
| # | Completed signal S · UTC | Direction | Signal Close | EMA200 at S · calculated price | EMA200 inclusion |
|---|
Frequently asked questions
Does the selected candle belong to the Donchian breakout window?
No. The signal compares its completed Close with the previous 20 recorded groups. The previous Close is compared with its own earlier prior-20 boundary.
Does EMA200 require an upward slope or a crossover?
No. This frozen filter uses only completed Close above EMA200 for a long or below it for a short. Equality rejects; no later candle can replace the first rejected daily event.
Is the risk exactly 1.5 ATR with fractional pips?
No. The distance is rounded upward to a whole USD/JPY pip before the stop and 2R target are frozen. One pip is 0.01 JPY per USD.
Do the two unknown paths count as breakeven trades?
No. They count as entries, but their returns are unassigned and excluded from performance metrics. The two cumulative curves are therefore incomplete, not full account equity.
Does changing costs rerun the entry calendar?
No. It changes only the assumed cost deduction on the same positions. EMA decisions, price paths and protective levels remain fixed; unknown paths receive no invented result.
Did EMA200 improve or validate the strategy in this sample?
It reduced 292 entries to 217, but the combined resolved-only result at 2 pips was more negative and drawdown higher. That does not establish a superior or safer system, nor a forecast of future returns.
Data, calculation method and scope
The retained, previously verified input comes from 733 original Forexite daily archives and contains 751488 USD/JPY M1 observations. It produces 12530 UTC H1 groups, of which 12372 contain all 60 minutes. CET/CEST is already converted to UTC; minute-end interpretation is a declared assumption. Gaps are not filled and partial groups remain in recorded history. These are two-decimal provider quotes, not documented Bid/Ask or broker executions.
The protocol and input hash were durably saved before the first replay. An independent SQLite and 48-digit Decimal implementation confirmed the hourly groups, EMA/ATR histories, 292 event decisions and all 292 paths in 198094 field comparisons within declared numerical tolerances. The self-contained ZIP includes every minute input, original-source hashes, frozen rules, standalone replay, expected results and both CSV ledgers; no extra raw downloads are needed. Agreement verifies this calculation on these inputs, not a trading edge.
- Download all 292 first daily breakout events (CSV)
- Download 292 baseline positions, EMA flags and unknown paths (CSV)
- Download minute inputs, frozen protocol and standalone replay (ZIP)