

A channel breakout can suggest a direction; it does not decide whether the first pullback offers an entry. Follow a fixed EUR/USD H1 sequence from expansion through pullback and confirmation, then compare the same opportunities with an ADX filter. The 2024–2025 replay contains only 8 baseline trades and 5 filtered trades from 175 first daily expansions. That small sample cannot establish an edge, and both two-year totals are negative after the stated 2-pip allowance.
1. Define a trend continuation sequence before reading the result
The model follows the direction of an outside close, waits for a first return to a frozen channel middle, and requires a new completed candle to confirm continuation. It buys after an upward expansion and sells after a downward expansion. This differs from fading a failed excursion back toward the middle: the intended direction remains the original expansion direction.
Two variants share that price logic. Base accepts every qualifying entry; ADX25 keeps only those whose completed confirmation has ADX(14) at least 25. The filter is not a promise of a better trade. It changes which positions are admitted, not which price observations existed.
2. Keep the 20/20/2 calculation and UTC clock explicit
The middle is a 20-recorded-group EMA of Close; the offset is twice a 20-group Wilder ATR. EMA and ATR start from the stated 20-value arithmetic means. This 20/20/2 choice is fixed for this study. Other Keltner implementations can use ATR(10), other smoothing or other inputs, so matching the indicator name alone does not reproduce this chart. ADX uses 14-period Wilder smoothing and a 200-recorded-H1 warmup.
Source CET/CEST timestamps are converted to UTC. Treating each source M1 label as a minute end is an explicit research assumption. An H1 labelled 10:00 covers (09:00, 10:00]; its final values become available at 10:00. Empty minutes are not filled. Partial recorded groups stay in indicator history, but expansion, inspected pullback and confirmation groups must each contain all 60 consecutive minutes. Source prices have four decimals; displaying six does not add precision.
M[t] = EMA20(Close)[t]
U[t] = M[t] + 2 × WilderATR20[t]
L[t] = M[t] − 2 × WilderATR20[t]
ADX(14)[C] ≥ 25
3. Reserve each date for its first eligible expansion
Inspect completed H1 endpoints 06:00 through 12:00 UTC, Monday through Friday. A fresh upward expansion requires Close above that completed bar’s upper Keltner line, while the previous Close was at or below its own upper line. A downward expansion reverses those comparisons. Equality is not an outside close. The expansion and previous group must both be complete and one hour apart.
Take only the first qualifying expansion in that window, in either direction. That date is used immediately for both variants, even if the setup later expires or fails. The fixed UTC window is a research convention, not a claim about London’s local opening time. No later expansion can replace the first event because its eventual outcome looks better.
4. Freeze the middle and consume the first touch
At the expansion close, freeze its middle M and outer boundaries U and L. Examine only the next six consecutive, complete H1 groups. For a long setup, the first Low at or below M is the pullback P; it qualifies only if Low stays strictly above L and Close is strictly above M. For a short setup, the first High at or above M qualifies only if High stays strictly below U and Close is strictly below M.
An invalid first touch cancels the setup. It cannot be ignored in favour of a cleaner second touch. No touch within six hours means expiry; a missing or incomplete inspected group means a data-quality cancellation. The frozen assessment line does not move toward a later candle, even though a separately drawn rolling Keltner channel continues to update.
5. Give only the next completed candle a chance
The one H1 immediately after P is confirmation C. A long requires its Close strictly above P’s High and above the frozen middle; a short requires Close strictly below P’s Low and below that middle. C must be complete and at the next hourly endpoint. A failed C ends the candidate: another later candle gets no second chance.
After confirmation, use the first recorded M1 opening quote whose interval starts at or after C’s endpoint. Cancel if that quote is more than five minutes late or at/after 20:00 UTC. The quote is a reproducible research entry proxy. The source does not establish broker Bid/Ask sides, actual spreads, slippage or guaranteed executions.
6. Apply ADX25 to the same completed confirmation
ADX measures trend strength without supplying a bullish or bearish sign. Direction here comes from the expansion sequence. Evaluate the unrounded ADX(14) at C: a value at least 25 admits the baseline position to ADX25; a lower value rejects it. No DI crossover, rising-ADX condition or later threshold crossing is added.
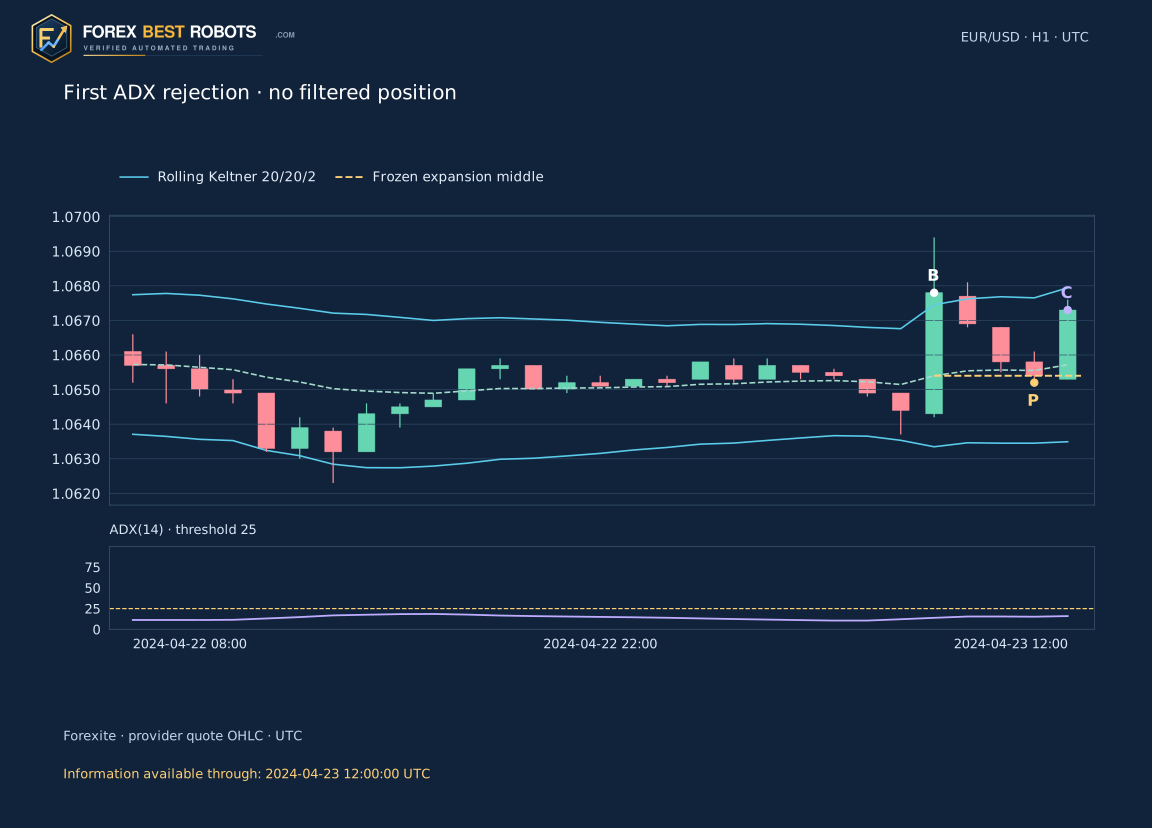
The filtered variant is a strict subset of the baseline calendar. For every retained position, entry time, quote, stop, target and exit path are the same. Rejection creates no later opportunity on that date. Setup 22 on 23 April 2024 demonstrates an ADX rejection: the confirmation reading is 15.9481, below 25. At that decision, the filtered variant has no position and no realized result.
7. Freeze risk, target and the last possible holding time
Initial risk is 1.5 × ATR(20) at C, rounded upward to a whole EUR/USD pip. One pip is 0.0001 USD per EUR. Freeze the stop one risk distance from entry and the target two risk distances in the expansion direction. No position sizing, pyramiding or moving stop is simulated. Close at the first recorded minute open at the earlier of entry plus eight elapsed hours and 20:00 UTC that date.
While open, a missing minute interval makes the path unresolved. Otherwise test stop at/beyond the minute open, then target at/beyond the open, then the scheduled close. If no opening event ends the trade, inspect that minute’s High/Low: one touched level uses that level; both touched levels make ordering unresolved. Range touches are shown as minute intervals. A stop exactly at a recorded open is not evidence of an adverse-price gap.
8. Follow the first entered setup without borrowing later candles
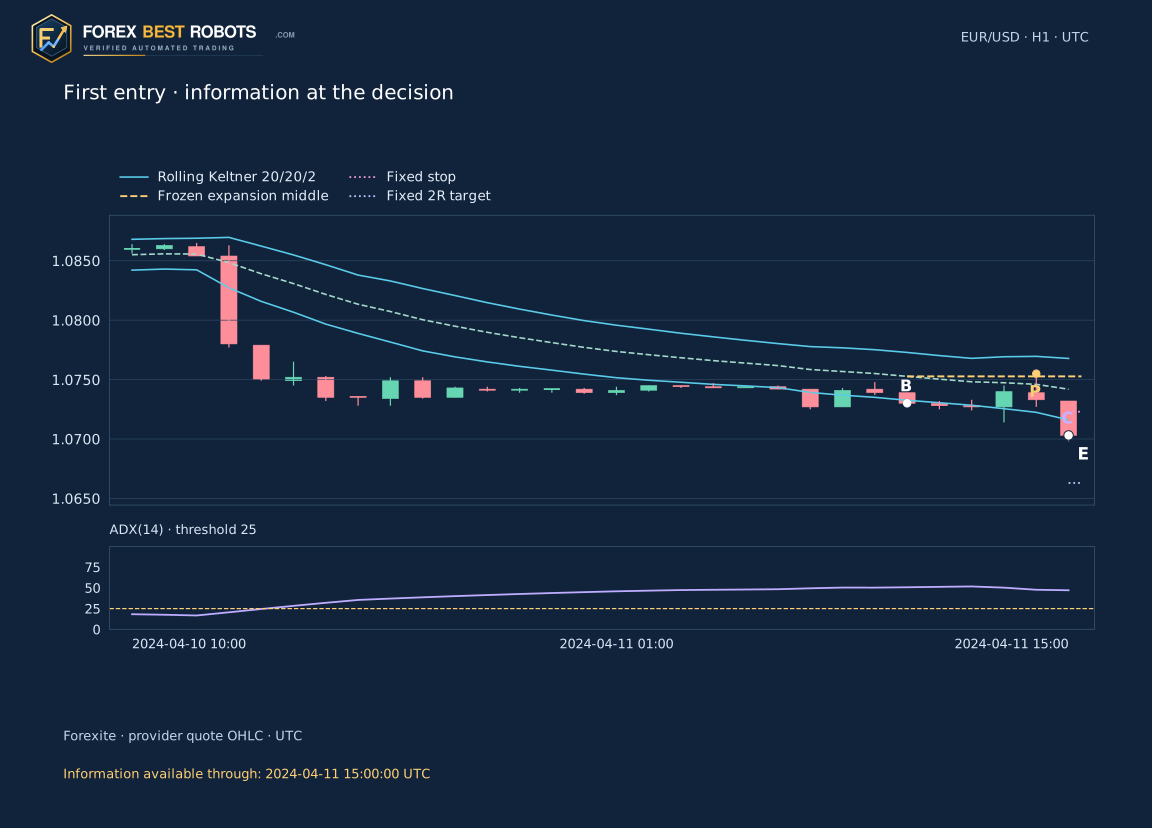
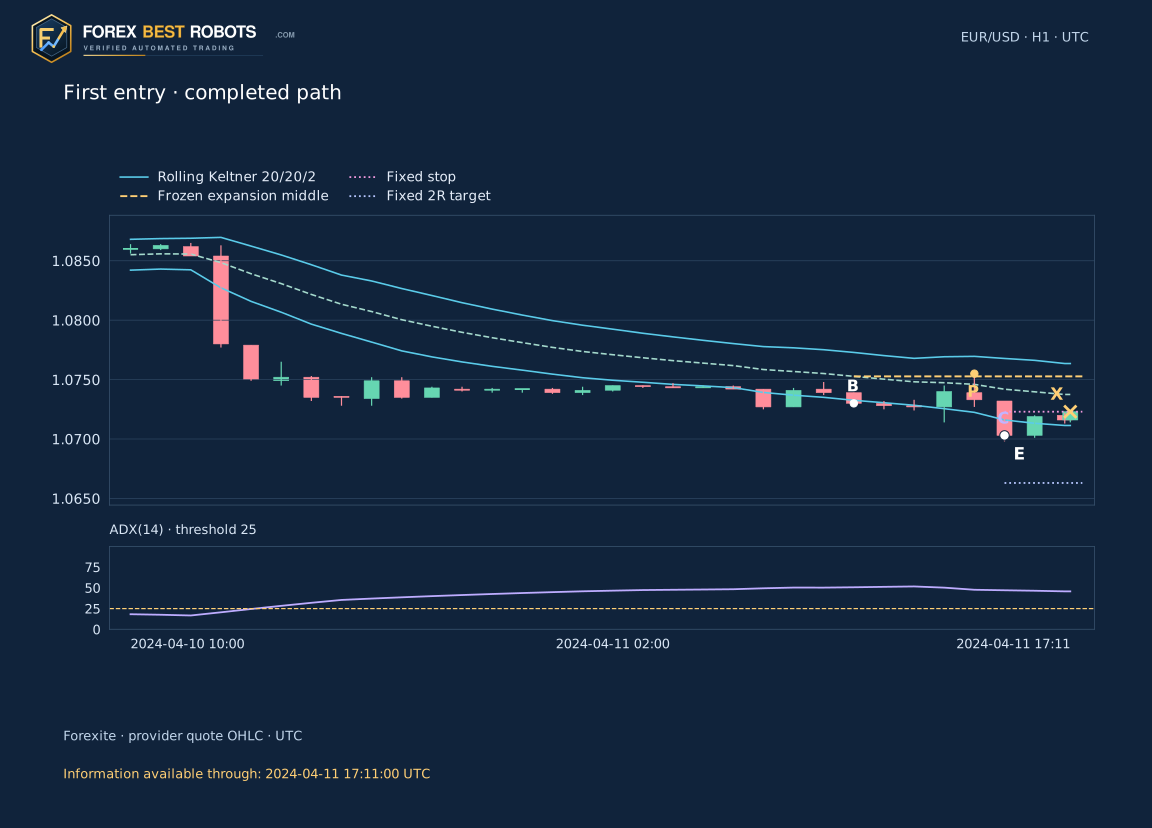
The first baseline entry is short on 11 April 2024. Expansion B closes at 10:00; its frozen middle is approximately 1.075272. The first touch P closes at 14:00 with High 1.075500 and Close 1.073300. The next C closes at 15:00 at 1.070300, below P’s Low 1.072700. ADX is 47.1121, so both variants admit the entry at 1.070300.
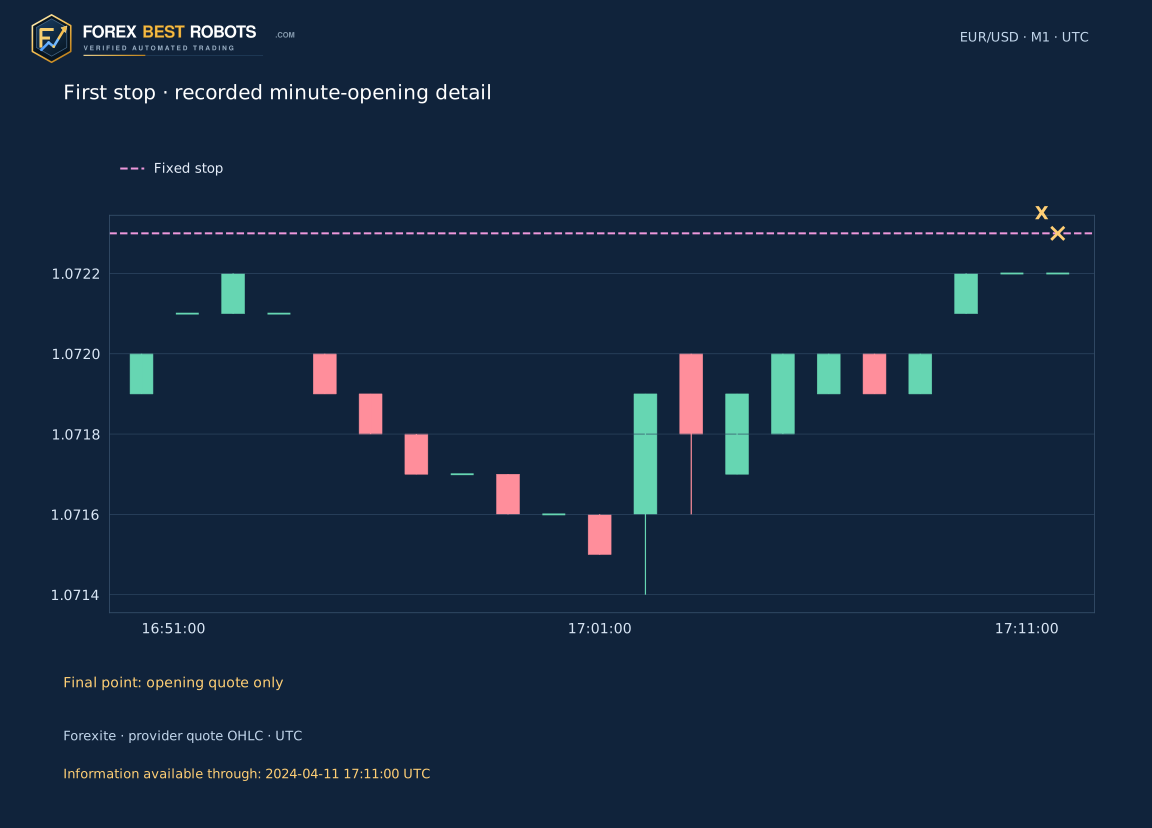
Initial risk is 20 pips, stop 1.072300 and target 1.066300. The recorded 17:11 minute opening quote equals the stop; gross result is −20 pips and net result with a 2-pip allowance is (−20 − 2) / 20 = −1.10 R. The entry illustration stops at 15:00; the completed-path illustration separately discloses its 17:11 information cutoff. B/P/C mark expansion, pullback and confirmation; E/X mark entry and exit.
9. Count cancellations as part of the experiment
There are 175 first daily expansions: 91 in 2024 and 84 in 2025. Of those, 123 never touch the frozen middle within six hours, 24 fail their first touch, 19 fail the immediate confirmation and 1 is cancelled for incomplete candidate data. The remaining 8 enter the baseline; ADX retains 5 and rejects 3. These are different counts: 175 candidates are not 175 trades.
Every entered path in this sample resolves; none needs a guessed missing-minute or same-minute stop/target result. The frozen unresolved rules still matter for a future replay. Read the complete calendar CSV to see each cancellation. Reporting only the 8 entries would conceal how selective this first-pullback definition is.
| Decision / cancellation | Candidates |
|---|---|
| No first touch within six hours | 123 |
| First touch failed the price rules | 24 |
| Immediate next confirmation failed | 19 |
| Missing or incomplete candidate hour | 1 |
| Admitted entry | 8 |
10. Compare the annual split without claiming an edge
With a 2-pip total allowance, the baseline’s 4 resolved 2024 positions sum to +1.22 R; its 4 positions in 2025 sum to −2.53 R. ADX keeps 3 and 2 positions respectively, returning −0.66 R and −0.36 R. The combined totals are −1.31 R for Base and−1.03 R for ADX25. The filtered total is slightly less negative while its profit factor is lower; a smaller exposure sample does not establish a superior strategy.
The first rejected baseline position later reaches its target, illustrating that a strength filter can discard a winner too. That is a retrospective observation, unavailable at C. Eight versus five trades cannot support reliable win-rate, drawdown or robustness conclusions. 2025 applies unchanged rules with continuous indicator history; it is a later-year calculation, not an unseen or live forward test. Closed-trade R drawdown excludes intratrade movements and is not account drawdown.
Results and drawdown use resolved positions only. Eight and five entries are too few to establish an edge.
Assumed total cost per completed trade · pips: 2.0 pip.
| Period | Model | Entered | Resolved | Unresolved | Net R | Profit factor | Closed-trade drawdown · R |
|---|---|---|---|---|---|---|---|
| 2024 | Base | 4 | 4 | 0 | +1.22 | 2.11 | 1.10 |
| 2024 | ADX25 | 3 | 3 | 0 | -0.66 | 0.40 | 1.10 |
| 2025 | Base | 4 | 4 | 0 | -2.53 | 0.03 | 2.62 |
| 2025 | ADX25 | 2 | 2 | 0 | -0.36 | 0.19 | 0.45 |
| 2024 + 2025 | Base | 8 | 8 | 0 | -1.31 | 0.65 | 2.62 |
| 2024 + 2025 | ADX25 | 5 | 5 | 0 | -1.03 | 0.34 | 1.10 |
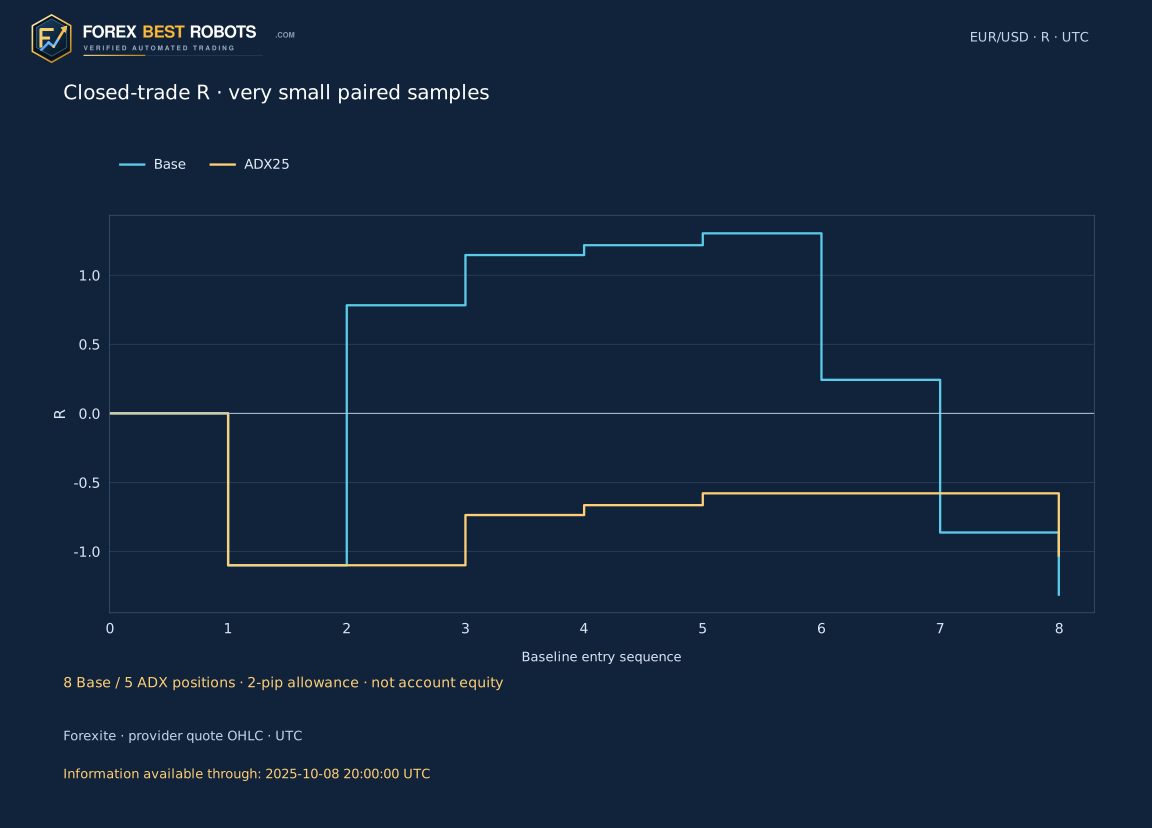
11. Change a cost allowance without changing the market history
The control applies a fixed total round-trip allowance per completed trade: net pips=gross pips−allowance; net R=net pips÷initial risk pips. Default cost is 2 pips, with 0/1/2/3/5 as comparison points and a 0–8 interactive range. These are assumptions, not measured broker charges. Real spreads, commission and slippage vary. The model is intraday, but that still does not establish any broker’s financing treatment.
Changing this number updates net results and the comparison table. It does not move the quote series, frozen reference, entry, stop, target, ADX decision or exit. Static illustrations and their R curve explicitly keep a 2-pip allowance. R sums weight trades by their different initial risk distances; they are not compounded returns, currency profits or a promise about future execution.
12. Inspect the decision before opening the full path
The default case is the first entered setup. The selector also contains all cancelled expansion candidates in chronological order. Choose Base or ADX25, then compare At decision with Complete path. At decision shows only observations available through entry or cancellation; exit and realized result stay hidden, including in the numerical formula. For an ADX rejection, the decision ends at C and no position is drawn. Switch to Base to inspect its separate admitted position.
Complete path is available only for an admitted position. Its final H1 may be partial or only an observed opening point: no later full candle is borrowed. The chart, dates and reason change together. Use the documented protocol and actual platform quote conventions for a separate demo investigation; this small replay with negative results after costs is a reproducible teaching example, not validation for real-account use.
The interactive example could not load. Use the static charts and downloadable observations.
Choose the inclusion model
Change the cost allowance
2.0 pip
Net result · R—
Changes net results only. Quotes, setup decisions and protective levels stay fixed.
- Expansion B · UTC
- —
- First touch P · UTC
- —
- Confirmation C · UTC
- —
- ADX(14) at C
- —
- Admission threshold
- —
- Selected model decision
- —
- Information available through · UTC
- —
- Entry quote · UTC
- —
- Frozen stop
- —
- Frozen 2R target
- —
- Initial risk · pips
- —
- This allowance · R
- —
- Exit quote / interval · UTC
- —
- Exit reason
- —
- Gross result · R
- —
On narrow screens, scroll the chart or formula within its block, or open a static chart at full size.
Show the numerical result
Show all first daily expansion candidates
| # | Expansion B · UTC | Model | Decision / cancellation | ADX(14) at C | Selected model decision |
|---|
Frequently asked questions
Does this breakout compare with the previous Keltner band?
No. It compares each completed Close with that same completed group’s 20/20/2 channel. The prior Close is compared with its own channel to require a fresh crossing. All values are known at the relevant group end.
Why is the ATR period 20 rather than 10?
Keltner has multiple implementations. This study fixes EMA20, Wilder ATR20 and multiplier 2 before the replay. A platform using ATR10 or another seed can produce different bands and events.
Does ADX above 25 tell me to buy?
No. ADX has no bullish/bearish sign. This model takes direction from the expansion and checks ADX only as a strength admission rule at C.
Why are there only 8 trades in two years?
The first daily expansion, first frozen-middle touch, strict first-touch requirements and immediate-next-candle confirmation are jointly selective. The 175-candidate calendar discloses where setups fail; 8 trades cannot establish an edge.
Can a rejected ADX setup be replaced by a later one?
No. The first expansion consumes the date in both variants. ADX25 is a subset of the same baseline calendar, with no later replacement or rescheduling.
What happens if one minute touches stop and target?
The quote series does not reveal their within-minute ordering. The frozen protocol marks that path unresolved and assigns no return. This sample has zero unresolved entered paths, but the rule is included in the replay.
Data, calculation method and scope
Verified 733 original daily Forexite ZIPs provide 751593 EUR/USD minute observations and 12530 UTC H1 groups, 12400 of them complete. Original prices have four decimals. Source timestamps use CET/CEST; the minute-end interpretation is a declared assumption. Partial groups remain in indicator history; required event groups must be complete. No missing quotes are filled.
The protocol and input hash were preserved before the first calculation. A separate SQL/48-digit Decimal calculation confirmed all 12530 H1 groups, 175 first-event decisions and 8 baseline paths. The download reproduces the exact results and lists all cancellations and the 5 retained positions. This verifies this implementation against this dataset; it does not remove source, execution or small-sample limitations.
- Download all 175 expansion candidates (CSV)
- Download the 8 baseline positions and ADX flags (CSV)
- Download minute inputs, the frozen protocol and standalone replay (ZIP)