

This setup waits for price to pull back through a rising or falling KAMA, then recover in the trend’s direction. The fixed 2024 replay produced 43 trades and −6.439 R after the base allowance. The base-cost result is negative; these rules have not demonstrated an edge in this sample. The complete rules, real source prices and every trade are available below.
1. A fixed pullback hypothesis, with its result
The hypothesis is that a temporary price move through KAMA against its recent slope, followed by a recovery, can capture continuation. A smooth line or a high Efficiency Ratio does not establish profitability. This fixed retrospective GBP/USD study declares the setup, cancellation and exits before calculation. No parameter search or changes after seeing the result were made.
2. Use real prices and a declared candle clock
The source contains 405,418 GBP/USD minute records from December 2023 through December 2024. December 2023 supplies history before evaluation. Source CET/CEST is converted to UTC, including the summer offset. H4 groups contain record timestamps in (end − 4 hours, end], ending at 00:00, 04:00, 08:00, 12:00, 16:00 and 20:00 UTC. Missing prices are not filled; short opening or closing groups remain.
3. Calculate KAMA(10,2,30) without restarting history
ER uses the absolute change across 10 close-to-close steps divided by their total absolute path. Ten steps require 11 closes. Set ER = 0 when the path is zero. SC = [ER × (2/3 − 2/31) + 2/31]²; K[t] = K[t−1] + SC × (C[t] − K[t−1]). Seed index 9 with the mean of the first 10 closes; the first recursive update is at index 10. Keep full precision and all earlier history, matching our guide’s declared convention.
ER[t] = |C[t] − C[t−10]| / Σ |C[j] − C[j−1]|
SC[t] = [ER[t] × (2/3 − 2/31) + 2/31]²
K[t] = K[t−1] + SC[t] × (C[t] − K[t−1])
Long slope: K[t] > K[t−3]
Short slope: K[t] < K[t−3]
4. Define direction from the line’s three-group slope
Long requires K[t] > K[t−3]; short requires K[t] < K[t−3]. Equality supplies neither direction. These are three observed completed groups, not necessarily twelve continuous hours across a market closure. ER measures path efficiency, not direction. No ER threshold, candle-body filter or second moving average is added to these rules.
5. Arm a fresh pullback and track its extremes
While flat, arm long only when the slope is up, previous close > previous KAMA, and current close ≤ current KAMA. Short mirrors this: down slope, previous close < previous KAMA, current close ≥ current KAMA. Start H/L at the setup group and extend them through every following group up to confirmation inclusive. Permit one setup or position. A long setup cancels if K[t] ≤ K[t−3], and a short setup if K[t] ≥ K[t−3], before checking recovery.
6. Confirm recovery within three observed groups
While the required slope still holds, the first strict close above KAMA confirms long; below KAMA confirms short. Only the next three observed groups are eligible. Equality and a wick do not confirm. Evaluate group three before expiry. Freeze H/L at confirmation: the long stop is the lowest low from setup through confirmation; the short stop is the highest high. A cancelled or expired setup may be replaced by a fresh eligible setup at that close.
7. Enter at the next minute open and define initial R
After confirmation, use the first available next-group minute record’s open as the reference entry E. This is a minute-data approximation, not an observed broker fill or first tick. Long stop S = L; short stop S = H. Cancel the single attempt if the stop is on the wrong side of entry or the distance is below 5 pips. Initial R is |E − S|; the target is E + 2R for long or E − 2R for short. Here one pip means 0.0001 in GBP/USD.
Initial R = |Entry − Stop|
Long target = Entry + 2 × Initial R
Short target = Entry − 2 × Initial R
Net R = (gross pips − allowance pips) / initial stop pips
8. Keep exits fixed and handle uncertain price order
Check each minute, including the entry minute. A gap through the stop exits at that minute’s open. A favorable gap through the target receives the target price, with no assumed improvement. If both levels are touched within one minute, assign the stop first. Otherwise use the touched level. After 12 following observed H4 closes from confirmation, exit at the next minute open if still held; opening stop/target gap checks come first. Remaining positions are closed at the last used quote when data ends.
9. Apply transparent costs to the reference-price replay
The base allowance is 1.5 pips per round trip plus 0.2 pip per crossed UTC date boundary. Stress uses 3.0 plus 0.5; the zero-cost case deducts nothing. These are illustrative combined trading and holding allowances, not measured historical spreads or broker swaps. Cost scenarios revalue the same trades without changing selection. Net R = (gross pips − total allowance)/initial stop pips; a stopped trade can therefore lose more than 1R.
10. Read the full-year result after costs
Evaluation covers the available completed UTC groups in 2024 through 2024-12-31 20:00 UTC. There are 43 trades. With the base allowance, net result is −6.439 R, net price movement −98.7 pips and R-based profit factor 0.749. The maximum closed-trade drawdown is 6.829 R. The base-cost result is negative; these rules have not demonstrated an edge in this sample. These are reference-price simulation results, not a live account return.
| Scenario | Zero allowance | Base allowance | Stress allowance |
|---|---|---|---|
| Trades | 43 | 43 | 43 |
| Net win rate (%) | 39.5 | 37.2 | 34.9 |
| Net pips | −20.0 | −98.7 | −184.5 |
| Net R | −3.372 | −6.439 | −9.697 |
| Profit factor (R) | 0.858 | 0.749 | 0.651 |
| Closed-trade drawdown (R) | 5.984 | 6.829 | 9.697 |
11. Compare chronological halves without retuning
The first half has 19 trades and −2.736 R after base costs; the later half has 24 trades and −3.703 R. Trades are assigned by entry date. Settings and exit rules are unchanged. These are descriptive chronological segments of a retrospective test, not genuinely unseen or prospective validation. No annualized return is inferred from them.
| Entry period | January–June | July–December |
|---|---|---|
| Trades | 19 | 24 |
| Net win rate (%) | 42.1 | 33.3 |
| Net pips | −50.5 | −48.2 |
| Net R | −2.736 | −3.703 |
| Profit factor (R) | 0.709 | 0.772 |
| Closed-trade drawdown (R) | 3.798 | 6.829 |
12. Inspect the first trade in the first half
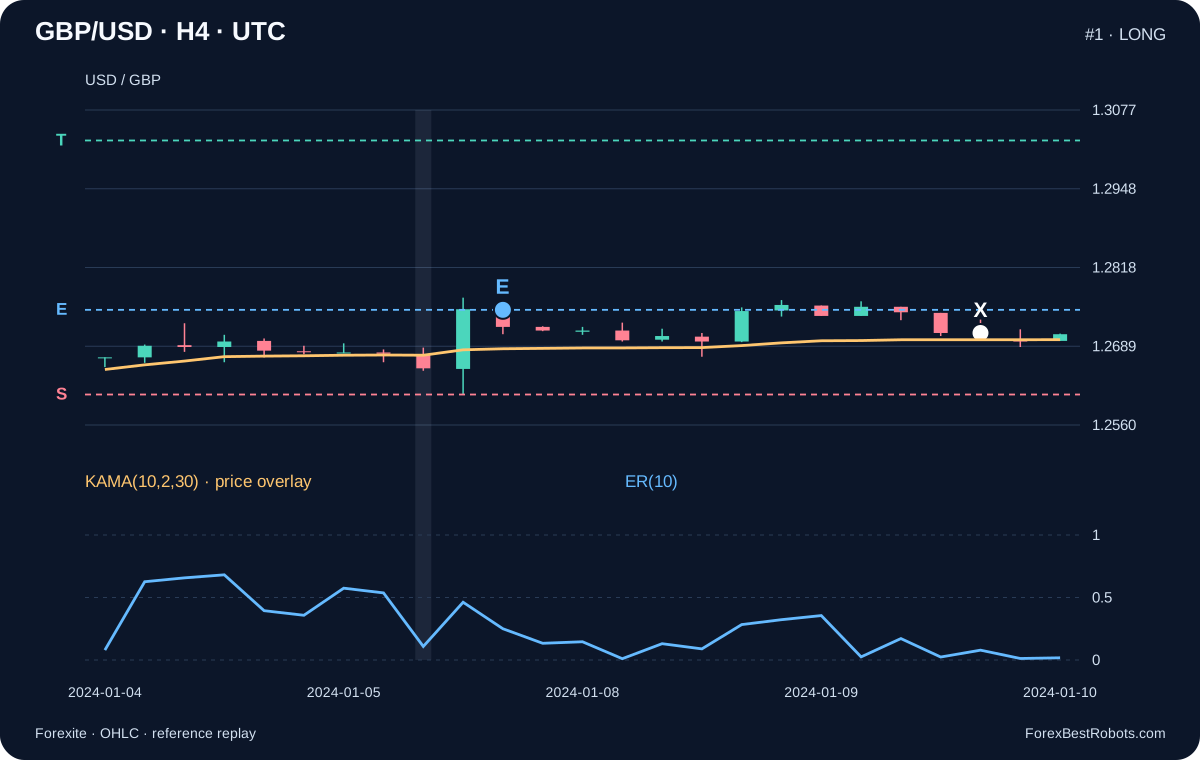
Trade 1: Long. The setup group closes at 2024-01-05 12:00 UTC; the confirmation group at 2024-01-05 16:00 UTC. Reference entry is 1.2749 at 2024-01-05 16:01 UTC, stop 1.2610, target 1.3027, initial risk 139 pips. Exit is 1.2711 at 2024-01-09 12:01 UTC; base net result −0.290 R. It is the first entered trade of this half, selected irrespective of its outcome. Times label minute records, not exact fill times.
13. Inspect the first trade in the later half
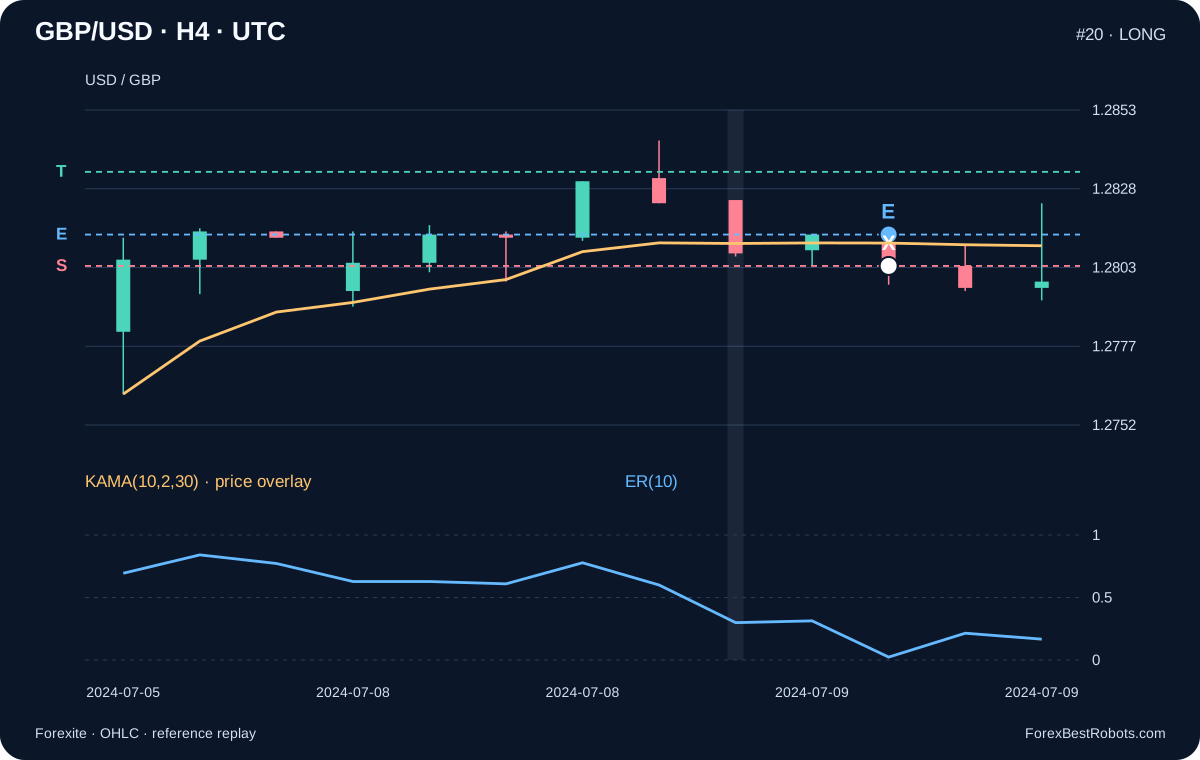
Trade 20: Long. The setup group closes at 2024-07-08 20:00 UTC; the confirmation group at 2024-07-09 00:00 UTC. Reference entry is 1.2813 at 2024-07-09 00:01 UTC, stop 1.2803, target 1.2833, initial risk 10 pips. Exit is 1.2803 at 2024-07-09 01:24 UTC; base net result −1.150 R. The same rules apply. The full CSV includes every trade, including losses and timed exits.
14. Explore one trade at a time
Start with a recorded trade, then compare the cost assumptions. The chart and the short result below refer to your selected trade.
The number, entry date and direction identify the example. Use the list or Previous / Next.
- Entry record (UTC)
- —
- Exit record (UTC)
- —
- Reference entry E
- —
- Fixed stop S
- —
- Fixed target T
- —
- Modeled exit X
- —
Only the cost deduction changes. The same entry, exit and trading rules remain in place.
- Before costs
- —
- Costs
- —
- After costs
- —
— R
The three main values are pips. Net R uses this trade’s initial stop distance.
Show calculation details
- Direction
- —
- Setup close (UTC)
- —
- Confirmation close (UTC)
- —
- Initial stop distance (pips)
- —
- UTC date boundaries crossed
- —
- Exit reason
- —
- Full-year net result (R)
- —
- Full-year profit factor (R)
- —
- Maximum closed-trade drawdown (R)
- —
Result calculation
Real historical quote candles; a complete H4 candle can include prices after a modeled exit inside it. These are reference-price simulations with illustrative costs.
15. Separate normalized R from account risk
R normalizes each outcome by its initial gross price stop distance. Profit factor and drawdown here use those R outcomes, not raw pips. Closed-trade drawdown omits unrealized swings and margin pressure. Position sizing would also need contract size, currency conversion, costs and execution limits. A 1R reference stop does not cap a gap loss or guarantee a particular account percentage.
16. Check the limitations and reproduce before adapting
The records do not provide a verified Bid/Ask pair, tick sequence, depth or broker fills. Stop-first resolves same-minute ambiguity conservatively under this model, but does not reconstruct the true path. The calendar holding allowance is not a broker’s financing schedule. One year and one pair are insufficient to establish robustness. Reproduce the frozen rules, then test longer histories, other feeds, variable costs and a genuinely separate period before considering changes.
Frequently asked questions
Does a close above KAMA immediately open a long trade?
It can only confirm an existing eligible long pullback with the required upward slope. The reference entry is the first available minute-record open in the next observed group.
When is the stop range allowed to change?
H/L extend from the setup group through the confirmation group inclusive. They freeze at confirmation and never move while the position is held. This differs from the Aroon strategy’s range frozen at its initial cross.
Are these actual historical broker executions?
No. The source is minute quote OHLC. Entries and exits are a declared reference-price replay, with explicit gap and same-minute assumptions and illustrative cost deductions.
Does a positive sample prove the strategy works?
No. Fixed retrospective results on one pair and one year need longer histories, other sources, realistic execution costs and genuinely separate validation.
Data, timing and reproducibility
Source: 397 daily Forexite MetaStock archives, 2023-12-01 through 2024-12-31. Original archive SHA-256 and CRC were checked before extraction. The used GBP/USD records preserve the source timestamp, CET/CEST offset and original four-decimal OHLC. H4 groups use the first open, maximum high, minimum low and last close.
The extraction contains 405,418 minute records and 1,747 H4 groups including warm-up; 1,618 groups fall in evaluation. The first source-boundary-cut group and groups beyond the declared endpoint are omitted. No missing minute or weekend prices are inserted. 0 exits required the same-minute stop-first rule.
The download includes all used minute records, aggregate candles, every trade and event, the frozen protocol with its hash, source URLs and archive hashes, replay code and a separate verification implementation. The January–June and July–December summaries classify trades by entry date. Reproducing a calculation is separate from validating a tradable edge.
- H4 prices, KAMA, ER and SC (CSV)
- Every reference-price trade and cost scenario (CSV)
- Minute data, frozen rules and replay code (ZIP)