

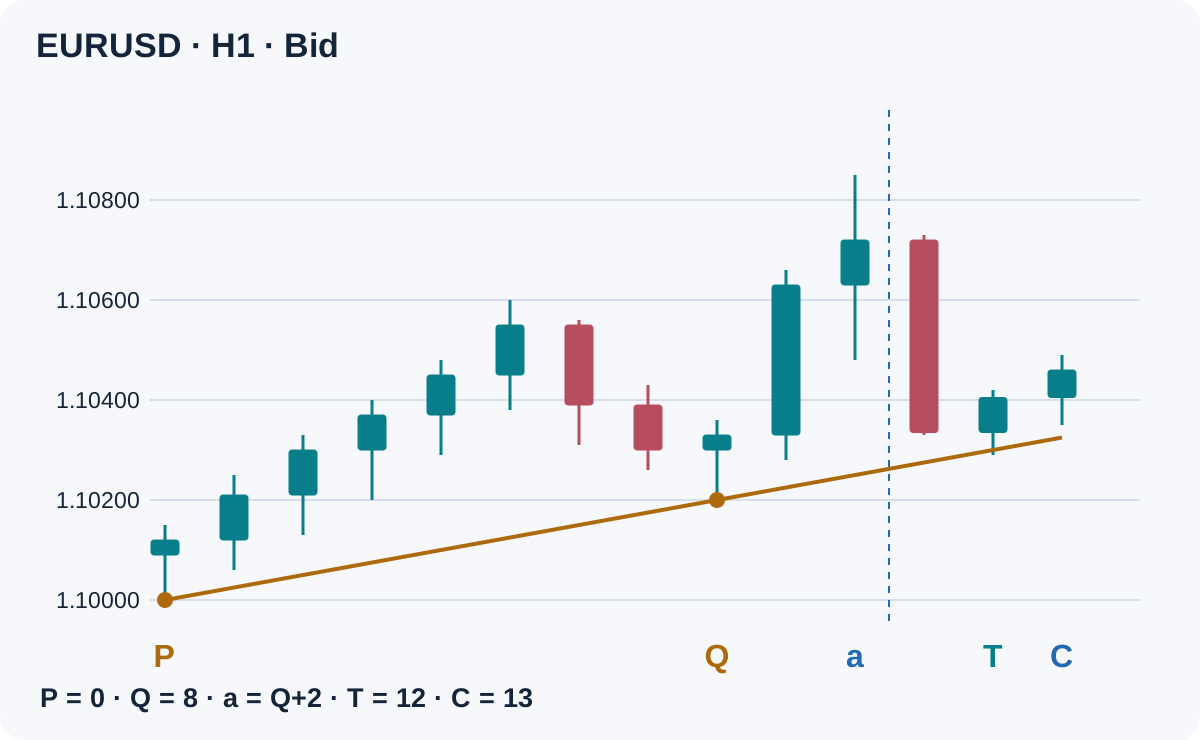
A trendline pullback strategy needs more than a line that looks convincing after a rebound. This H1 specification fixes two confirmed swing anchors, waits for the first later approach and requires a separate completed confirmation candle. The line identifies location; it does not guarantee support or a profitable trade.
1. Define what this continuation setup tests
The hypothesis is that an established directional move may resume after returning to a rising support line or falling resistance line. Unlike the Flag continuation strategy, this setup has no three-candle flag or measured-pole target. Unlike an EMA pullback, its reference comes from two price pivots. It uses ordinary Bid candles, not Heikin Ashi prices.
All settings below are illustrative research choices: H1, strict five-bar pivots, anchor spacing of 4–20 bars, ATR period 14, a 6-bar approach window and a net reward/risk floor of 1.5. They are not optimized values or evidence of an edge. Check the market-structure guide if swing terminology is unfamiliar.
2. Wait until both anchors are knowable
Number H1 bars chronologically. A swing low at index i must have a strictly lower Low than each of the two bars before and two bars after it. It becomes confirmed only when bar i+2 closes. A swing high uses strictly higher High values. Equal extremes fail this particular definition; the forming bar cannot confirm a pivot.
For BUY, take the two latest confirmed swing lows, P and Q, when the second right-hand bar of Q closes. Require 4 ≤ Q−P ≤ 20 and Low(Q) > Low(P). For SELL, use the two latest confirmed swing highs and require High(Q) < High(P). Do not choose an older, prettier pair. Only one episode is allowed for a given pair of anchor timestamps.
Call that evaluation bar a = Q+2. At its close, save A, the ATR(14) value for a, and set b = 0.10 × A, rounded upward to a whole tradable price tick. Reject missing history, nonpositive ATR or unavailable contract data. In MT4 this ATR is read at shift 1 on the first tick of the next bar; shift 0 would still change.
3. Require expansion before arming the line
For BUY, define Hpre as the highest High strictly between P and Q. Arm only if Close(a) > Hpre+b. Fix target M at the highest High from Q+1 through a. For SELL, use the lowest intervening Low, Lpre; require Close(a) < Lpre−b and fix M at the lowest Low from Q+1 through a.
Evaluate this pair once at a. If the expansion test fails, discard it instead of waiting for a later bar to make it pass. Save the anchors, A, b and M together. Ignore new pivots during the active episode; never redraw a line around a later loss. Start no episode while a position on the same symbol is already open.
4. Project prices instead of judging chart angles
For BUY, the projected value for bar k is L(k) = Low(P) + (Low(Q)−Low(P)) × (k−P)/(Q−P). Replace the two Low values with High values for SELL. Indices count consecutive H1 bars with no missing hourly timestamps between P and confirmation. Skip an episode crossing a weekend or another missing-bar gap.
Use this single L(k) value for the entire test of bar k. The tolerance zone is [L(k)−b, L(k)+b]. Do not test an intrabar intersection with a moving diagonal. Chart zoom can change a line's visible angle without changing its price equation. The drawn line is a guide to these bar-indexed references.
5. Accept only the first later approach
Inspect completed bars a+1 through a+6. For BUY, a Low above L(k)+b means keep waiting. A Low below L(k)−b, or at or below Low(Q)−b, cancels the episode. Otherwise the first bar entering the zone is the only candidate T. A failed first touch cannot be replaced by a better second touch.
BUY requires High(T) > Low(T), Close(T) > Open(T), Close(T) > L(T)+b and a close in the upper quarter: Close(T) ≥ Low(T)+0.75×(High(T)−Low(T)). Set breakout reference B = High(T)+b and stop S = Low(T)−b. If no valid first touch occurs within the window, expire the episode.
6. Give exactly one later candle to confirm
Only the next H1 candle, C = T+1, can confirm BUY. Require Close(C) > B, Close(C) > Open(C) and Low(C) > S. A wick above B, a close equal to B or a close arriving one candle later fails. T itself cannot supply its own later confirmation.
The diagonal is a location filter during the approach, not a trailing invalidation line after T. From then on, use frozen B and S and the single confirmation deadline. Do not add a fresh line test at C or move S as the projection rises. Cancel if C fails; do not install a pending entry order at B.
7. Apply the complete SELL rules
For a falling line, wait while High(k) < L(k)−b. Cancel if High(k) > L(k)+b or High(k) ≥ High(Q)+b. The first zone approach T must have a positive range, Close(T) < Open(T), Close(T) < L(T)−b and Close(T) ≤ Low(T)+0.25×(High(T)−Low(T)).
Freeze B = Low(T)−b and S = High(T)+b. On the immediately following C, require Close(C) < B, Close(C) < Open(C) and High(C) < S. SELL entry uses Bid; both the protective stop S and target M are fixed Ask trigger levels. A widening spread can stop a short before the Bid chart touches S. Never backtest SELL exits from Bid candles alone.
8. Check the first executable quote
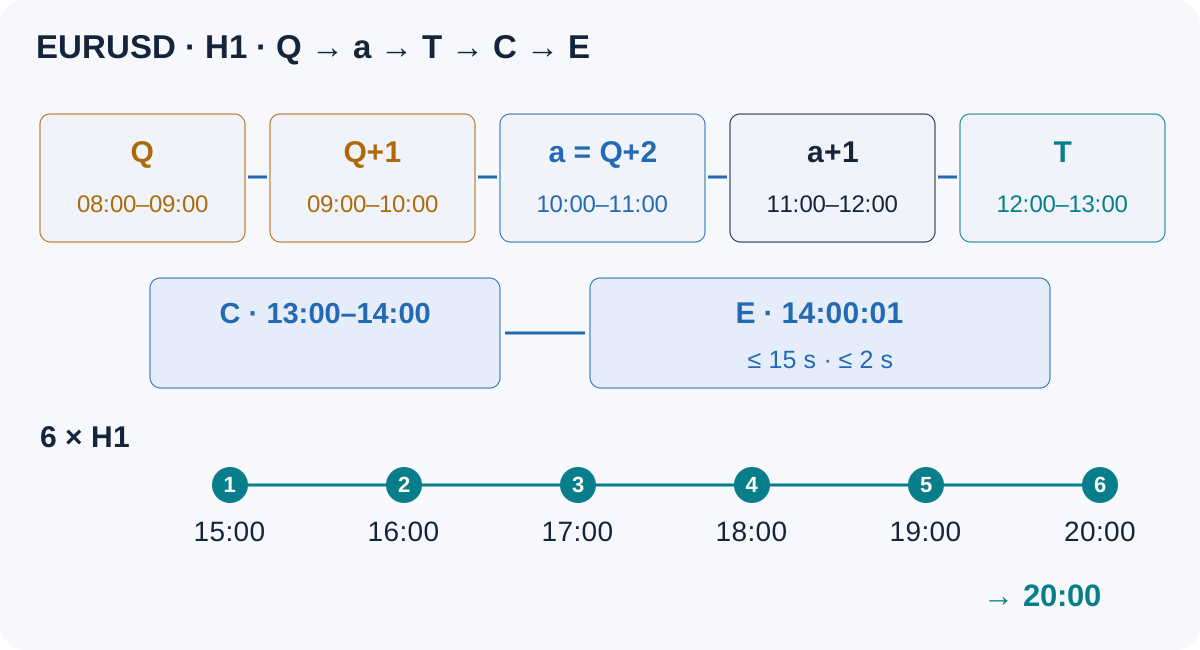
After C closes, inspect the first available quote within 15 seconds; it must be no more than 2 seconds old. BUY uses Ask, SELL uses Bid; call this entry reference E. Require abs(E−Close(C)) ≤ b and Ask−Bid ≤ 0.15×A. If this first quote fails, discard the episode rather than waiting for a cheaper quote.
BUY also needs Bid > B and S < Bid ≤ Ask < M. SELL needs Ask < B and M < Bid ≤ Ask < S. Verify tick alignment, minimum stop distance, volume limits, margin and trading permission. An order request is not a fill. After a rejection, do not retry this episode; after an uncertain timeout, reconcile orders before any further request.
9. Keep one exit policy and a separate risk budget
BUY exits use Bid at S or M; SELL exits use Ask. Keep both levels fixed: no widening, break-even move, partial exit or line trailing in this specification. If neither exit occurs, request closure at the first quote after the sixth post-entry H1 bar closes. Count actual bar closes after the fill, including the entry bar's close. Stops and time exits may fill worse during gaps or outages.
Estimate loss and reward per lot in the account currency from the appropriate entry and exit price sides. Include round-trip commission, an explicit adverse-execution allowance and applicable swap. Require positive net reward and net reward / planned loss ≥ 1.5. Divide a preassigned cash-risk budget by planned loss per lot and round volume down to the broker's step. Skip if minimum volume exceeds the budget; also check total correlated exposure.
10. Reconstruct the synthetic EURUSD setup
This is an invented teaching dataset, not a historical trade or backtest. All times use one broker-server clock. P is bar 0, with Low 1.10000; Q is bar 8, with Low 1.10200. The surrounding two bars on each side have strictly higher lows, and no intervening low qualifies as another confirmed pivot. Q becomes knowable only when bar 10 closes at 11:00.
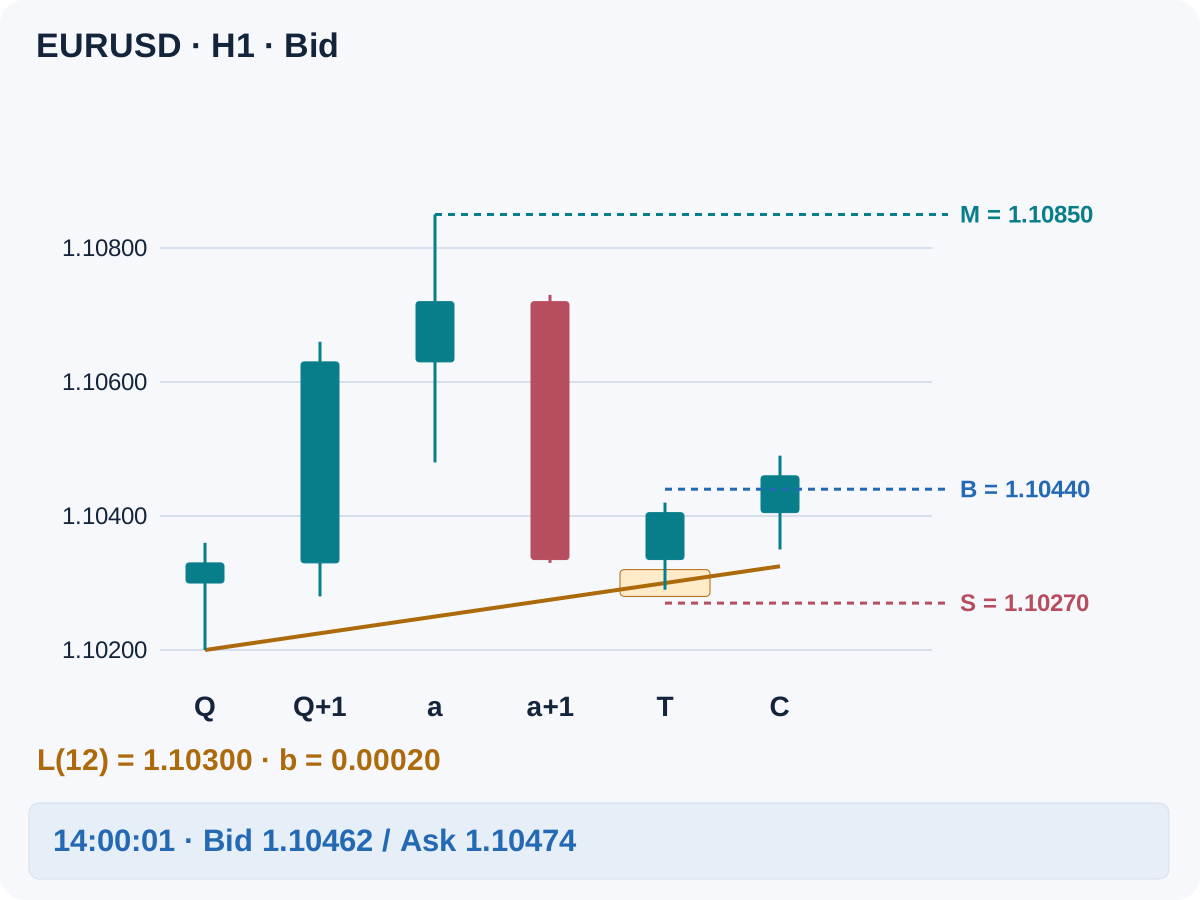
At that instant assume a saved ATR input A = 0.00200, so b = 0.00020 on a five-decimal EURUSD grid. The short chart excerpt does not recompute the preceding ATR history. With Hpre = 1.10600, Close(a) = 1.10720 passes the expansion test, and the completed post-Q high fixes M = 1.10850. The line rises by 0.00025 per H1 bar.
Bar 11 stays above its zone. For T at index 12, L(12) = 1.10300 and the zone is 1.10280–1.10320. The table shows a valid bullish rejection: its close exceeds 1.10320 and the upper-quarter threshold 1.103875. This freezes B = 1.10440 and S = 1.10270. C closes above B without touching S.
| Bar | Server interval | Open | High | Low | Close |
|---|---|---|---|---|---|
| 11 | 11:00–12:00 | 1.10720 | 1.10730 | 1.10330 | 1.10335 |
| 12 · T | 12:00–13:00 | 1.10335 | 1.10420 | 1.10290 | 1.10405 |
| 13 · C | 13:00–14:00 | 1.10405 | 1.10490 | 1.10350 | 1.10460 |
At 14:00:01, the first fresh quote is Bid 1.10462 / Ask 1.10474. Spread is 1.2 pips and entry deviation is 1.4 pips: both gates pass. Entry is still a planning reference, not an asserted fill. The chart stops here; no future winning path is drawn.
11. Calculate size after execution costs
Assume a USD account, 1 pip = 0.00010, a 100,000 EUR contract and $10 per pip per lot. Commission is $7 round trip per lot; the total adverse-execution allowance is 1 pip per lot across entry and exit. Swap is assumed zero only for this example. The Bid/Ask distance already includes spread: do not add it again.
| Planning measure | Calculation |
|---|---|
| Entry to stop | (1.10474−1.10270)/0.00010 = 20.4 pips |
| Entry to target | (1.10850−1.10474)/0.00010 = 37.6 pips |
| Planned loss per lot | 20.4×$10 + $7 + $10 = $221 |
| Net target amount per lot | 37.6×$10 − $7 − $10 = $359 |
| Net reward/risk | $359/$221 ≈ 1.6244 |
| Illustrative cash budget | $10,000×0.5% = $50 |
| Volume, step 0.01 | floor(($50/$221)/0.01)×0.01 = 0.22 lots |
| Planned risk / net target amount | $48.62 / $78.98 |
The net target amount is a conditional calculation, not expected profit or a maximum-loss guarantee. Tick value and conversion differ by instrument and account currency. Recalculate with actual fills and record any excess loss. For a fill near 14:00:01, the six bar closes run from 15:00 through 20:00; the time-exit request follows the last close if S and M have not triggered.
12. Reject attractive-looking failures
If T's Low were 1.10270, it would lie below the zone floor 1.10280; cancel before considering the rebound. A C close of 1.10440 is equal to B and also fails. A later rally cannot repair either decision. If the approach window expires, do not extend it because price eventually reaches the line.
A first Ask of 1.10495 is 3.5 pips above the confirmation close, exceeding the 2-pip deviation limit. Reject it even if the chart still looks good. Separately, if the fixed target were only 1.10700, the original quote would give $209/$221 ≈ 0.9457 after costs, below the net gate. Do not move the target farther away to rescue that setup.
13. Store an episode, not a moving drawing
An EA needs anchor timestamps and prices, pivot-confirmation times, the frozen ATR and tick-rounded buffer, target, first-touch status, C deadline and a consumed flag. Process each completed bar once. Persist the episode across restarts; refresh history and reconcile live orders before resuming. Do not confuse MT4's reverse series shifts with the chronological indices used in this article.
Log every rejected episode with its reason, the first quote and age, request result, actual fill, fees and exit. Fix a calendar rule before testing; one illustrative exclusion is no entry within 30 minutes before or after scheduled high-impact news for either currency, and no entry within 15 minutes of rollover. If timing data is unavailable, skip. Broker stop restrictions may prevent a request even when the price pattern qualifies.
14. Test geometry, timing and failure cases
Replay pivot availability in order. Include all first touches, broken lines, timeouts, absent quotes and rejected orders. Test nearby pivot widths, anchor gaps and tolerances on development data, then freeze the specification before out-of-sample and demo forward testing. A different rejection or exit rule is a different model. Use the MT4 backtesting guide for data and execution checks.
Use Bid and Ask history for executable exits, particularly SELL. With only OHLC data, a candle touching both stop and target has unknown event order: apply a predeclared conservative convention or exclude such results transparently. Assess transaction costs, drawdown, exposure and sensitivity across periods rather than presenting a selected winning chart. This article supplies no measured win rate, return or validation result.
15. Run the final entry checklist
Both pivots confirmed; latest eligible pair; expansion passed at a; anchors and target frozen; no missing hourly bars; first approach valid within its window; exactly one later C confirmed; first fresh quote passed; stop and target executable; net reward/risk acceptable; volume rounded down; margin, calendar and aggregate risk checked. A single failed mandatory check means no order. Review position sizing and portfolio risk separately from the visual pattern.
16. Trendline pullback questions
Does the third touch prove that a trendline is reliable?
No. Two anchors define the reference and the first later approach tests a hypothesis. The touch and completed confirmation can both fail. Reliability requires measured results under declared data, costs and testing conditions.
Can I mark Q as soon as its candle closes?
Not with this pivot definition. Q requires two later completed bars. Using it earlier would import information unavailable at that decision time. If that delay misses a rebound, the episode is simply unavailable.
Should I move the line when a newer swing appears?
Not during an active episode. Keep its original anchors and deadlines. A new pair is eligible only at its own Q-confirmation event, after the old episode ends and while the symbol has no open position. A confirmation missed while busy cannot be used retrospectively.
Why is the visible line angle unsuitable as a rule?
Zoom and axis scaling change its appearance. The equation uses prices and bar indices instead, so the same saved dataset gives the same projected reference without judging whether a line looks steep.
Why can a short stop trigger before the Bid chart reaches it?
A SELL position closes at Ask. A wider spread can lift Ask to the fixed stop while Bid remains below it. Historical Bid candles alone cannot reproduce that execution correctly.
Does this method describe the logic of a listed Forex robot?
No. It is an independent educational specification. An EA's actual rules, contract conditions, raw reports and public monitoring must be reviewed separately; none of the listed products is claimed to implement this method.
17. Technical reference and limits
MetaQuotes documents order price sides and broker stop restrictions in its MQL4 trade requirements. The pivot selection, tolerances, deadlines and risk gates here are an author-defined example, not rules certified by MetaQuotes. Drawings show synthetic data and no realized outcome.