

EMA and ADX can agree after the attractive part of a move has already passed. They can also disagree without either calculation being wrong. This guide separates directional context, nondirectional strength and the freshness of a price event. Invented M5 histories and independent quote plans show what those distinctions change; they do not demonstrate trading performance.
1. Separate three questions before reading the chart
EMA context asks how chosen price averages relate. ADX strength asks about the smoothed imbalance of directional movement. A price event asks whether something new happened under a declared rule. Agreement among the first two is not a fresh event, an executable quote or an affordable trade. On M5, an extra confirmation bar also adds time during which the price and remaining target room may change.
This guide compares observations rather than prescribing another entry recipe. It extends the broader EMA/ADX/ATR roles guide by examining cooling strength, completed-bar alignment and stale confirmation on a short timeframe. The companion two-bar EMA/ADX strategy has its own complete conditions; its particular cooling rule is not a universal instruction. Every history and quote plan here is invented, with no transmitted orders or realised results.
The EMA and ATR scalping guide to quiet markets, expansion and late costs separates a frozen baseline, a changing average and independent quote-plan arithmetic.
2. Give EMA a precise, limited context role
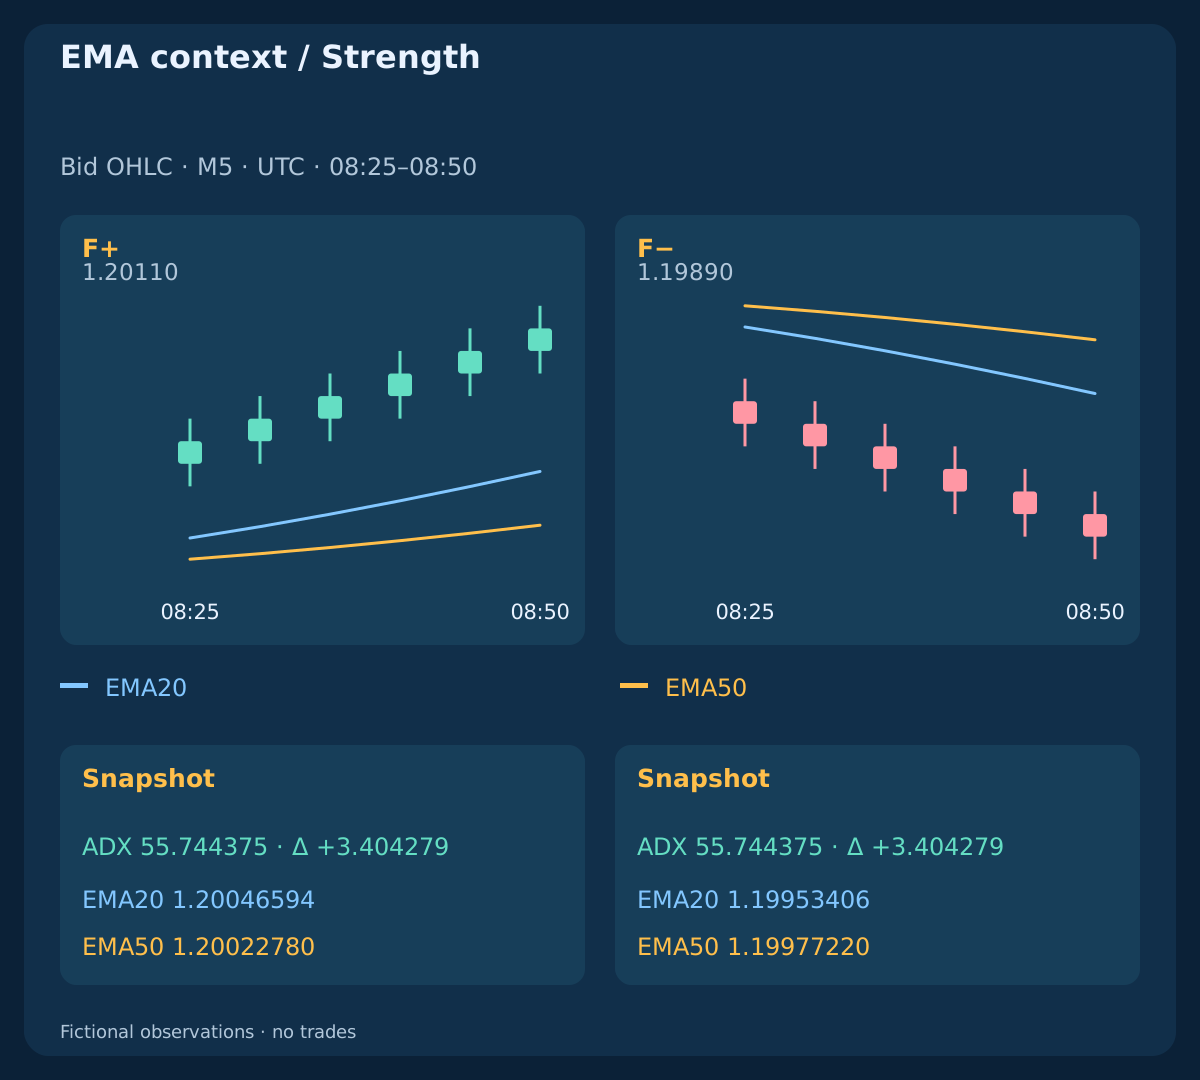
Use Close-based EMA20/50 on scheduled M5 Bid bars. Seed each period n with its first n closes, then use EMA_n(k)=[2×Close(k)+(n−1)×EMA_n(k−1)]/(n+1). The first values occur at k19 and k49. For this lesson define F+=[EMA20>EMA50 AND EMA50(k)>EMA50(k−3)]; F−=[EMA20<EMA50 AND EMA50(k)<EMA50(k−3)]. Equality belongs to neither context.
These labels describe relationships, not instructions to buy or sell. A close can fall while F+ remains true, and a brief rebound can occur inside F−. The fictional EURUSD unit convention is pip=0.0001; point=tick=0.00001. Keep symbol, quote side, timeframe, price input, seed and timestamp together. A different history or method can change values; no native-terminal equivalence is assumed.
3. Define the ADX calculation before comparing values
For k starting at 1 calculate u=High(k)−High(k−1); v=Low(k−1)−Low(k); TR=max(High−Low,abs(High−PreviousClose),abs(Low−PreviousClose)). Positive DM retains u only if positive and strictly greater than v; negative DM retains v only if positive and strictly greater than u. Ties set both to zero. At k14 seed the TR and DM means from k1–k14, then apply W(k)=[13×W(k−1)+raw(k)]/14.
Use DI_plus=100×W(DM_plus)/W(TR); DI_minus=100×W(DM_minus)/W(TR); DX=100×abs(DI_plus−DI_minus)/(DI_plus+DI_minus). With positive smoothed TR and zero DI sum, DX is zero; a zero TR denominator makes the comparison unavailable. Seed ADX with mean DX14–DX27 at k27, then ADX(k)=[13×ADX(k−1)+DX(k)]/14. This finite Wilder-style reference is explicit; match actual implementations before expecting parity. Missing data are not zero strength.
4. Distinguish the ADX level, slope and candle return
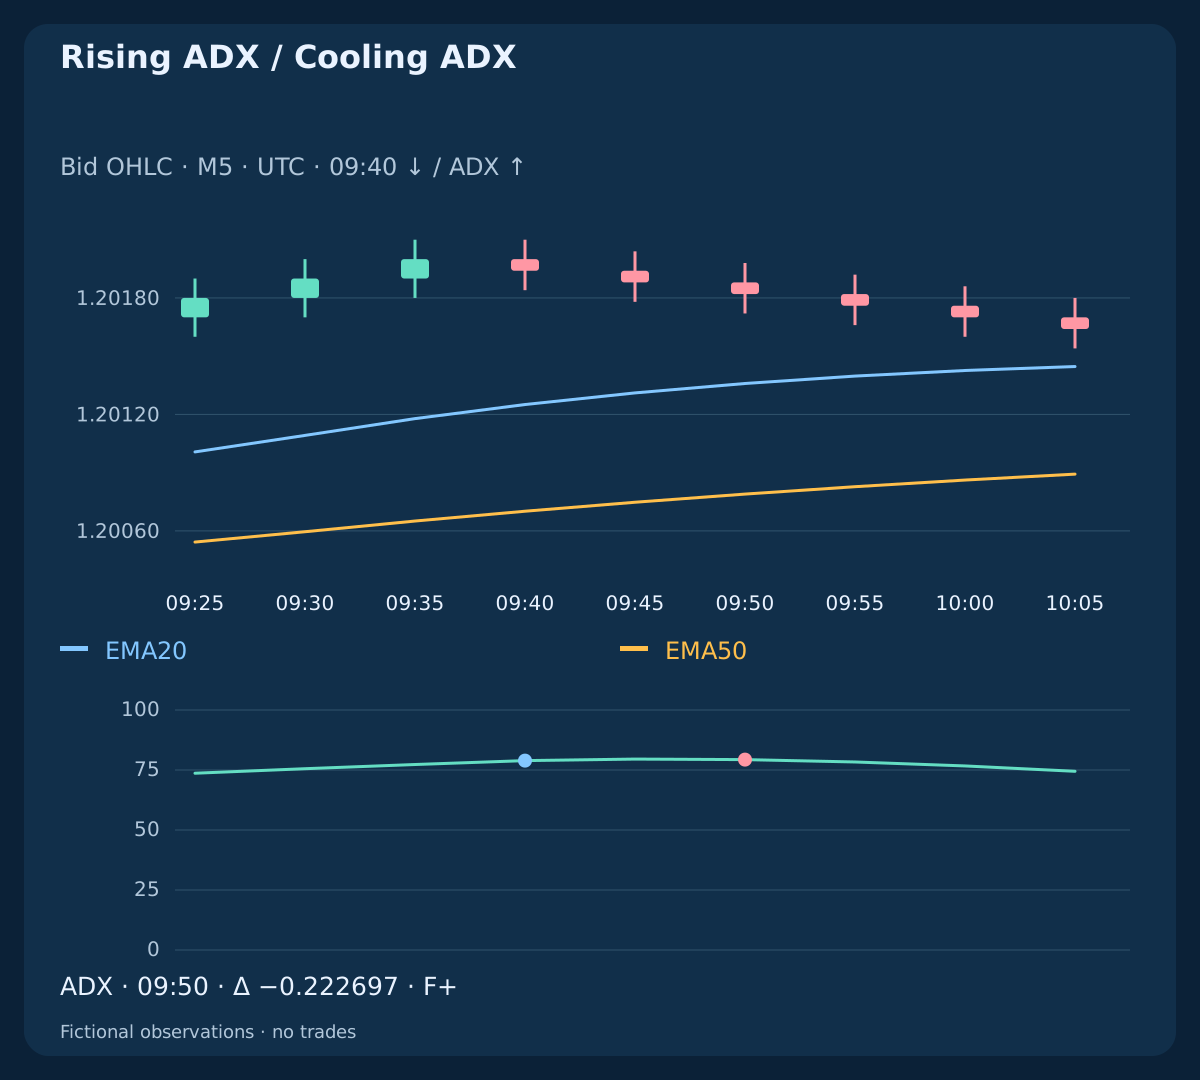
The level describes accumulated strength in the chosen calculation; delta_ADX=ADX(k)−ADX(k−1) describes its latest change. Neither carries the direction sign of a candle return. In the upward-history example, from 09:35 to 09:40 UTC the close falls 1.20200 → 1.20194 while ADX rises 77.285335 → 78.907811. The smoothing can still report increasing imbalance while the newest body is bearish.
At 09:50 the same history has ADX=79.328466; delta_ADX=−0.222697, with F+ still true. A high level with a negative slope is different from a low level with a positive slope. Requiring a rising ADX and merely requiring an ADX floor select different observations. Display rounding cannot choose the rule; retain full values before comparing thresholds.
| Observation | Context | EMA20 | EMA50 | ADX | ADX change |
|---|---|---|---|---|---|
| Rising ADX / F+ | F+ | 1.20046594 | 1.20022780 | 55.744375 | +3.404279 |
| Cooling ADX / F+ | F+ | 1.20135930 | 1.20078958 | 79.328466 | -0.222697 |
| Rising ADX / F− | F− | 1.19953406 | 1.19977220 | 55.744375 | +3.404279 |
| Same closes / Different highs / lows | F+ | 1.20046594 | 1.20022780 | 0.000000 | +0.000000 |
5. Read cooling without inventing a direction
Cooling ADX can accompany a pause, a loss of directional imbalance or an emerging reversal. The indicator alone cannot tell which will follow. In this constructed upward history, the 09:50 close is 1.20182, EMA20 is 1.20135930 and EMA50 is 1.20078958: strength is cooling, yet the close remains above both averages. This is a state description, not permission to enter or to ignore price invalidation.
The mirrored downward history at 08:50 has EMA20=1.19953406; EMA50=1.19977220; ADX=55.744375 and rising ADX in F−. The same ADX magnitude appears in the upward counterpart. Direction comes from the stated price/EMA or DI relationship, not ADX itself. If a strategy allows cooling only during a particular pullback, preserve all of that strategy's additional conditions instead of generalising its exception.
6. Align completed bars before testing agreement
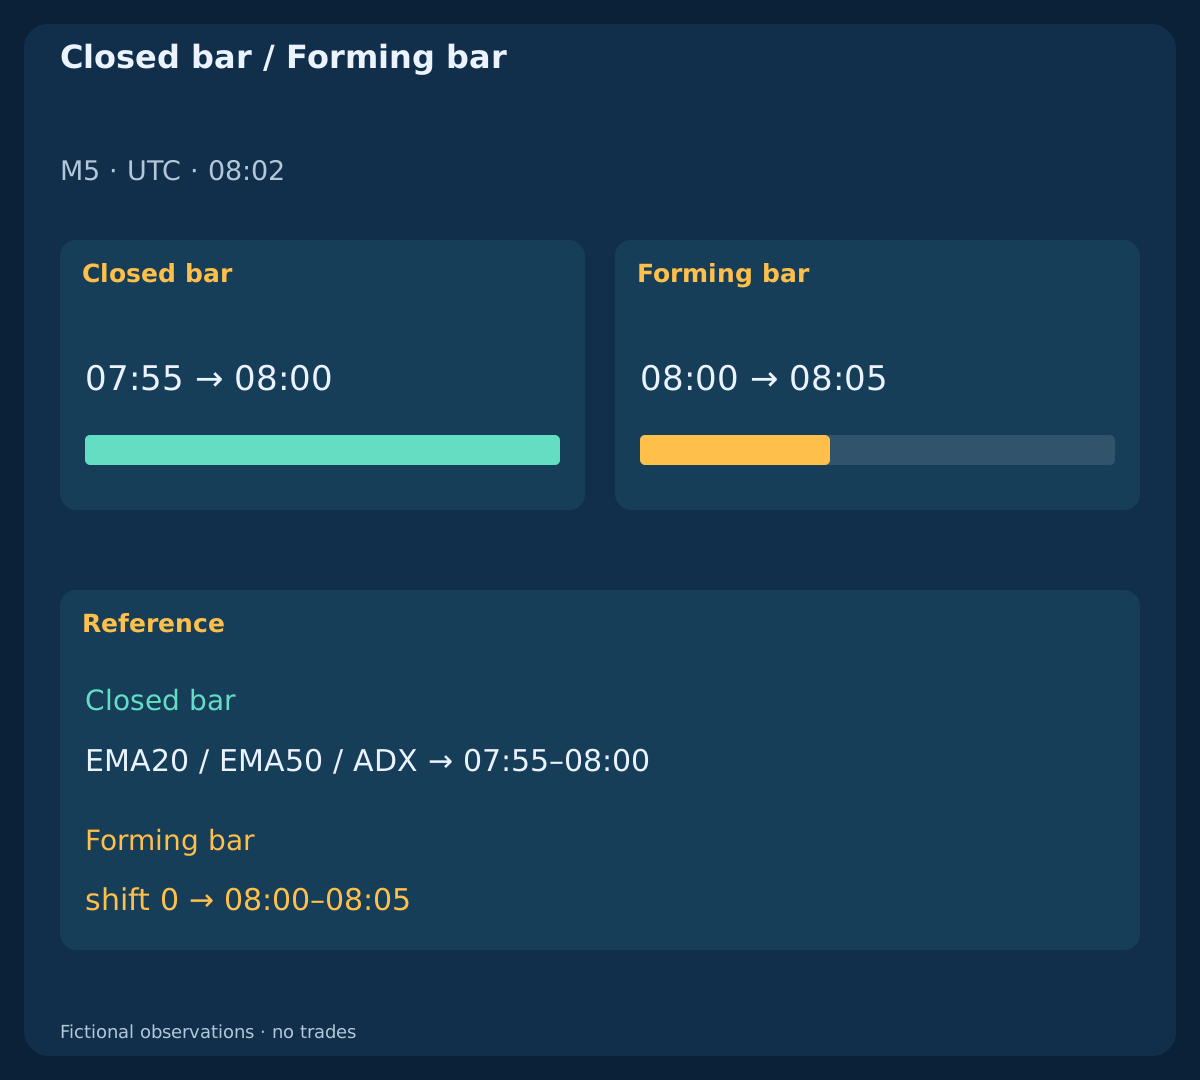
At an illustrative 08:02 UTC snapshot, the latest scheduled completed M5 interval is 07:55–08:00; the 08:00–08:05 interval is still forming. The CSV records both open and close timestamps. MT4 chart labels normally refer to bar opening time. Confirm the actual series timestamps and bar availability; a wall-clock boundary alone does not prove that a new bar or completed data have arrived.
Read EMA and ADX for the same completed interval. MT4 iADX MODE_MAIN is ADX; MODE_PLUSDI and MODE_MINUSDI are separate lines. The final shift is a historical buffer offset; shift 0 is forming. Moving-average ma_shift instead shifts the line on the chart. Store timestamps as relative shifts move. Indicator smoothing delay in bars and locally measured quote-receipt age are different quantities; a server timestamp does not measure network latency.
7. Treat agreement as overlapping evidence
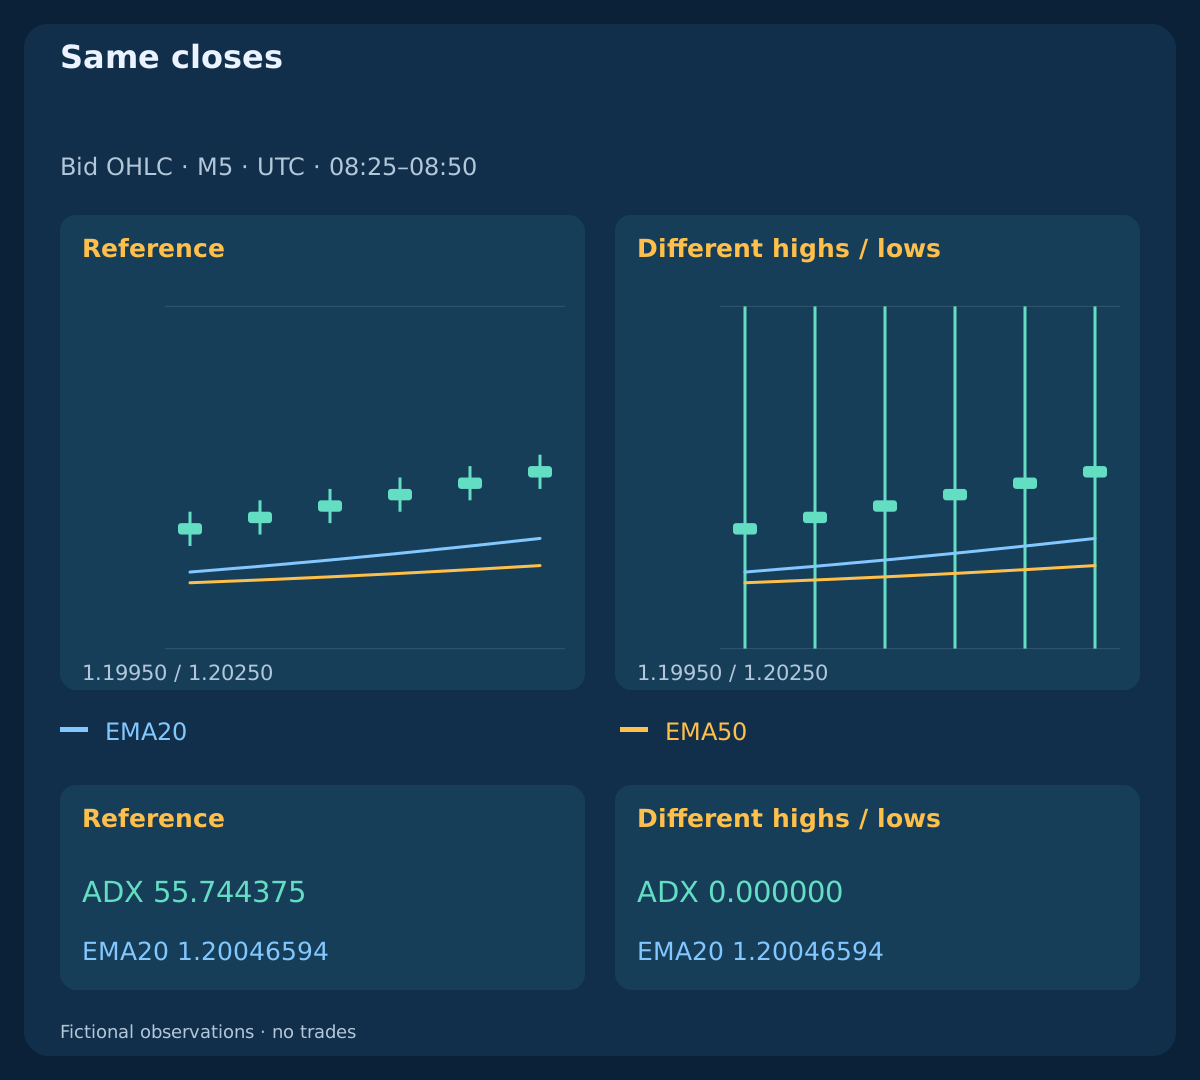
EMA and ADX transform the same price feed, although they use different properties. A second indicator is not automatically an independent vote or a multiplication of success probabilities. Our same_closes history preserves every close and both EMA series but holds High=1.20250; Low=1.19950 constant. The high/low changes then give zero DM and valid ADX=0 despite a positive EMA context.
This counterexample changes the high/low inputs; it does not show two correct implementations disagreeing on identical OHLC. It demonstrates why closing-price context and directional-movement strength need not coincide. Test whether adding the strength condition improves a complete model on unseen data after costs. Visual agreement, a high indicator number or a more selective chart cannot establish that contribution.
8. Compare three declared strength policies
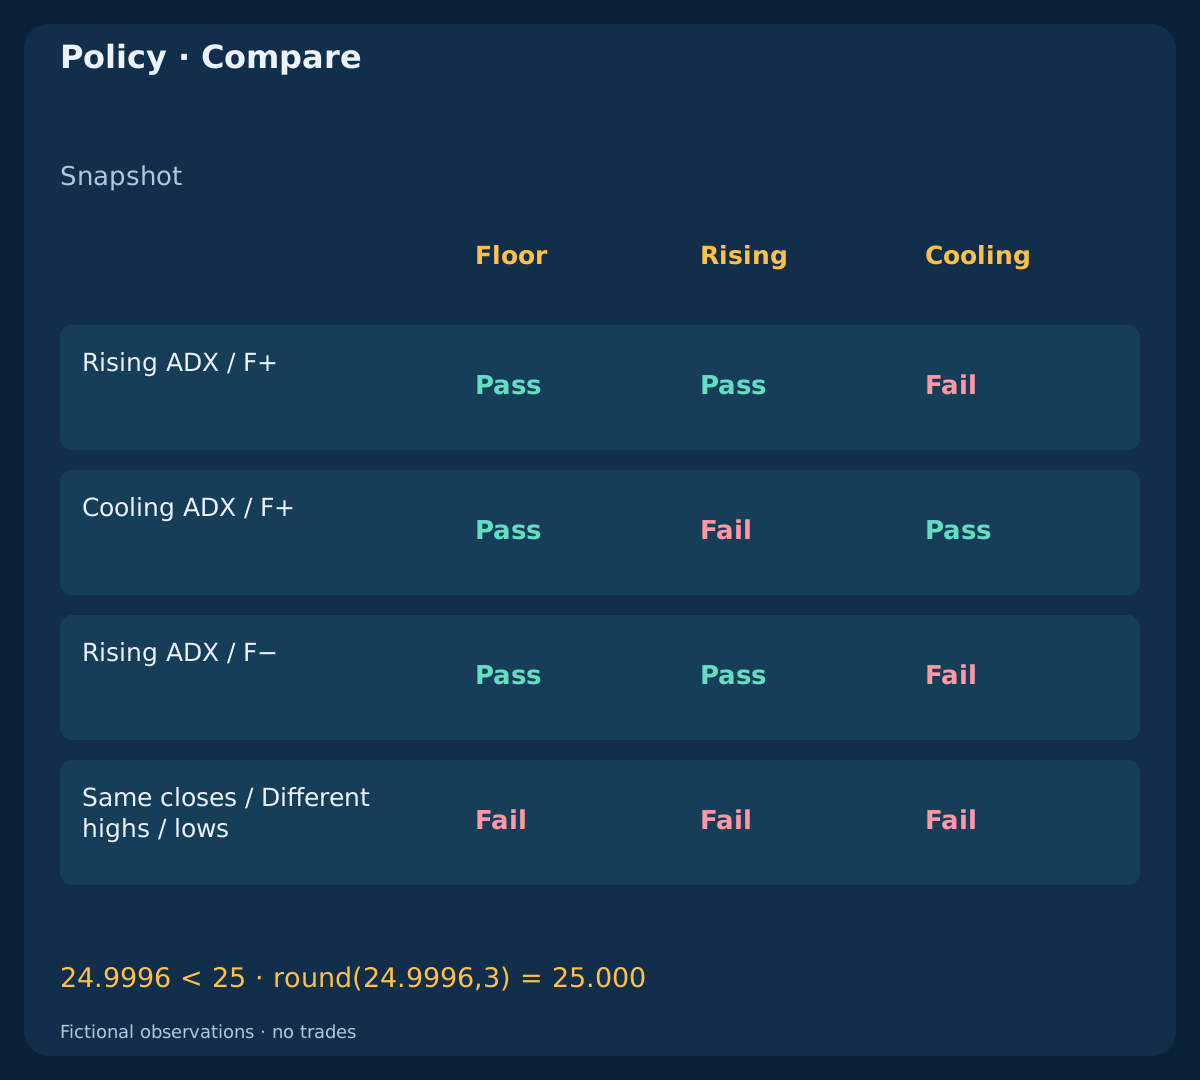
For illustration, compare Floor: ADX>=25; Rising: ADX>=25 AND delta_ADX>0; Cooling: ADX>=25 AND delta_ADX<0. The floor is inclusive; slope comparisons are strict, so equality satisfies neither slope policy. These are diagnostic filters, not complete trading systems or universal thresholds. The cooling policy here is not the full cooling-and-pullback contract of the companion strategy.
The rising upward and downward snapshots both pass Floor and Rising; the cooling upward snapshot passes Floor and Cooling; the changed-wick snapshot passes none. That grid describes chosen examples, not win rates or market frequencies. A separate arithmetic boundary uses 24.9996 → 25.000 after display rounding: the full value remains below 25. The boundary row is explicitly not an OHLC-derived market observation.
| Observation | Floor | Rising | Cooling |
|---|---|---|---|
| Rising ADX / F+ | Pass | Pass | Fail |
| Cooling ADX / F+ | Pass | Fail | Pass |
| Rising ADX / F− | Pass | Pass | Fail |
| Same closes / Different highs / lows | Fail | Fail | Fail |
9. Do not let later strength revive an old event
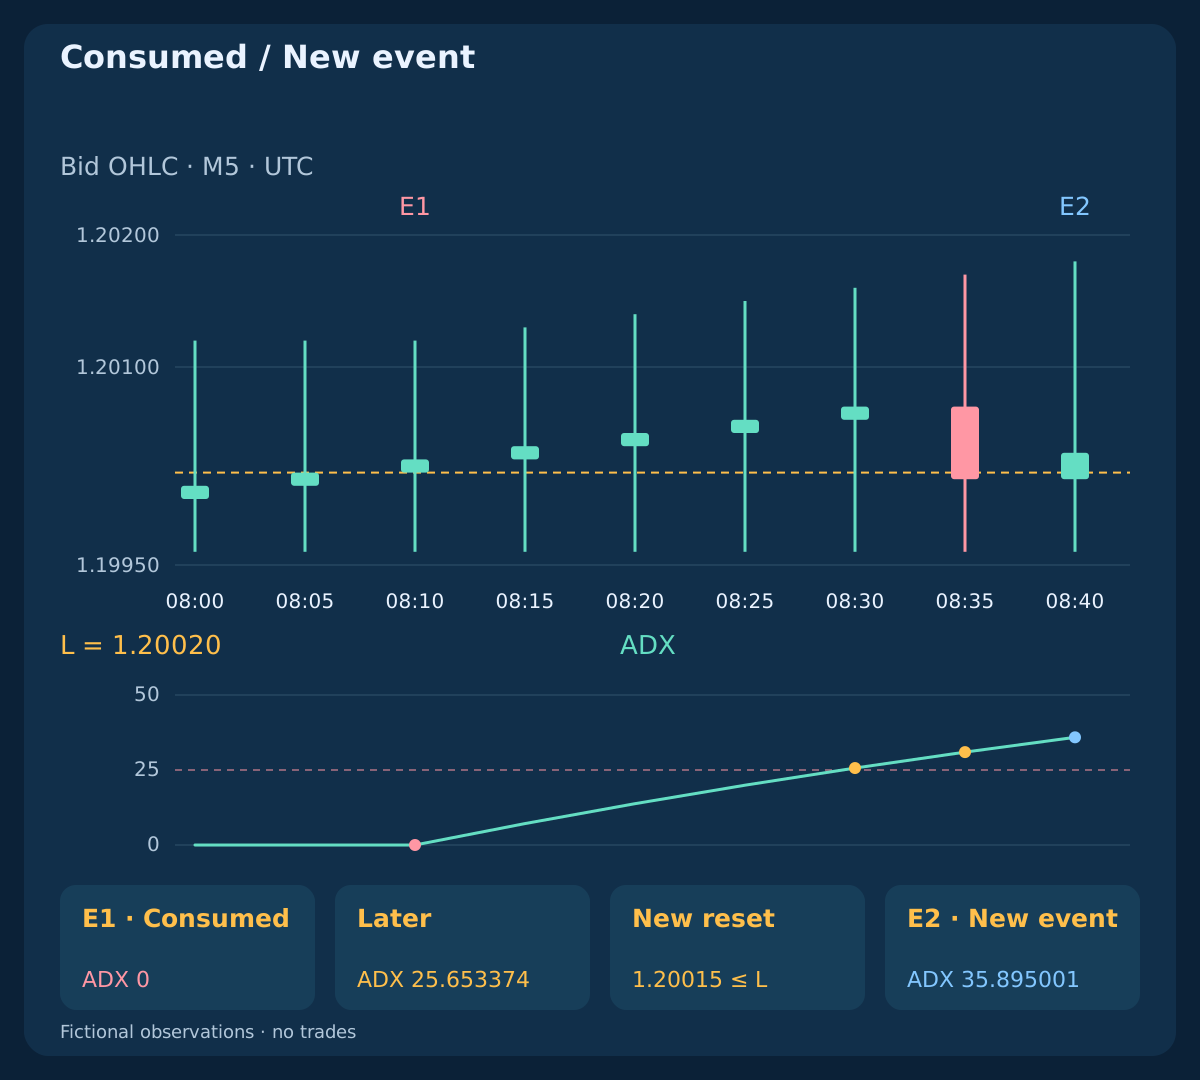
The late_gate lesson fixes L=1.20020 before the sequence and defines a fresh event only when the previous close is at/below L and the new close is strictly above it. At 08:10 / E1, close 1.20030 first crosses, but ADX is zero. The floor test fails and E1 is consumed. At 08:30, ADX reaches 25.653374, but price has remained above L: there is no new event.
At 08:35, close 1.20015<=L resets readiness for a different cross; it does not reopen E1. At 08:40 / E2, close 1.20035 makes its own new crossing with ADX=35.895001. E2 clears the illustrative indicator floor, not an order-approval process. The fixed-level calendar teaches freshness; it omits the protection, execution and exit rules needed for a strategy.
| UTC time | Observation | Close | ADX | Fresh |
|---|---|---|---|---|
| 08:10 | E1 · Earlier | 1.20030 | 0.000000 | Pass |
| 08:30 | E1 · Consumed | 1.20070 | 25.653374 | Fail |
| 08:35 | New reset | 1.20015 | 30.963847 | Fail |
| 08:40 | E2 · New event | 1.20035 | 35.895001 | Pass |
10. Check the price cost of waiting separately
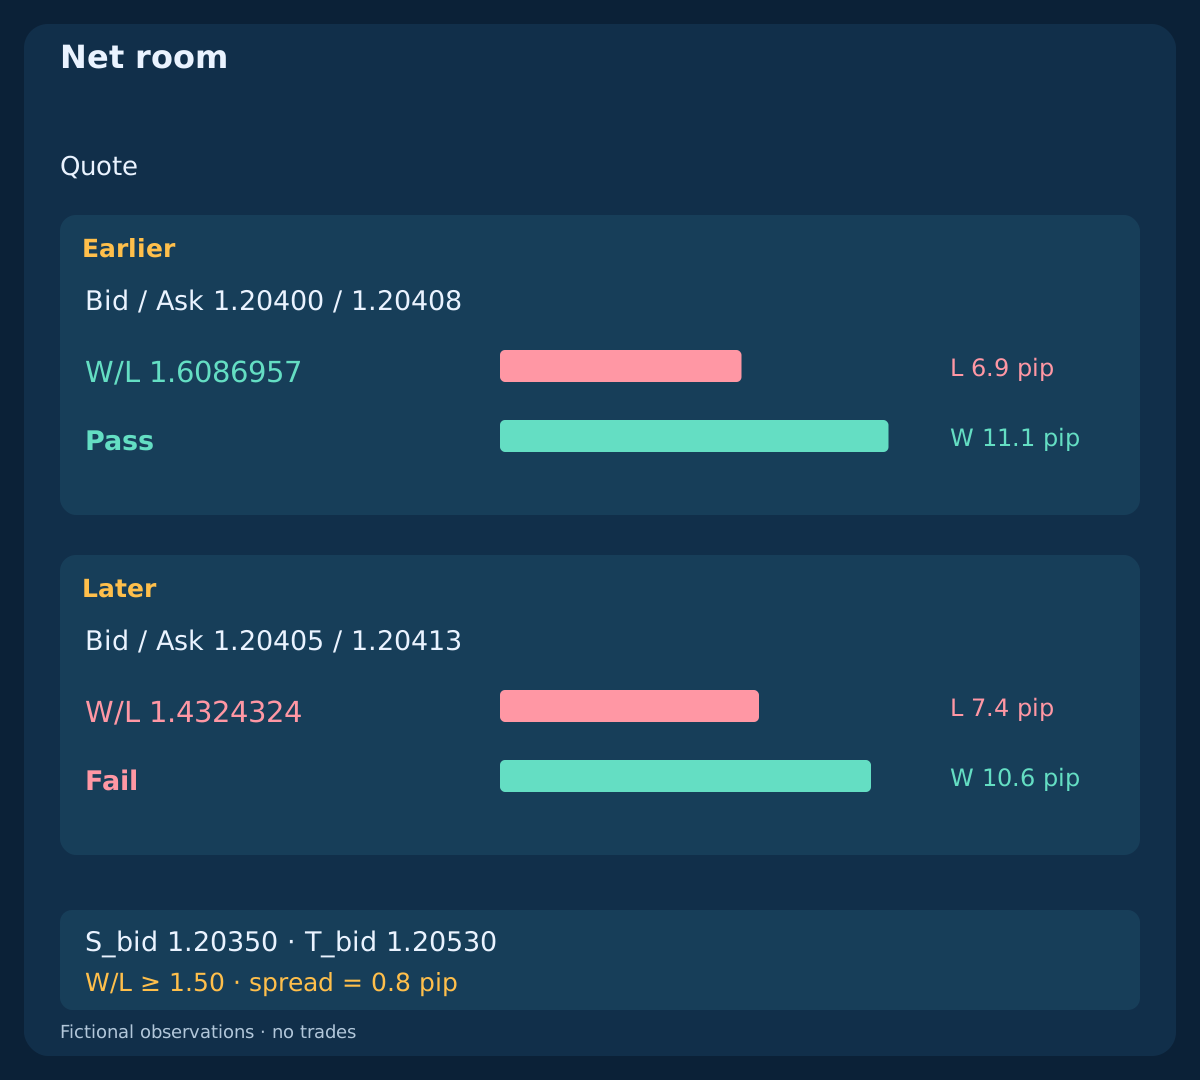
An independent fictional quote comparison assumes EURUSD, a USD account, EUR 100,000 per lot and pip_value=$10/lot; equity=$10,000; plan_budget=$25; lot_min=lot_step=0.01. BUY has fixed Bid stop/target S_bid=1.20350; T_bid=1.20530. At 09:00:00.100 the quote is Bid/Ask=1.20400/1.20408; five seconds later it is 1.20405/1.20413. Both spreads are 0.8 pip.
Plan 0.2 pip adverse entry in F_plan, plus 0.2 pip remaining exit slippage and a linear 0.7-pip round-trip commission, with no minimum or extra charge. Thus F_plan=Ask+0.2 pip; c=0.7+0.2=0.9 pip. Spread is already represented by entry and exit sides. These snapshots are independent of the indicator histories. They are not fills or permission to wait five seconds: a complete strategy's own freshness deadline may already exclude the later quote.
11. Keep net ratio and position size as separate gates
For BUY compute L=(F_plan−S_bid)/pip+c; W=(T_bid−F_plan)/pip−c. Require positive L and W and the illustrative floor W/L>=1.50. The earlier plan gives F_plan=1.20410; L=6.9; W=11.1; W/L=1.6086957. The later plan gives F_plan=1.20415; L=7.4; W=10.6; W/L=1.4324324. An unchanged spread does not preserve net room.
At the $25 planning budget, lots=floor_step(25/(L×10),0.01) gives 0.36 lots earlier, with hypothetical planned loss $24.84 and net target $39.96. A diagnostic 0.33 lots later would plan $24.42 loss, but its ratio still fails; it is not an eligible size. Linear costs make volume cancel from W/L. These are planning amounts, not realised losses/profits or guaranteed caps. Broker restrictions and aggregate exposure still require separate checks.
| Quote | Loss, pips | Reward, pips | Net W/L | Plan lots |
|---|---|---|---|---|
| BUY / Earlier · 1.20400 / 1.20408 | 6.9 | 11.1 | 1.6086957 | 0.36 |
| BUY / Later · 1.20405 / 1.20413 | 7.4 | 10.6 | 1.4324324 | — |
| SELL / Earlier · 1.20400 / 1.20408 | 6.9 | 11.1 | 1.6086957 | 0.36 |
| SELL / Later · 1.20395 / 1.20403 | 7.4 | 10.6 | 1.4324324 | — |
12. Mirror SELL on the executable quote sides
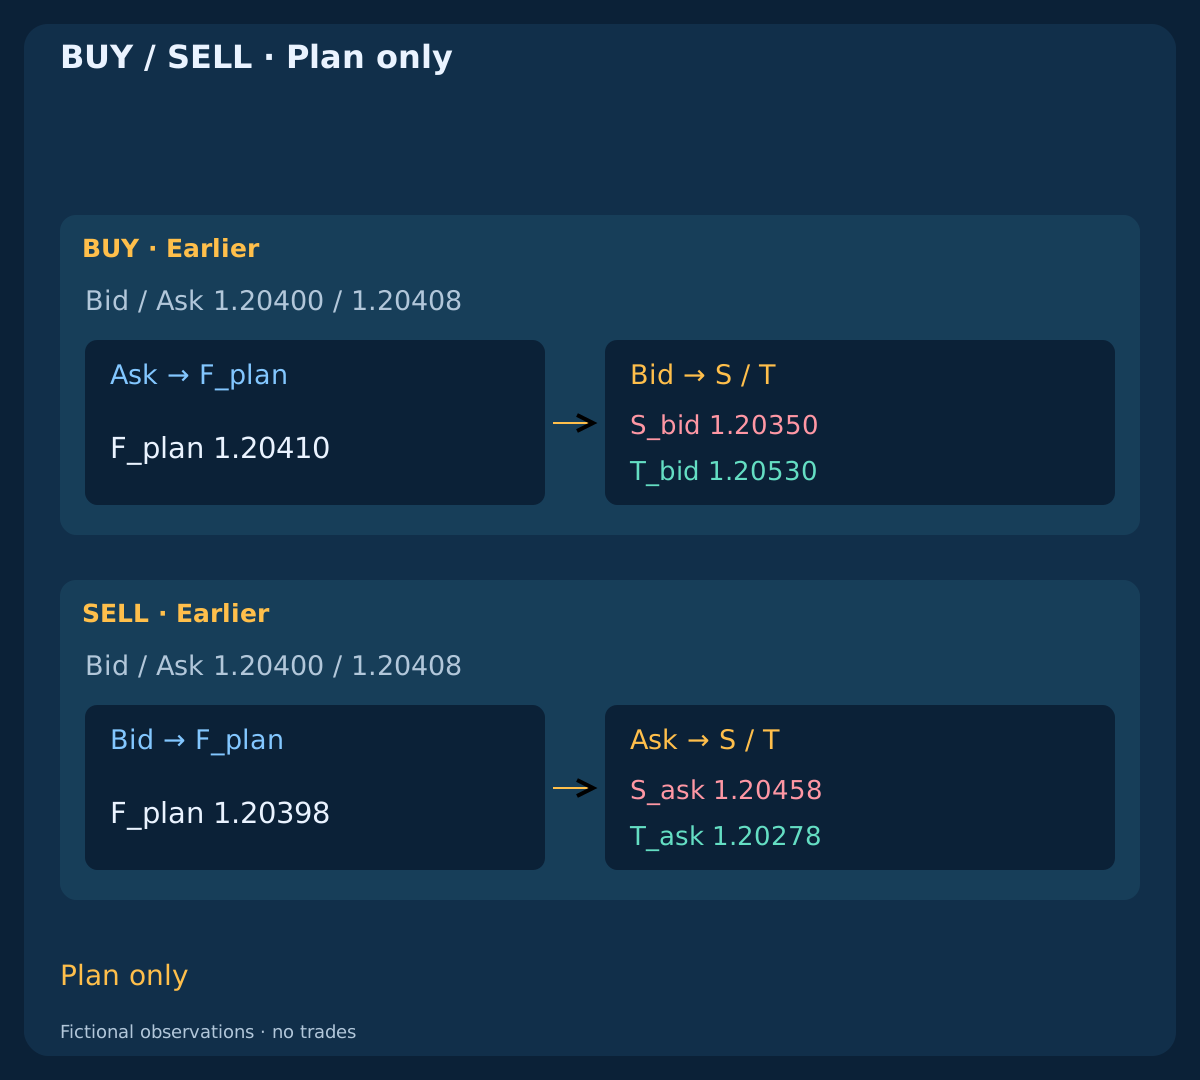
SELL opens against Bid and exits against Ask. The independent SELL plan fixes S_ask=1.20458; T_ask=1.20278. Its earlier quote is again 1.20400/1.20408, but F_plan=Bid−0.2 pip=1.20398. Use L=(S_ask−F_plan)/pip+c; W=(F_plan−T_ask)/pip−c. Indicators based on Bid do not establish whether an Ask exit could be executed.
The later SELL quote is 1.20395/1.20403, with F_plan=1.20393; the same cost deterioration appears. Symmetry was deliberately constructed, not observed in a market. These price-side sketches contain quote plans, not historical Ask candles or realised exits. Use actual paired Ask observations and the broker's contract when studying real trades; a convenient fixed spread cannot reconstruct them.
13. Account for what a delayed filter can miss
A slower strength gate may reject noise, arrive after a useful price event or leave insufficient room at the first admissible quote. Faster settings can change all three, without proving improvement. A price reversal, gap, changing spread or missing quote can defeat an attractive indicator picture. A planning reserve does not guarantee execution or cap loss. Never extend an old event's life merely because its indicator later looks better.
M5 alignment is not a session or news policy. Declare the relevant broker-to-UTC conversion and any blackout, spread-recovery and fresh-signal rules separately. Preserve consumed events through entry holds. Count missed candidates, rejected quotes and unknown outcomes as well as executed trades in real research. The guide's observations alone define none of that complete operational behaviour.
14. Test each added filter on a common calendar
For a real comparison, declare raw price candidates independently of the ADX policy. Compare EMA context alone, then Floor, Rising and Cooling on the same scheduled data, cost assumptions, risk budget and candidate calendar. Preserve rejected events; do not rebuild a more convenient event after a filter fails. Compare timing and costs as well as subsequent outcomes, using proper Bid/Ask execution data.
Freeze smoothing, seeds, thresholds and reset definitions before testing unseen chronological periods. Avoid selecting a threshold from the same examples used to present it. The diagram's policy grid reports only the constructed observations, with no P&L. Our four histories and nine diagnostic rows cannot establish which policy is profitable, robust or suitable for live use. The stricter-looking option is not automatically the better one.
15. Reproduce the three teaching files
The files contain 408 closed bars; 9 diagnostic rows; 4 independent quote plans; 0 orders. Four invented Bid histories include complete warm-up; eight rows refer to closed-bar observations and one is the separate rounding boundary. The late-gate markers distinguish E1, a stale recheck, a reset and new E2. No actual fill or realised P&L is present. The quote plans include no financing or additional fee.
Independently recompute EMA, TR, DM, smoothed means, DI, DX and ADX. Check ties, valid zero DX versus unavailable denominators, level and slope equality, identical closes with different wicks, and the event's own reset. Recompute proper-side costs and downward lot rounding without treating diagnostic volume as traded volume. Actual research needs reliable input history, timestamped implementation checks, unseen periods and execution records; these files demonstrate mechanics only.
Download fictional M5 inputs (CSV)
16. Use a concise reading and testing checklist
Verify the feed, timeframe, completed interval, price input, seed and buffer line. State the EMA context and whether ADX policy uses its level, change or both. Inspect price separately. Identify the fresh event, its lifetime and reset before evaluating a filter. If the event failed, retain that decision; later strength requires a genuinely new event under the original rules.
At any real decision, inspect current proper-side prices, net room and a valid risk budget under a separately complete strategy. Log the observations and rejections so another reader can reconstruct the sequence. EMA context, ADX strength and timely execution are distinct questions. Answering them clearly makes a hypothesis testable; agreement alone does not establish an edge or supply live trading settings.
Frequently asked questions
Does falling ADX mean SELL?
No. ADX has no direction sign. A decline describes reduced smoothed directional imbalance; the price/EMA or DI relationship must be read separately, under a declared model.
Is ADX 25 a universal scalping threshold?
No. It is an illustrative floor here. Timeframe, smoothing, history and market conditions affect the interpretation; the examples do not validate a profitable threshold.
Can later ADX strength rescue E1?
No. E1 remains consumed. In the lesson, a later close at/below the fixed level resets readiness and a separate new crossing creates E2. That is a new event, not an E1 retry.
Are EMA and ADX independent confirmations?
Not automatically. They transform overlapping price information. The changed-wick example gives identical EMAs but different ADX; incremental value still needs a controlled test of the complete model.
Does reducing the lot repair a late entry's ratio?
No. With the stated linear costs, size changes cash exposure but not W/L. The later quote is rejected by its cost floor even though a smaller diagnostic size fits the cash budget.
Are the CSVs verified trading results?
No. They are invented indicator observations and quote plans, with zero orders, no actual fills and no realised P&L. They establish neither win rate nor expected return.
Sources and research notes
Official references explain moving averages, ADX buffers and directional-movement calculations. The finite seeds, contexts, threshold comparisons, event calendar and cost plans below are declared teaching assumptions, not vendor recommendations or validated live settings.
- MetaTrader 4: moving average definitions
- MQL4: ADX and DI buffers, applied price and shift
- TradingView: directional movement and ADX calculations
Educational guide. Invented observations and cost plans; no orders, actual fills or measured trading performance.