

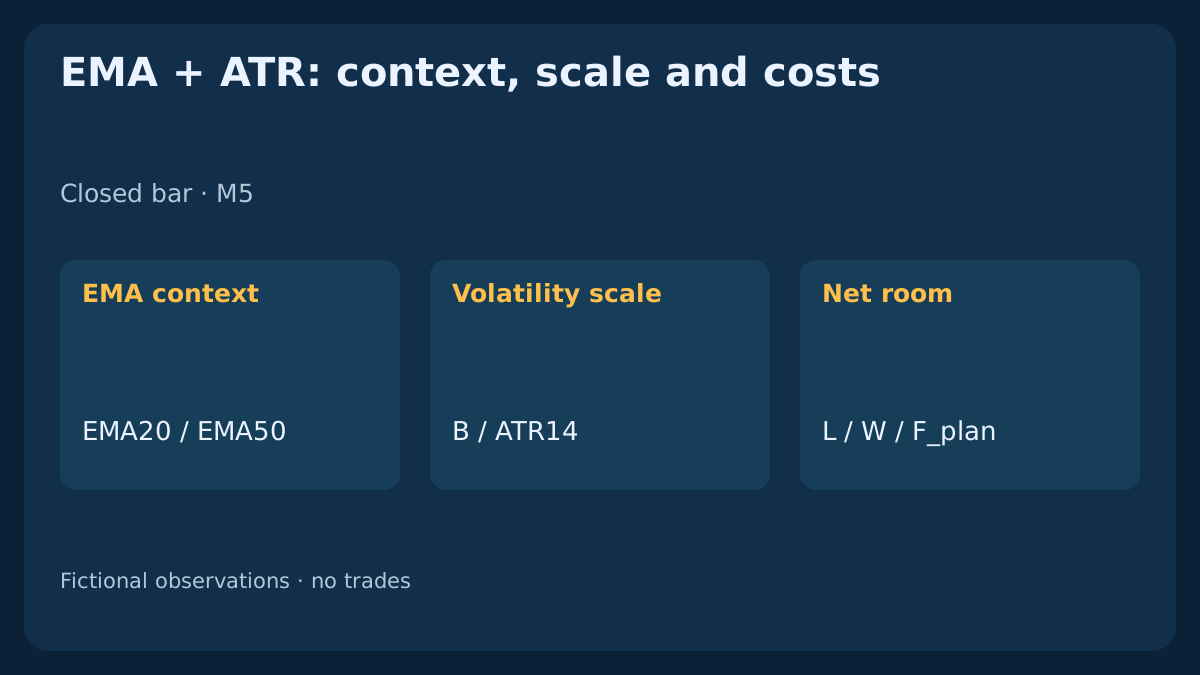
An EMA context can persist while volatility changes, and a rising ATR can arrive after much of a price move. Neither tells you whether the next quote leaves enough net room. This guide separates price context, the scale of recent ranges and the cost of acting later. Fictional M5 histories and independent quote plans make each comparison reproducible; they do not demonstrate trading performance.
1. Separate context, range scale and executable room
EMA asks how selected price averages relate. ATR asks how large recent true ranges have been under a stated averaging method. Net room asks what remains between a current proper-side entry plan and already chosen exits, after costs. None supplies the other two. A visually quiet chart may have little room relative to spread, while an expanding chart may already require a much worse entry price.
This is an explanatory guide, not another complete entry strategy. It complements the general ATR and EMA/ADX/ATR guides, the scalping exit comparison and the existing EMA/ATR quiet-reset strategy. That strategy has its own six-bar arming and first-candidate rules; the comparisons here do not replace them. All histories and plans are invented, with zero orders and no realised results.
2. Give EMA a limited, explicit context role
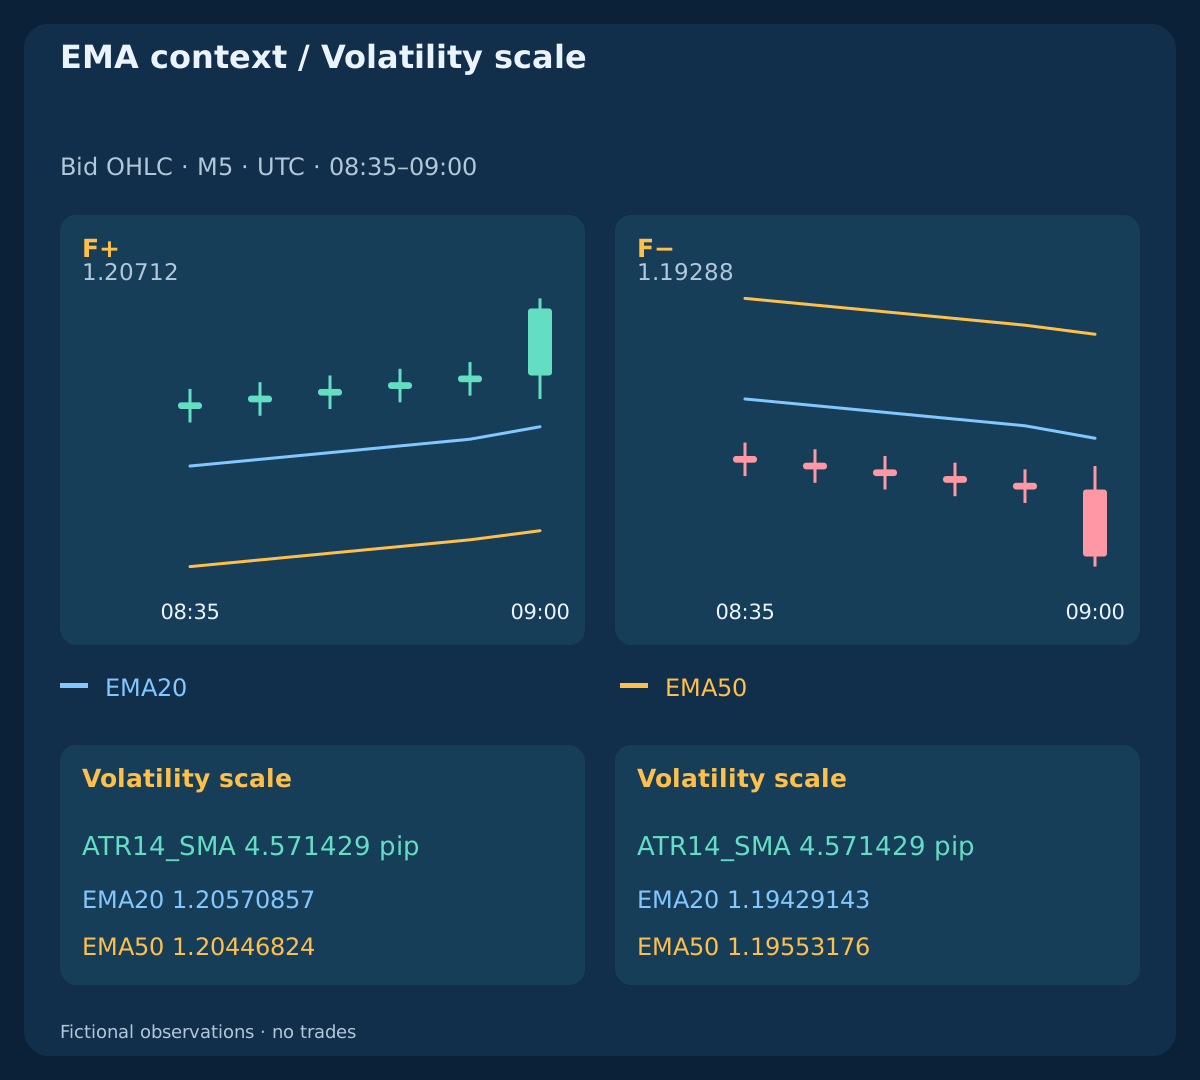
Use Close-based EMA20/50 on scheduled M5 Bid bars. Seed each period n from its first n closes, then apply EMA_n(k)=[2×Close(k)+(n−1)×EMA_n(k−1)]/(n+1). The first values occur at k19 and k49. Define F+=[EMA20>EMA50 AND EMA50(k)>EMA50(k−3)]; F−=[EMA20<EMA50 AND EMA50(k)<EMA50(k−3)]. Equality belongs to neither context.
The labels describe relationships, not orders. At 09:00 UTC, the up and mirrored-down histories have opposite contexts but the same TR=12 pip; ATR14_SMA=4.571429 pip. ATR cannot supply a direction sign. Keep the symbol, feed, side, price input, timeframe and seed together. These finite reference values are not assumed to match a native terminal without an implementation check.
3. Read true range before interpreting ATR
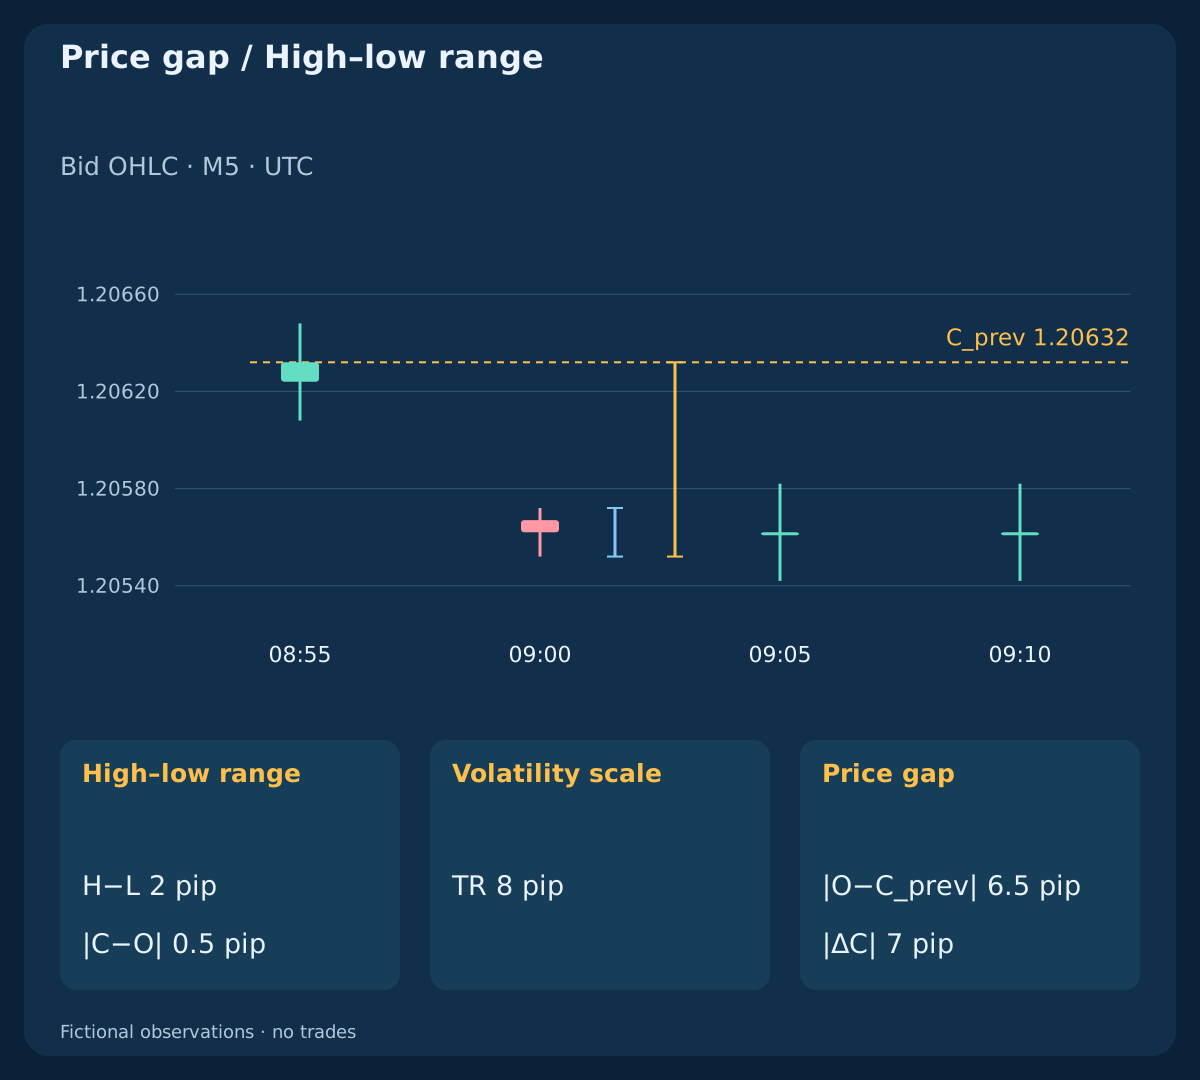
For each bar with a previous close use TR=max(High−Low,abs(High−PreviousClose),abs(Low−PreviousClose)). The high-low span, candle body and close-to-close change are different measurements. In our gap-down example, PreviousClose=1.20632; Open=1.20567; High=1.20572; Low=1.20552; Close=1.20562.
That bar has High−Low=2 pip; abs(Close−Open)=0.5 pip; abs(Close−PreviousClose)=7 pip; TR=8 pip. The gap contributes even though the current candle is narrow. Neither the size of TR nor the resulting ATR tells you whether continuation is likely. The fictional EURUSD convention is pip=0.0001; point=tick=0.00001; all OHLC inputs align to that tick.
4. Name the averaging method and its starting point
This guide uses ATR14_SMA(k)=mean(TR(k−13),…,TR(k)), first available at k14 from TR1–TR14. The first bar has no previous close, so its TR is unavailable. We also compare a separately labelled Wilder mean, with the same initial fourteen-range average and then ATR14_W(k)=[13×ATR14_W(k−1)+TR(k)]/14. Retain full values before display rounding.
Different smoothing and initial histories produce different readings; specify them before comparing implementations. MT4 iATR's final shift selects a historical buffer value, with shift 0 referring to the forming bar. It is not the chart-line displacement ma_shift of a moving average. Read EMA and ATR from the same completed interval and preserve its timestamps. A valid zero ATR is different from missing warm-up, but neither is a usable denominator for a range or distance ratio.
5. Do not call a quiet chart cheap to trade
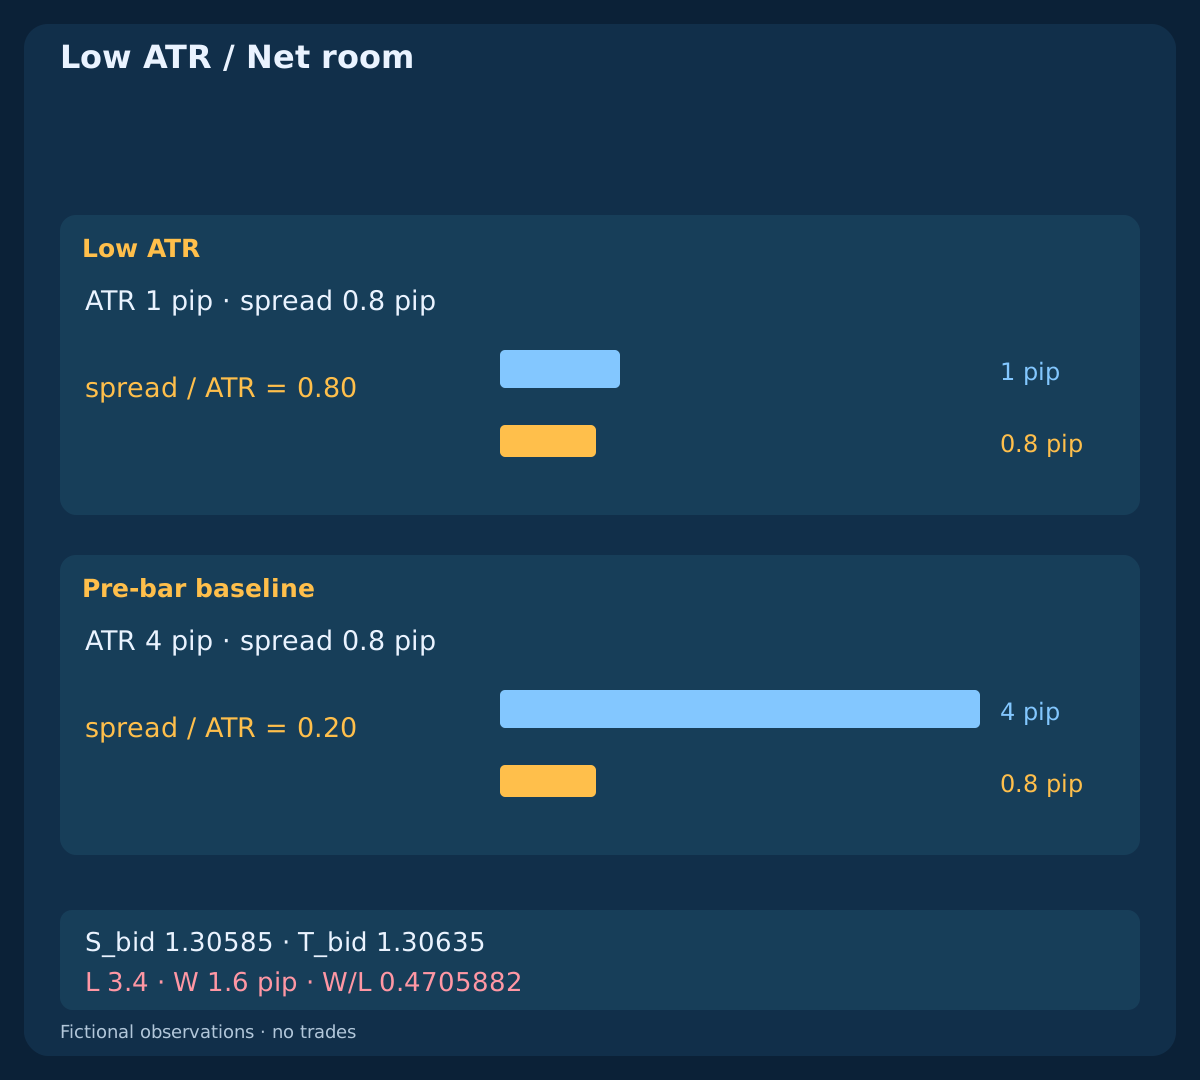
Our quiet history is a tick-aligned quarter-scale alternative to the up history, not an observed market sample. Before the expansion its ATR is 1 pip, against 4 pip in the reference. Holding an independent illustrative spread at 0.8 pip gives spread/ATR=0.80 versus 0.20. A smaller price scale increases the relative burden of the same spread.
Those fractions are diagnostics, not probabilities or a complete transaction-cost model. ATR alone does not measure liquidity, fill quality, quote age or future slippage. A separate quiet exit plan below has L=3.4 pip; W=1.6 pip; W/L=0.4705882 after its stated costs. Scaling exits down need not preserve a workable net ratio; broker distance and size restrictions may create additional constraints.
| Observation | UTC time | Context | ATR, pips | Spread, pips |
|---|---|---|---|---|
| Pre-bar baseline / F+ | 08:55 | F+ | 4.000000 | 0.8 |
| Pre-bar baseline / F− | 08:55 | F− | 4.000000 | 0.8 |
| Low ATR | 08:55 | F+ | 1.000000 | 0.8 |
| Different highs / lows | 08:55 | F+ | 10.800000 | 0.8 |
6. Separate one expanding bar from the moving average
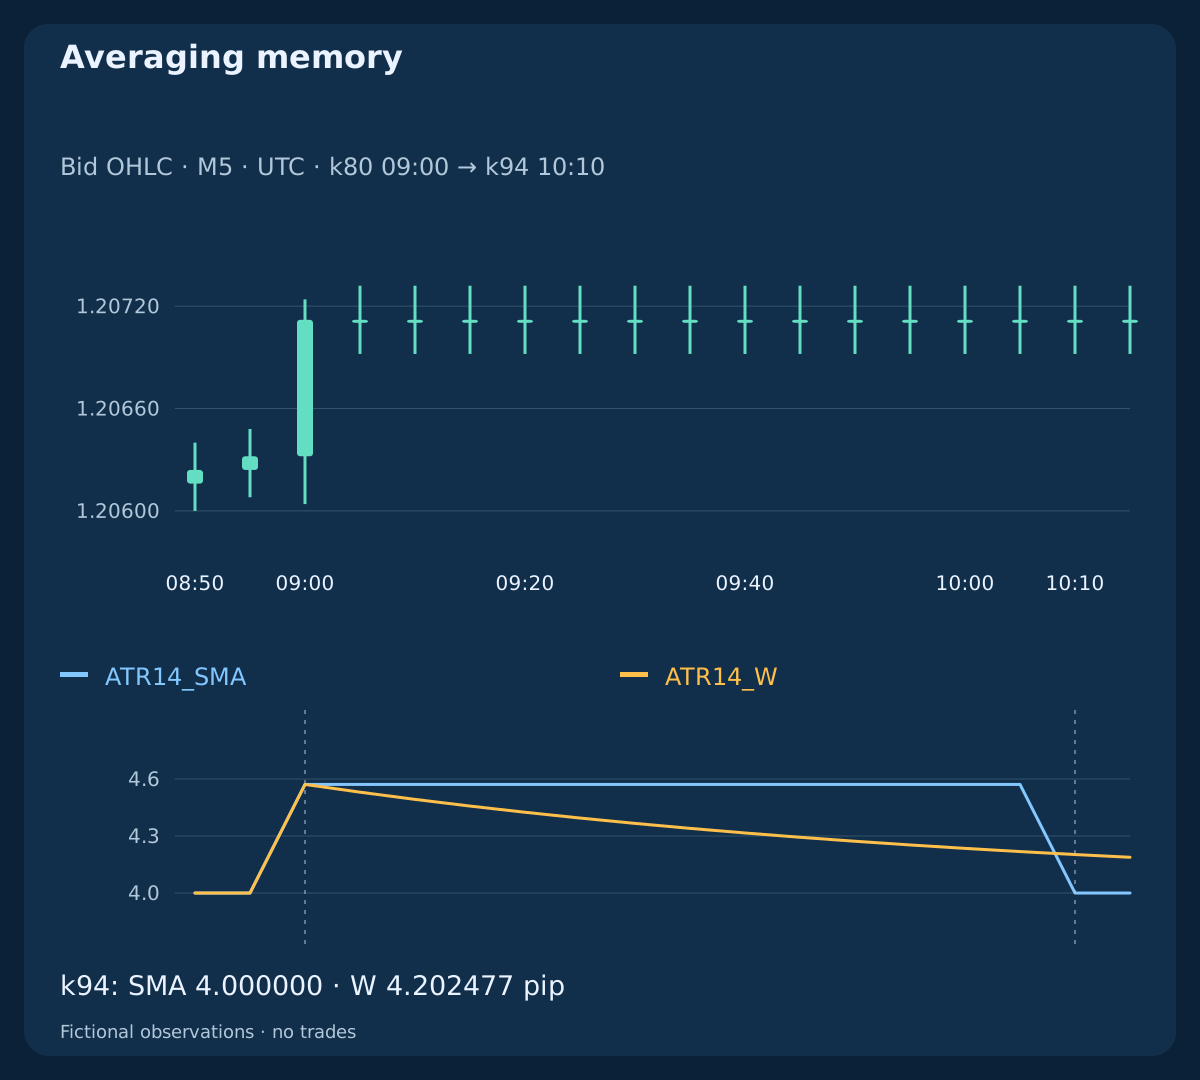
In the reference history, fourteen preceding true ranges are 4 pip. The bar closing at 09:00 UTC has TR=12 pip, but its new mean is only ATR14_SMA=ATR14_W=32/7=4.571429 pip. An average responds to the observation; it is not the latest candle's range or an independent confirmation of it.
Subsequent ranges return to 4 pip. At 10:10 UTC / k94, the large k80 observation leaves the fourteen-bar SMA window, so SMA returns to 4.000000 pip; the Wilder mean remains 4.202477 pip. This difference comes from the averaging memory, not different latest prices. An ATR decline can therefore reflect an old outlier leaving the window, rather than a newly quieter current bar.
7. Freeze the denominator when the question is expansion
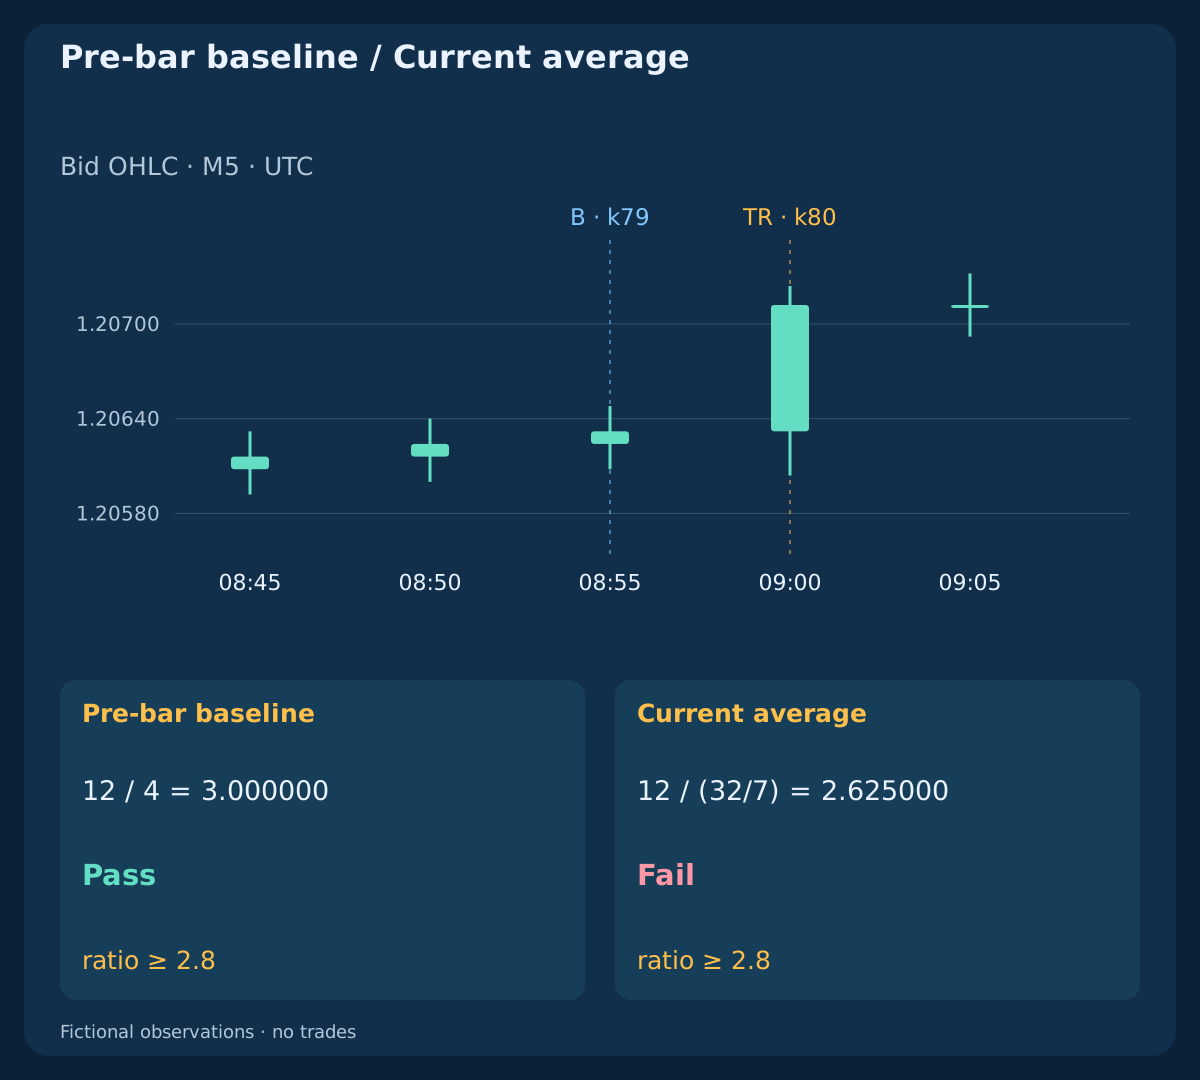
To ask how unusual the new range is relative to the preceding scale, declare B=ATR14_SMA(k79)=4 pip before k80. Then TR80/B=12/4=3.000000. If instead you divide by the mean already containing that range, you obtain TR80/ATR14_SMA(k80)=12/(32/7)=2.625000. Both calculations are valid, but they answer different questions.
An illustrative inclusive floor ratio>=2.8 accepts the frozen-baseline observation and rejects the current-denominator observation. This is a controlled diagnostic, not an entry threshold recommendation or an order. Do not silently change denominators while presenting one test. A separate strategy may deliberately use current ATR, but must declare and test that choice consistently; later expansion cannot revive an already consumed candidate.
| Observation | TR, pips | B, pips | TR / B | TR / ATR14_SMA |
|---|---|---|---|---|
| Range expansion / F+ | 12.000000 | 4.000000 | 3.000000 | 2.625000 |
| Range expansion / F− | 12.000000 | 4.000000 | 3.000000 | 2.625000 |
| Different highs / lows | 18.000000 | 10.800000 | 1.666667 | 1.590909 |
| Price gap | 8.000000 | 4.000000 | 2.000000 | 1.866667 |
8. Do not treat agreement as independent evidence
The wide-wick history preserves every close and both EMA series but changes highs and lows. At the expansion close, reference and wide-wick ATR values are 4.571429 versus 11.314286 pip, with the same EMA context. Their pre-bar baselines are 4.0 versus 10.8 pip. The wider absolute range is not automatically the larger expansion relative to its own history.
This changes the OHLC inputs; it does not show correct implementations disagreeing on identical data. EMA and ATR transform overlapping information from a feed. An extra indicator is not automatically an independent vote or a multiplication of success probabilities. Whether its scale filter adds value requires a controlled test of a complete model on unseen data, after realistic costs.
9. Notice apparent improvement from moving references
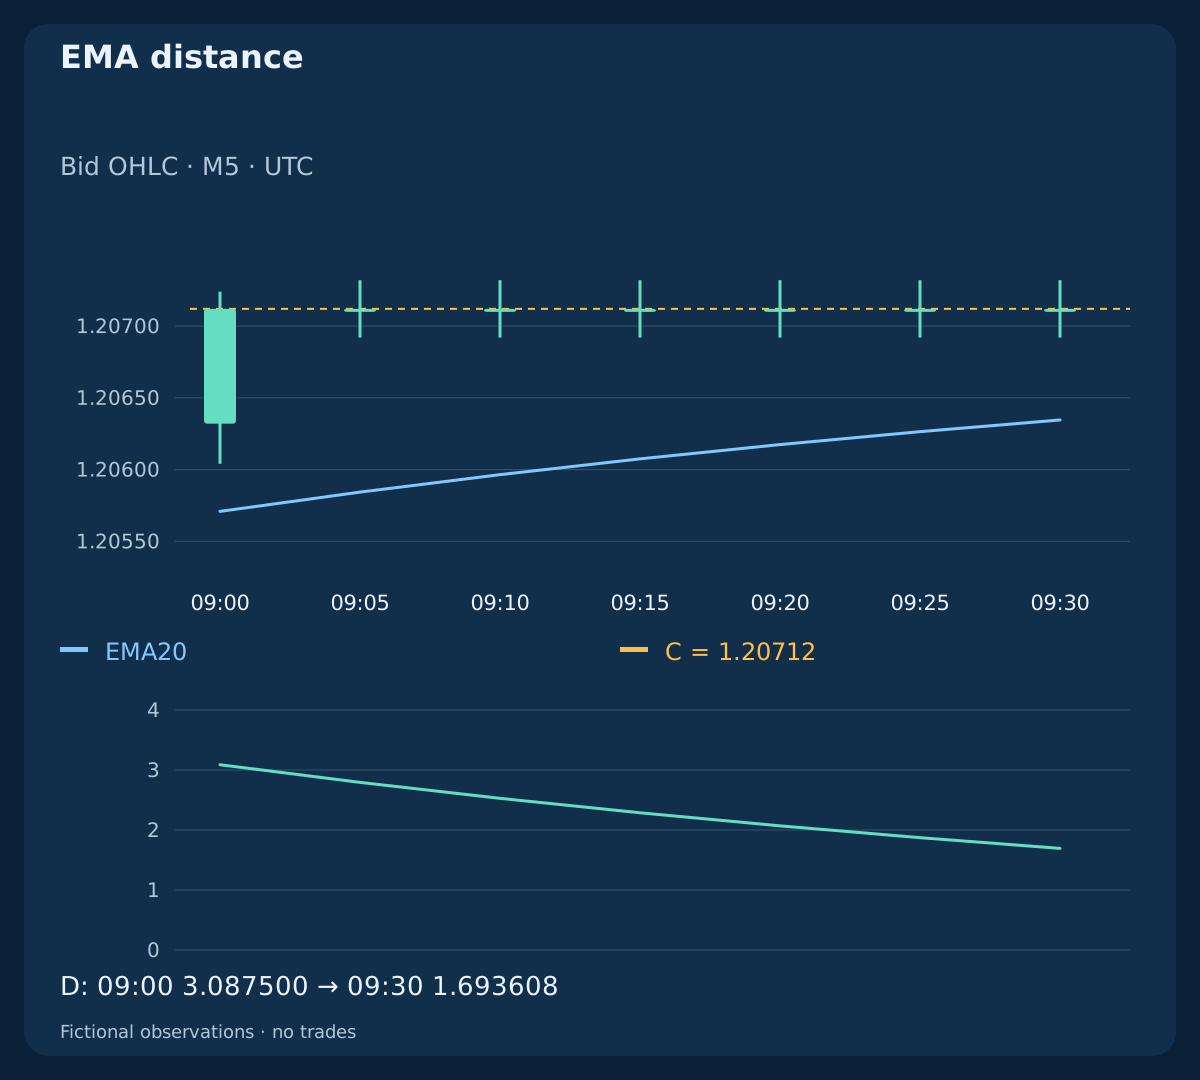
Define a diagnostic distance D(k)=abs(Close(k)−EMA20(k))/ATR14_SMA(k). In the up history the close remains 1.20712 from 09:00 through 09:30 UTC. Yet D falls 3.087500 → 1.693608 as EMA catches up. ATR still contains the expansion. The quote has not become cheaper merely because the displayed normalized distance is smaller.
This is a completed-close comparison, not a stream of executable quotes. Always inspect the numerator and denominator as well as the ratio. A new reading is not automatically a fresh price event, and a nearer EMA does not restore a failed or expired setup. A real strategy must define its event lifetime and reset independently; the guide does not turn waiting for a better-looking ratio into permission to enter.
| UTC time | Close | EMA20 | ATR, pips | Distance / ATR |
|---|---|---|---|---|
| 09:00 | 1.20712 | 1.20570857 | 4.571429 | 3.087500 |
| 09:05 | 1.20712 | 1.20584299 | 4.571429 | 2.793452 |
| 09:30 | 1.20712 | 1.20634578 | 4.571429 | 1.693608 |
| 10:10 | 1.20712 | 1.20677235 | 4.000000 | 0.869119 |
10. Price an independent plan before considering lateness
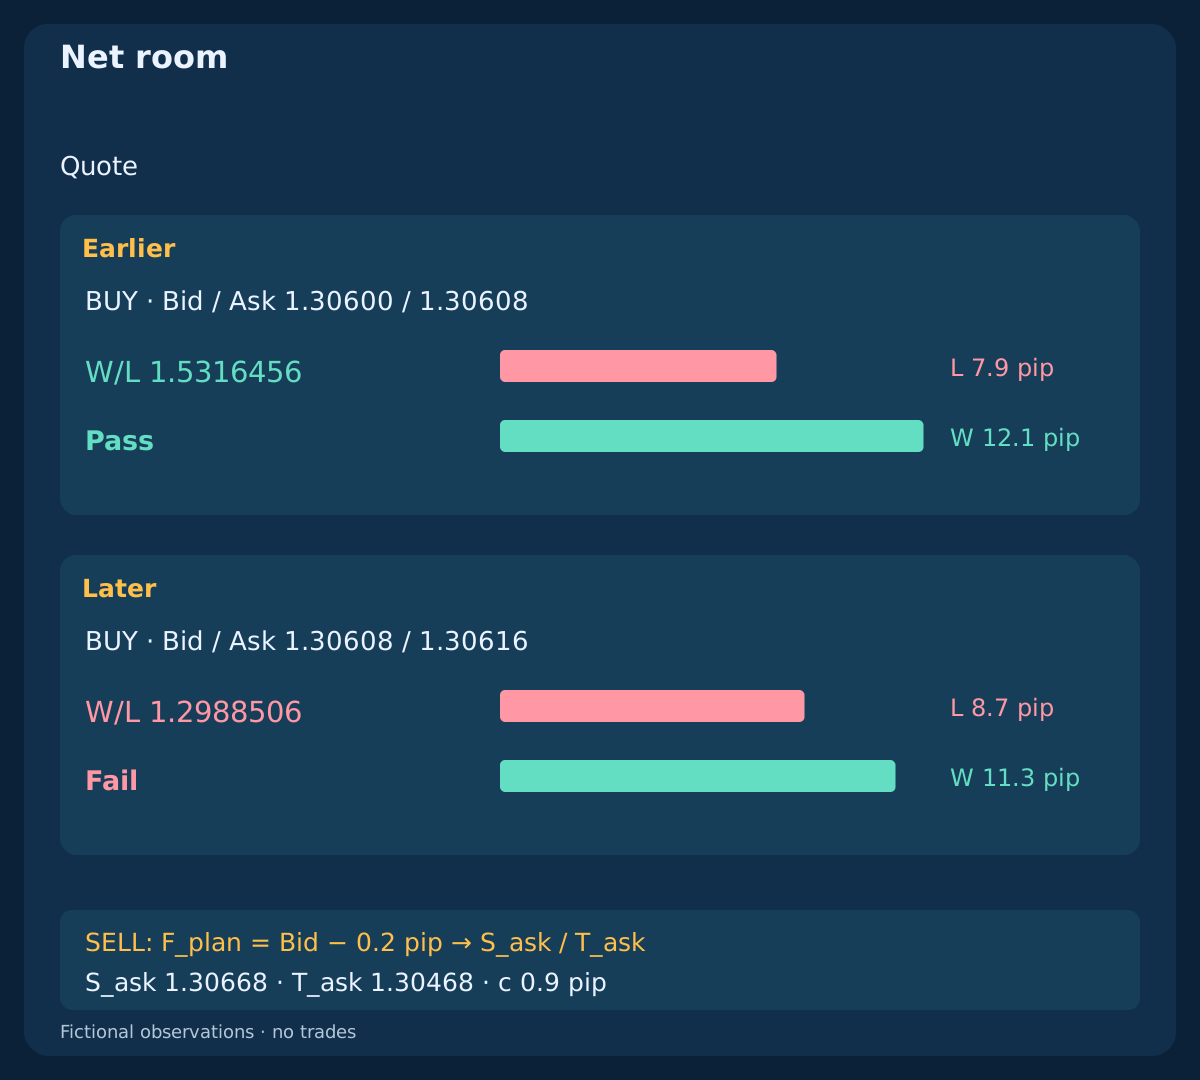
The cost lesson assumes EURUSD, a USD account, EUR 100,000 per lot and pip_value=$10/lot; equity=$12,500; plan_budget=$31.25; lot_min=lot_step=0.01. Before comparing quotes, choose an illustrative scale and anchor B=4 pip; Bid_anchor=1.30600; S_bid=1.30540; T_bid=1.30740, representing 1.5B stop distance; 3.5B target distance from that anchor. These are planning assumptions, not live settings.
At 10:00:00.100 UTC the BUY quote is Bid/Ask=1.30600/1.30608; three seconds later it is 1.30608/1.30616. Both spreads are 0.8 pip. Put adverse entry allowance in F_plan=Ask+0.2 pip, then reserve only remaining exit slippage and linear round-trip commission: c=0.3+0.6=0.9 pip. There are no minimum or additional fees or financing. These quotes are independent of the indicator histories and do not permit waiting three seconds; a complete strategy's deadline could already exclude the later quote.
11. Keep net ratio distinct from cash size
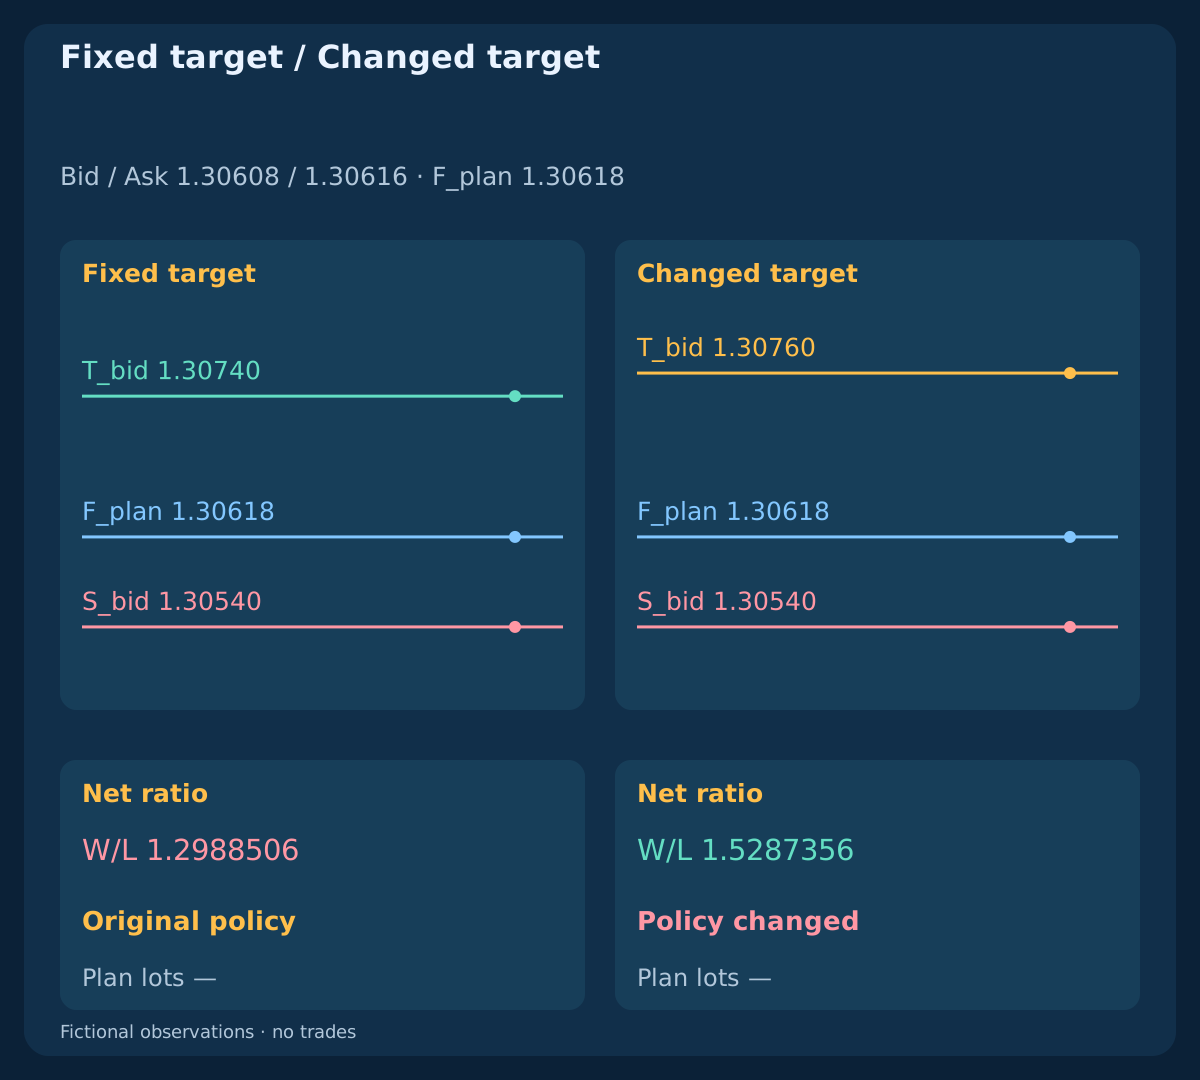
For BUY use L=(F_plan−S_bid)/pip+c; W=(T_bid−F_plan)/pip−c. Require L and W positive and the illustrative floor W/L>=1.50. The earlier plan gives F_plan=1.30610; L=7.9; W=12.1; W/L=1.5316456. The later plan gives F_plan=1.30618; L=8.7; W=11.3; W/L=1.2988506. Unchanged spread does not preserve net room to the fixed exits.
The illustrative budget is $12,500×0.25%=$31.25. Downward step rounding lots=floor_step(31.25/(L×10),0.01) gives 0.39 lot; planned_loss=$30.81; net_target=$47.19 earlier. The later diagnostic size is 0.35 lot; planned_loss=$30.45, but it is not eligible under the ratio floor. With linear costs, smaller size changes money exposed, not W/L. Planned amounts are neither realised results nor guaranteed loss caps; broker restrictions and aggregate exposure require separate checks.
| Quote | Loss, pips | Reward, pips | Net W/L | Plan lots | Policy |
|---|---|---|---|---|---|
| BUY / Earlier · 1.30600 / 1.30608 | 7.9 | 12.1 | 1.5316456 | 0.39 | Original policy |
| BUY / Later · 1.30608 / 1.30616 | 8.7 | 11.3 | 1.2988506 | — | Original policy |
| SELL / Earlier · 1.30600 / 1.30608 | 7.9 | 12.1 | 1.5316456 | 0.39 | Original policy |
| SELL / Later · 1.30592 / 1.30600 | 8.7 | 11.3 | 1.2988506 | — | Original policy |
| BUY / Low ATR · 1.30600 / 1.30608 | 3.4 | 1.6 | 0.4705882 | — | Original policy |
| BUY / Changed target · 1.30608 / 1.30616 | 8.7 | 13.3 | 1.5287356 | — | Policy changed |
12. Mirror SELL on the correct quote sides
SELL enters against Bid and exits against Ask. The independent mirrored plan uses S_ask=1.30668; T_ask=1.30468; F_plan=Bid−0.2 pip. At the earlier Bid/Ask=1.30600/1.30608, its planning fill is 1.30598. Compute L=(S_ask−F_plan)/pip+c; W=(F_plan−T_ask)/pip−c. Spread is represented by the proper entry and exit sides, not added again as a separate fee.
The later SELL quote is Bid/Ask=1.30592/1.30600; F_plan=1.30590, producing the same net deterioration as BUY. This symmetry is constructed, not a market result. Bid indicator candles do not prove an Ask exit was available; the guide shows no historical Ask execution path. Real execution research needs paired observed quotes and the broker's contract. All plan fills remain hypothetical, with no actual execution or P&L.
13. Do not repair a late quote by rewriting the target
The original later BUY plan keeps S_bid=1.30540; T_bid=1.30740. A counterfactual borrows the separate lesson's expanded scale 32/7 pip and moves only the target to T_new=1.30600+3.5×(32/7)×0.0001=1.30760. At the unchanged later entry, it now reports L=8.7; W=13.3; W/L=1.5287356. This target scale is an assumed comparison, not an observed ATR attached to these quotes.
The arithmetic clears the ratio floor because the target was moved farther away. It does not repair the predeclared fixed-target plan or demonstrate that the farther target is reachable. The changed-policy CSV row has no eligible plan volume despite passing that mathematical gate. An adaptive-target model could be tested separately if defined in advance, with its own exits and outcomes on a common candidate calendar. Do not present its counterfactual result as the old plan becoming valid.
14. Keep market regimes and operational limits explicit
Quiet, expansion and elevated average volatility are descriptions under chosen windows, not universal market regimes or a forecast. ATR cannot establish good liquidity, a safe news period or a maximum future excursion. Gaps, reversals, variable spread and missing quotes can defeat an attractive EMA/ATR picture. Neither a planning reserve nor a volatility-scaled stop guarantees execution or limits loss.
Declare any session conversion and blackout, spread-recovery and fresh-signal rules separately. Keep consumed candidates consumed through entry holds. Check broker tick size, stop distances, volume limits, total exposure and quote availability. Missing bars, insufficient warm-up and nonpositive ratio denominators must not be silently replaced with convenient zeros. The guide does not specify the complete behaviour of a trading system.
15. Reproduce the files before judging a filter
The files contain 510 closed bars; 9 diagnostic observations; 6 independent quote plans; 0 orders. Each of five fictional Bid histories has complete warm-up. The gap, mirrored, quarter-scale and changed-wick inputs are distinct histories, not alternative fills from one market feed. The cost plans contain no actual fills, realised P&L, financing or other fees.
Recompute EMA, true range, both ATR means, the frozen baseline, distance and proper-side net costs independently. At an illustrative 09:02 UTC, the last scheduled completed M5 interval is 08:55–09:00; 09:00–09:05 is still forming. Confirm actual timestamps and data availability rather than relying only on the clock. Check the rolling-outlier boundary, zero versus unavailable values and downward lot rounding; do not call a diagnostic or changed-policy size traded volume.
Download fictional M5 inputs (CSV)
16. Test one declared question on a common calendar
Before real research, declare raw price candidates independently of the ATR policy. Compare EMA context alone and each scale filter using the same data, scheduled candidate calendar, costs and risk budget. Freeze smoothing, seeds, baseline timing, thresholds and exits before unseen chronological periods. Preserve rejected and expired candidates rather than rebuilding a convenient event after a filter fails.
Measure timing, rejection reasons, execution quality, net outcomes and unknown results with reliable Bid/Ask records. An apparent improvement from a moving denominator or changed target must be separated from a better actual entry. These five histories and six plans demonstrate mechanics, not profitability or an optimal setting. Clear definitions make an EMA/ATR hypothesis testable; indicator agreement alone cannot establish an edge.
Frequently asked questions
Does rising ATR mean BUY?
No. ATR measures true-range scale without a direction sign. Mirrored up and down histories can have identical ATR; a price or EMA context must be read separately.
Is a quiet market cheaper for scalping?
Not necessarily. The same spread and fees can consume more of a smaller price scale. ATR does not measure liquidity or guarantee fills; inspect actual quotes and net room.
Why freeze ATR before comparing an expansion?
It answers how large the new range is relative to the preceding scale. Current ATR already includes that range. Both are valid questions, but the denominator must match the declared test.
Does a smaller distance to EMA create a new entry?
No. EMA can catch up while price stays unchanged. A better-looking distance ratio is not a new event, an executable quote or permission to reuse an expired candidate.
Can a farther ATR target rescue the late quote?
Not under the original fixed-target plan. Moving the target changes the policy and reward assumption. A separately declared adaptive model needs its own test; it does not validate the old plan.
Are these CSVs evidence of profitable trading?
No. They contain invented indicator observations and independent quote plans, with zero orders and no actual fills or realised P&L. They establish no win rate or expected return.
Sources and research notes
Official references explain moving averages, true range, ATR smoothing choices and buffer shifts. The finite seeds, context, illustrative thresholds, frozen comparison window and cost plans below are teaching assumptions, not vendor recommendations or validated live settings.
- MetaTrader 4: moving average definitions
- MetaTrader 4: true range and ATR
- MQL4: iATR and historical buffer shift
- TradingView: ATR smoothing choices
Educational guide. Invented observations and cost plans; zero orders, no actual fills or measured trading performance.