

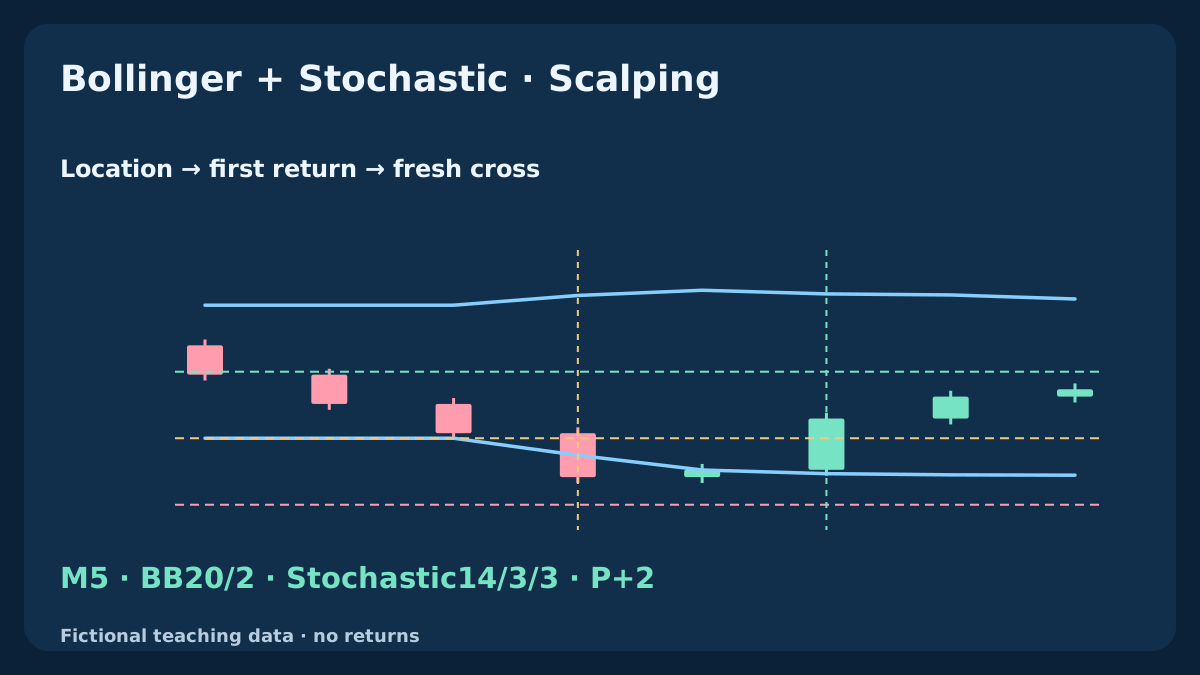
A close back inside a Bollinger Band can look like a reversal even when price is still falling: the band may simply have moved. Adding a Stochastic cross does not remove that timing problem. This guide separates a pre-event range context, an outside close, the first return above a frozen edge and a fresh oscillator event. Five reproducible M5 histories show why a late confirmation cannot repair an earlier rejection.
1. Give band location and oscillator timing separate jobs
Bollinger Bands frame price relative to a moving average and its dispersion. Stochastic places the close within a recent high–low range. Their different formulas do not make them independent evidence: both reuse overlapping prices. A low band reading and a low oscillator can persist together during a continuing decline, so agreement alone does not establish a reversal or an advantage after costs.
The research question is whether a fresh Stochastic cross adds useful selection to a precisely defined return from an outside close. We define a BUY-side observation Q, then discuss a separate SELL quote example to explain execution geometry. Order type, session restrictions, actual protection, exits and portfolio limits remain to be specified before either side becomes a complete strategy.
2. Freeze the instrument, settings and comparison convention
Use fictional EURUSD Bid OHLC on M5. Bands use 20 close prices, an SMA middle and 2 population standard deviations, with chart shift 0. Stochastic uses 14 / 3 / 3: lookback, slowing and signal length, with Low/High prices and an SMA signal. Read completed buffers at shift=1 after a new bar is observed; chart shift and buffer index are different inputs.
The width range 8...30 pips, middle-line slope limit 2 pips over 3 bars, initial K ceiling 20 and return window 2 bars are declared research choices. They are not demonstrated optima. Use contiguous data and full mathematical values for decisions. If required history is missing, end the episode and wait for sufficient contiguous history plus a fresh outside event; do not bridge a gap with an invented candle.
| Component | Reference | Decision role |
|---|---|---|
| Price and clock | EURUSD · Bid · M5 · Close | One completed-bar calendar |
| Bands | 20 · 2 · SMA · population variance | Prior context and frozen edge |
| Stochastic | 14 / 3 / 3 · Low/High · SMA | Fresh K/D event |
| Episode | P+1...P+2 · Z=L_ref−(U_ref−L_ref)/2 | First return consumes the episode |
3. Calculate the bands and a measurable pre-event context
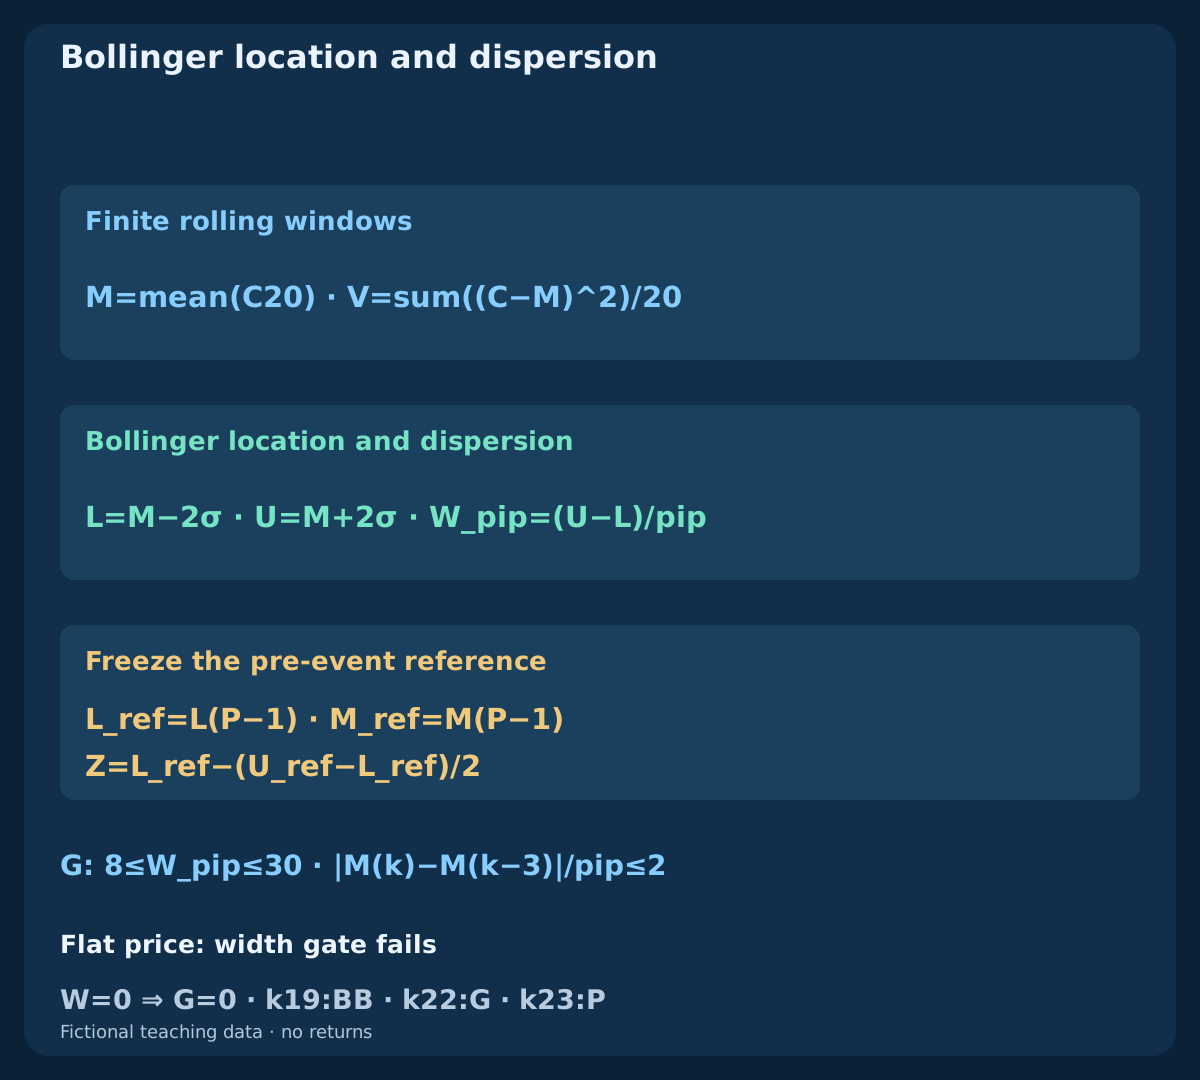
At k>=19, calculate M(k)=mean(C[k-19...k]) and population variance V(k)=sum((C-M(k))^2)/20. Then sigma=sqrt(V), L=M-2*sigma and U=M+2*sigma. Width is W_pip=(U-L)/pip. Population dispersion uses the stated denominator; replacing it with a sample estimate changes the boundaries. Two standard deviations do not imply a guaranteed percentage of future prices inside the bands.
Define G(k)=[8<=W_pip(k)<=30] AND [abs(M(k)-M(k-3))/pip<=2], first available at k22. This selects a declared width and a relatively flat middle line; it does not prove a range will persist. Evaluate G on the bar before the outside event. Its reference is frozen for that episode rather than silently switching to later, wider bands when price moves against the idea.
4. Specify the Stochastic calculation instead of assuming it
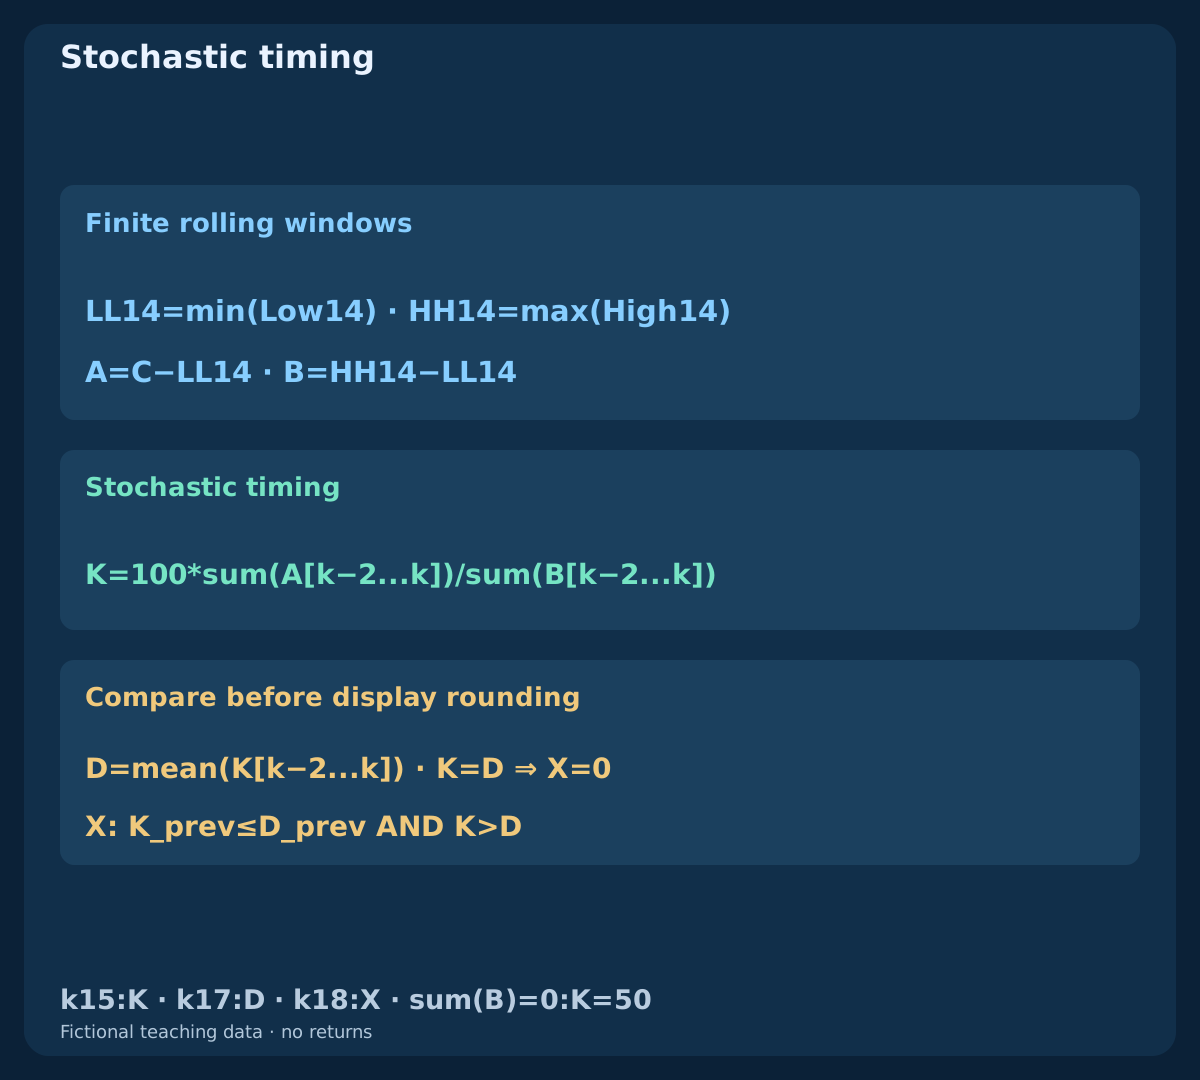
For each complete high–low window define LL14(k)=min(Low[k-13...k]) and HH14(k)=max(High[k-13...k]). Let A(k)=C(k)-LL14(k) and B(k)=HH14(k)-LL14(k). The slowed main line is K(k)=100*sum(A[k-2...k])/sum(B[k-2...k]), and the signal is D(k)=mean(K[k-2...k]). This ratio of sums differs from averaging three raw percentage values when their denominators differ.
The first K appears at k15, D at k17 and a fresh comparison at k18. If the slowing denominator is zero, our finite example assigns K=50; D then follows its stated mean. This convention is explicit, not a claim about every platform implementation. K and D are compared as exact ratios in the calculation file, before decimal display rounding, so an equality plateau cannot create a spurious cross.
5. Record one fresh outside close and freeze its edge
A candidate outside event at P needs C(P-1)>=L(P-1) AND C(P)<L(P-1). Require the previous G to pass and K(P)<=20. Freeze L_ref=L(P-1), M_ref=M(P-1), U_ref=U(P-1) and the depth boundary Z=L_ref-(U_ref-L_ref)/2. Reject an initial close at or below Z. The first fully assessable candidate is k23.
The frozen edge asks whether price actually returns above the earlier reference. It is different from asking whether a later close lies above its own newly calculated lower band. Z is a cancellation boundary for this observation, not a broker stop or a loss cap. A low K at P identifies the selected location; it neither predicts an immediate bounce nor requires the oscillator to restart its calculation. A fresh outside close rejected at the start also keeps the previous lower edge as a price lock. A later completed close above it only permits a future independent outside event.
6. Let the first frozen-edge return consume the episode
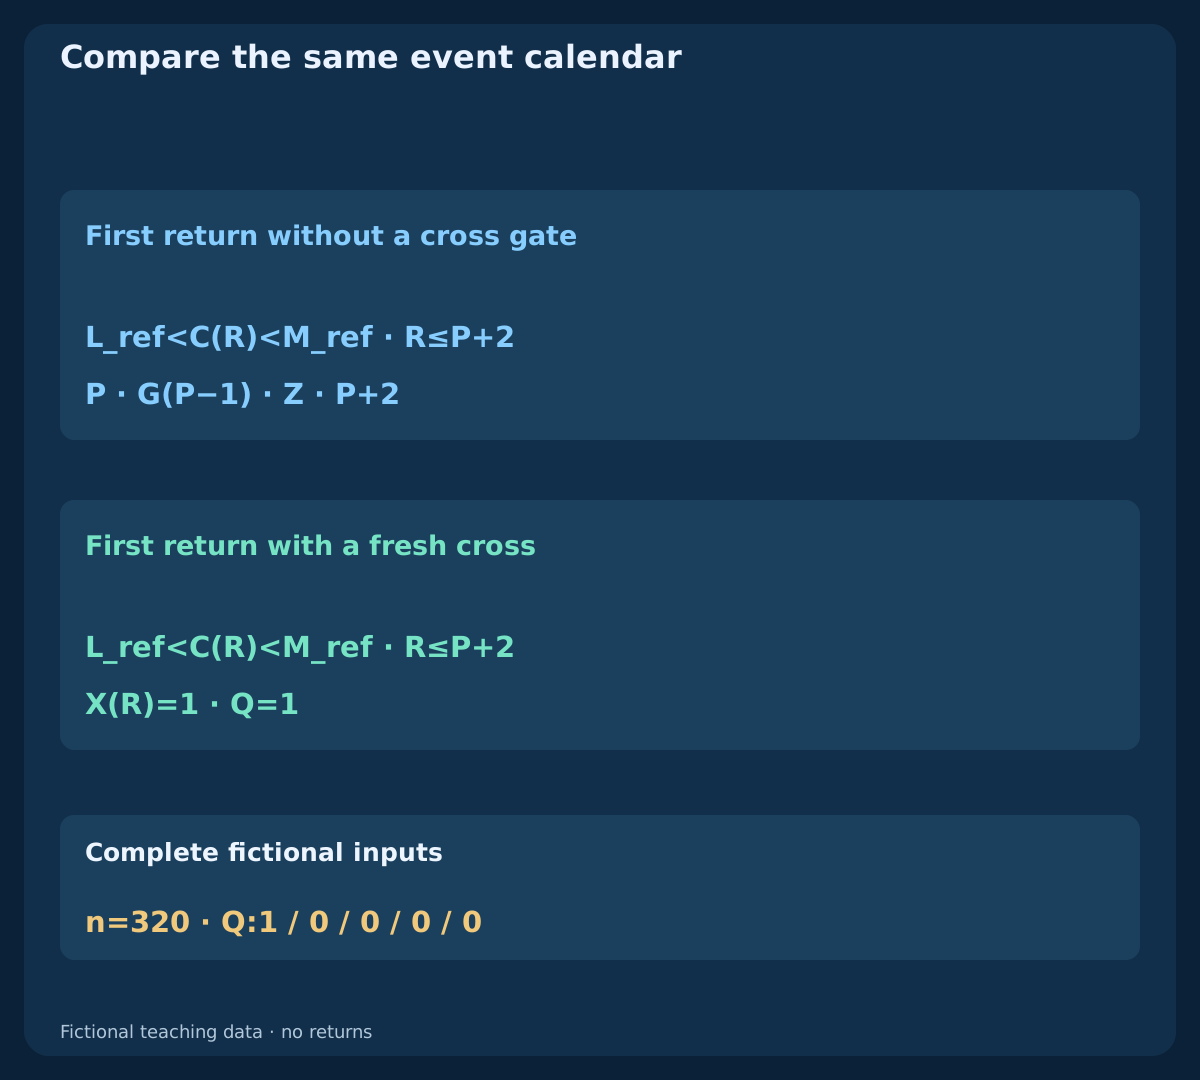
Only P+1 and P+2 can supply the first close strictly above L_ref. On every later completed bar, first cancel if C<=Z, then expire if k>P+2, then inspect the first return. Its close must satisfy L_ref<C(R)<M_ref and carry X(R)=[K(R-1)<=D(R-1) AND K(R)>D(R)]. Only then record Q=1. Equality at the lower edge is not a return; equality at the middle is too far under this model.
A first return without X, or already at the middle, ends the episode as a rejection. Do not wait for another cross and reuse that return. Additional outside closes cannot replace P or extend the deadline. After cancellation or expiry while still below the frozen edge, keep the episode locked until a completed close recovers that edge; this only permits a future independent outside event and never revives the closed episode. There is no same-bar rearming.
7. Rebuild the five independent fictional histories
The download contains 5 histories of 64 bars, 320 rows in total. Four share 44 initial closes constructed from a fixed ten-value cycle; their later paths are named timely / early_return / moving_only / breakout. The fifth has constant OHLC prices. Every close, high, low, mean, variance, band, Stochastic input and event flag is included, with no measured trade returns.
Rows use scheduled M5 completion times in UTC, starting at 04:20 UTC. The shared outside event is P=k44 / 08:00 UTC; its reference bar completes at 07:55 UTC. Recalculate from the beginning of each history. Displayed bands are rounded only for reading; decisions use the underlying calculation, with exact-ratio K/D comparisons. These artificial paths test definitions and ordering, not the frequency or profitability of real opportunities.
8. Read the timely first return and its fresh cross
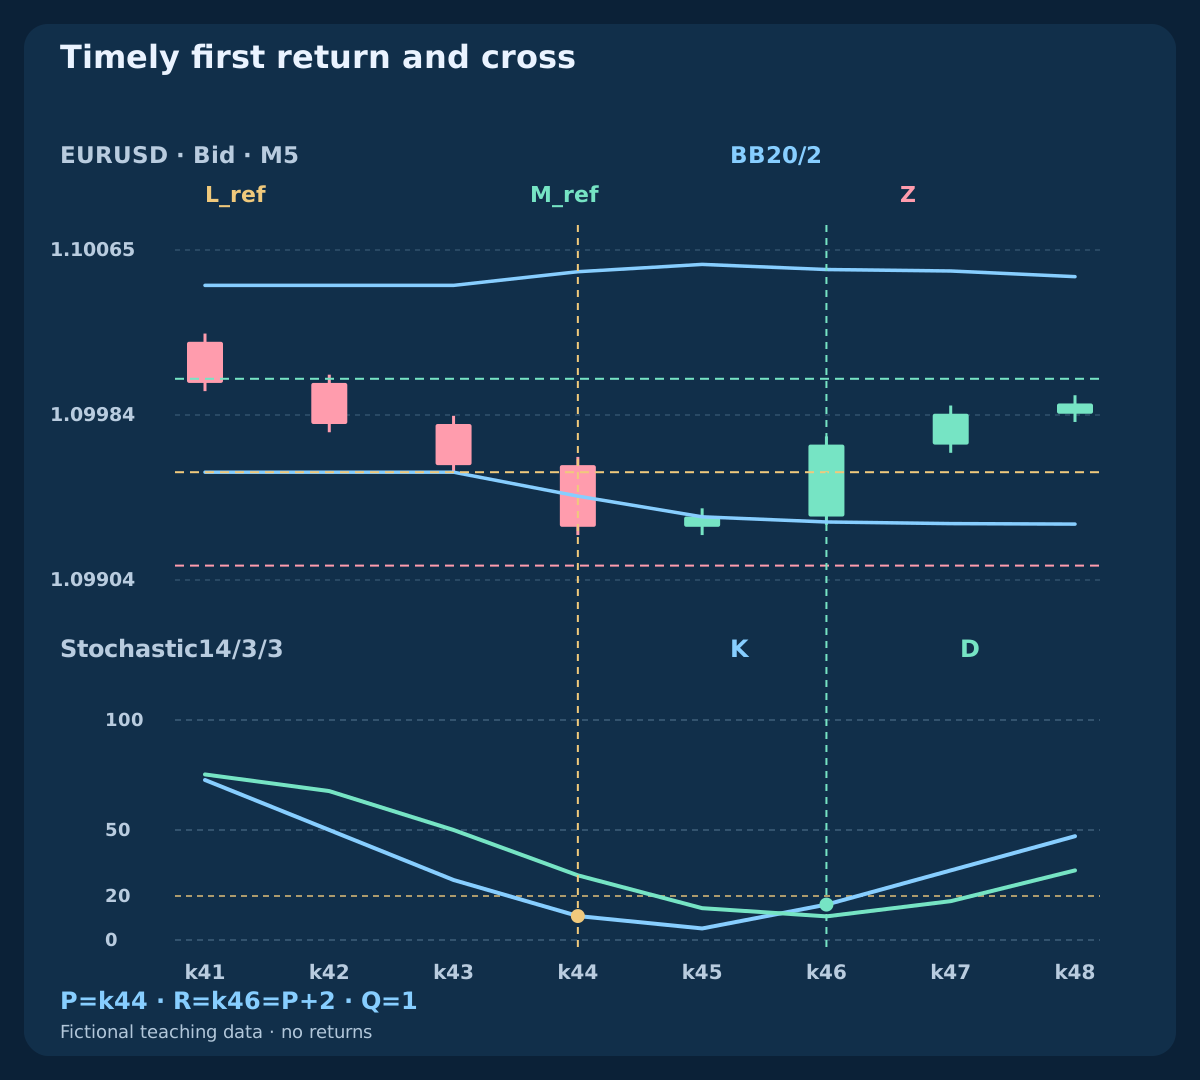
Before the shared P, width is about 9.0863 pips, with L_ref=1.09956569, M_ref=1.10002000 and Z=1.09911137 when displayed. At P, close is 1.09930 and K=10.8844, so the declared start conditions pass. The next close 1.09935 remains below the frozen edge even though it is above its own moving lower band. The episode waits.
At k46 / 08:10 UTC, close reaches 1.09970, between the frozen lower edge and middle. K is 16.1017, D is 10.7443, and the previous K did not exceed D. The fresh cross occurs on the first frozen-edge return at P+2, so Q=1. K is still below the familiar lower zone level; this model requires the defined cross, not a separate zone exit.
| Branch / bar | Close Bid | L(k) | L_ref | K | D | X | Q | Status |
|---|---|---|---|---|---|---|---|---|
| timely · k44 | 1.09930 | 1.09944920 | 1.09956569 | 10.8844 | 29.3857 | 0 | 0 | Freeze the pre-event reference |
| timely · k46 | 1.09970 | 1.09932360 | 1.09956569 | 16.1017 | 10.7443 | 1 | 1 | Timely first return and cross |
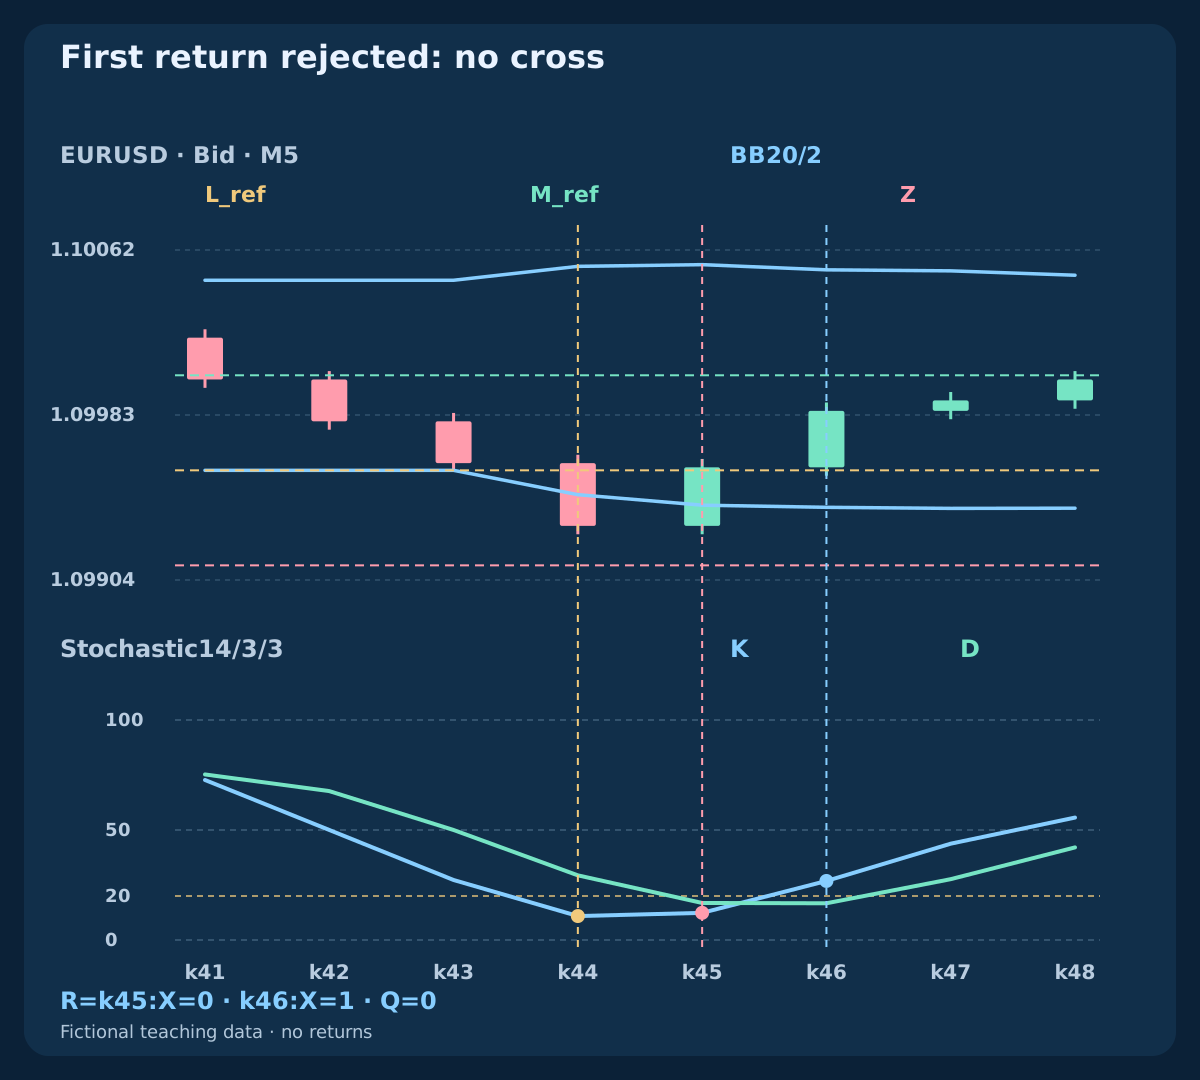
| early_return · k45 | 1.09958 | 1.09939904 | 1.09956569 | 12.3457 | 16.8343 | 0 | 0 | First return rejected: no cross |
| early_return · k46 | 1.09985 | 1.09938886 | — | 26.8362 | 16.6887 | 1 | 0 | Cross without an active episode |
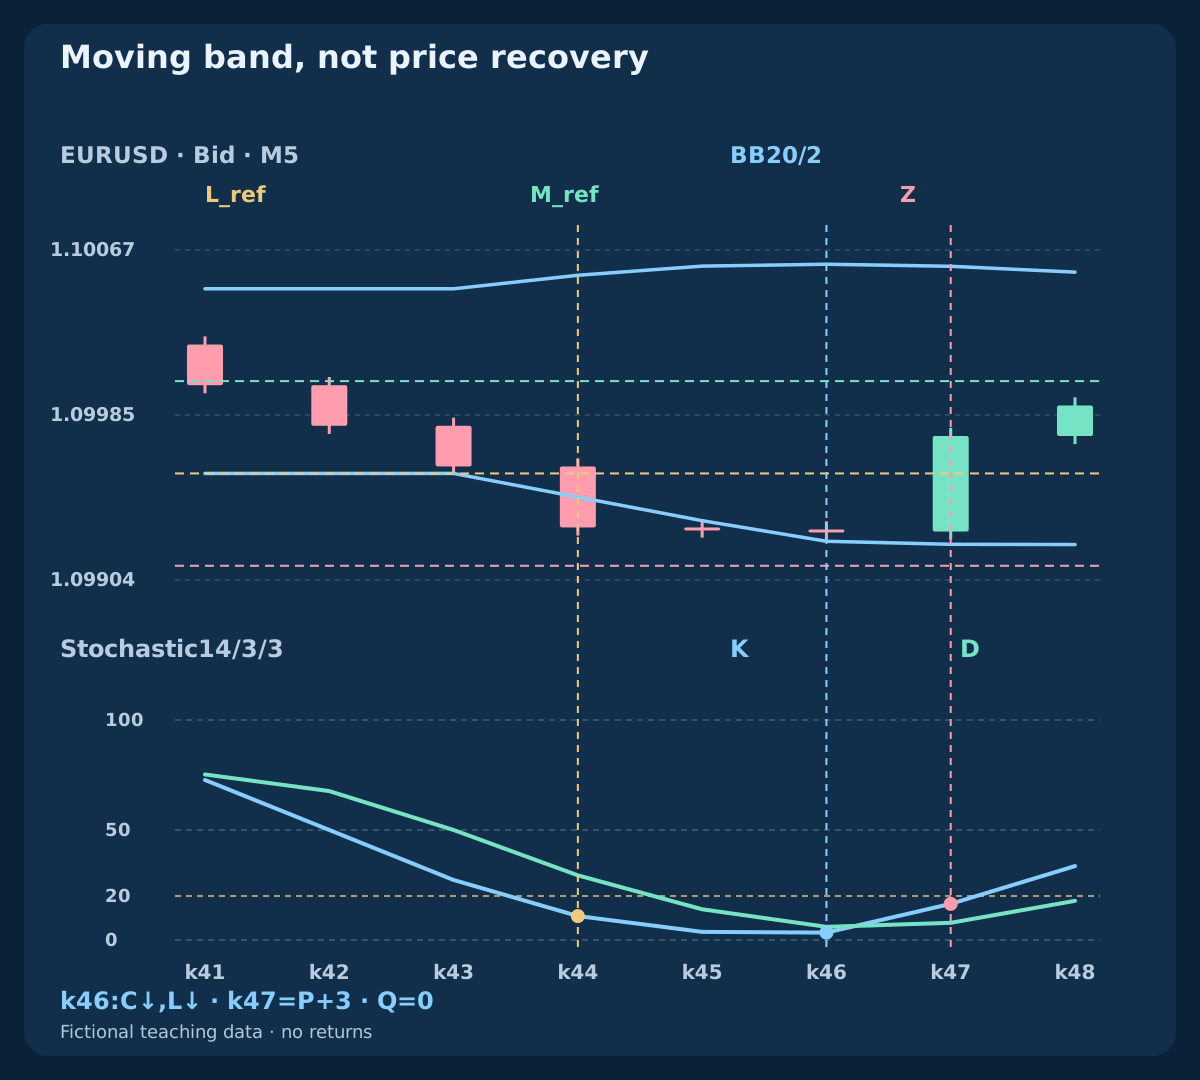
| moving_only · k46 | 1.09928 | 1.09923191 | 1.09956569 | 3.3613 | 5.9793 | 0 | 0 | Moving band, not price recovery |
| moving_only · k47 | 1.09975 | 1.09921704 | 1.09956569 | 16.4345 | 7.8294 | 1 | 0 | Expired before the late return |
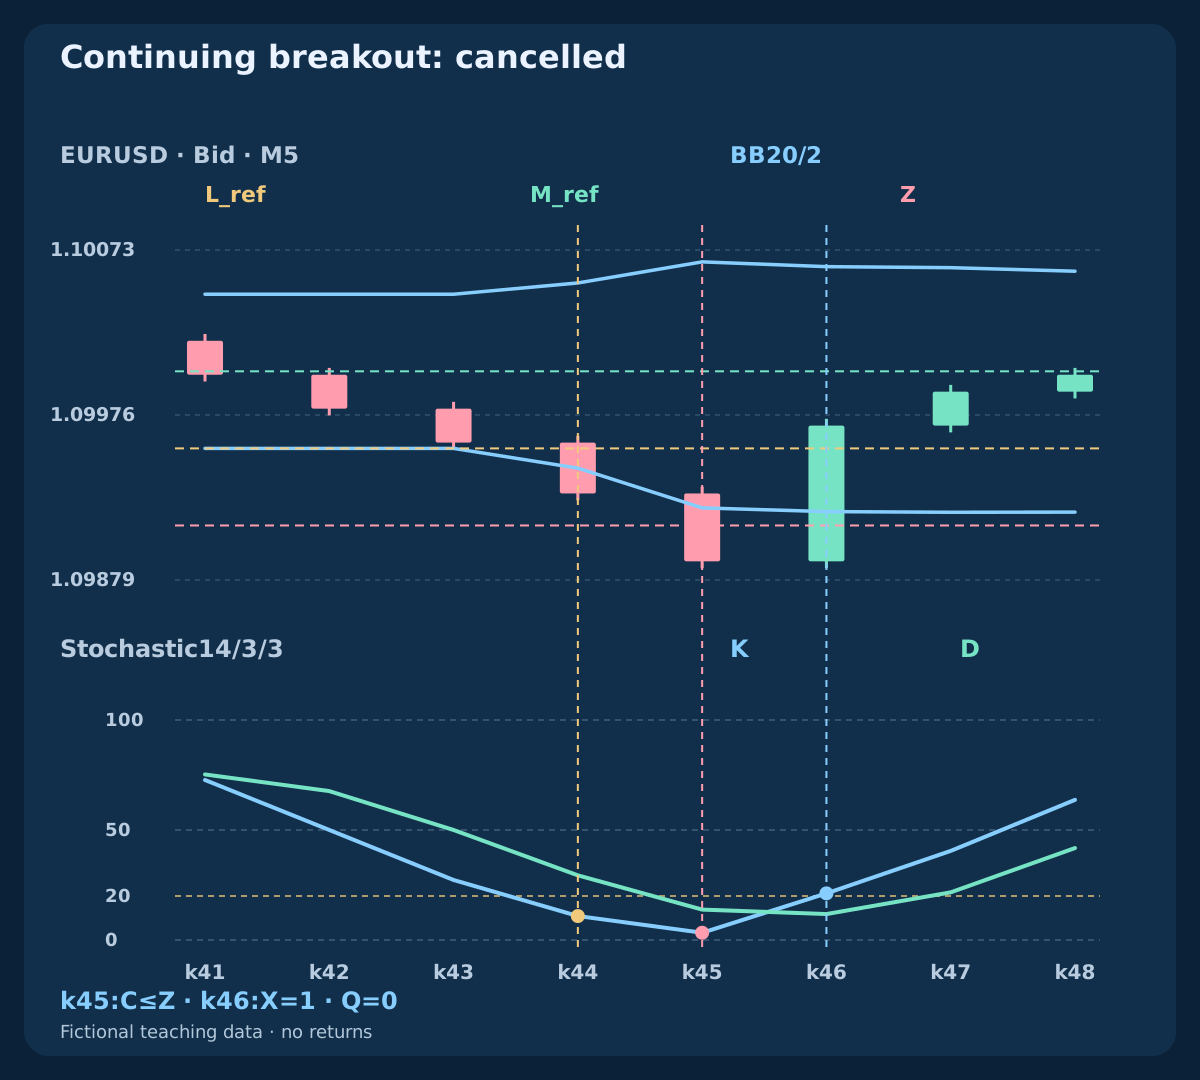
| breakout · k45 | 1.09890 | 1.09921502 | 1.09956569 | 3.2967 | 13.8179 | 0 | 0 | Continuing breakout: cancelled |
| breakout · k46 | 1.09970 | 1.09919313 | — | 21.1982 | 11.7931 | 1 | 0 | Lock released for future events only |
| flat · k46 | 1.10000 | 1.10000000 | — | 50.0000 | 50.0000 | 0 | 0 | Flat price: width gate fails |
9. Reject an early price return that lacks a fresh cross
In early_return, the first close above the frozen edge arrives at k45 with price 1.09958. K is 12.3457 and D 16.8343, so no upward K/D cross exists. That first return consumes the episode as a rejection, with Q=0. The remaining observation window is not a licence to wait for a more attractive confirmation.
At k46, K rises to 26.8362 above D 16.6887, producing a fresh X. There is no active P, so Q=0 again. Reusing the earlier return would change the model to delayed confirmation. Such a variant needs its own deadline, invalidation and execution rules, and a comparison that accounts for the later price rather than assigning it the earlier one.
10. Identify re-entry caused by a moving band
In moving_only, price declines from 1.09929 at k45 to 1.09928 at k46. The current lower band has fallen beneath the latter close, so a dynamic-band return is visible. Price nevertheless remains below L_ref=1.09956569. Under the frozen question, no return has occurred. The falling band changes relative location without demonstrating upward price recovery.
At k47 / 08:15 UTC, close finally reaches 1.09975 and Stochastic crosses upward. That bar is P+3; expiry is checked first and Q=0. Neither the earlier moving-band appearance nor the later cross extends the two-bar window. A dynamic-band hypothesis can be researched separately, but its events must not be mixed with frozen-edge results.
11. Cancel the continuing breakout before a later rebound
In breakout, the next close is 1.09890 at k45, below Z. Cancel before considering any return. At k46, price recovers to 1.09970 and a fresh cross appears, but Q=0. The recovered edge releases the lock for a future independent candidate; it does not restore P. The cancellation boundary is still not an executed stop, and no trade outcome is supplied.
The flat history supplies a different limit: after the lookbacks are available, the bands have zero width, K uses the declared flat convention and G fails. Real sideways markets are less tidy, while a trend can keep closing along or beyond a band. A previous quiet context cannot guarantee reversion. Keep depth cancellations, first-return rejections and expired episodes as separate categories in subsequent evaluation.
12. Keep the observation clock separate from an order deadline
The reference bar opening at 07:50 UTC completes at 07:55 UTC; the P bar then completes at 08:00 UTC. The last possible first return closes at 08:10 UTC, while 08:15 UTC is already too late. Final values become observable only with subsequent data arrival. A historical bar boundary does not prove that a quote, request or fill existed at that instant.
Convert broker time using the actual date-specific offset and retain the conversion. A complete strategy must separately limit quote age, request delay, acceptable entry distance and retries. Moving the model to M1 changes the input paths and the elapsed window; the same period numbers do not preserve its events. Compare any faster version as a separately frozen experiment with realistic costs and chronological price data.
| Stage UTC | Available information | Still undecided |
|---|---|---|
| P−1 · 07:55 | Prior bands and G | Outside close P |
| P · 08:00 | Outside close and K(P) | First return and executable quotes |
| P+2 · 08:10 | Last eligible first return | Actual request and fill |
| P+3 · 08:15 | Expired if no earlier return | No revival of the old episode |
13. Compare independent SELL quotes with fixed Ask-side exits
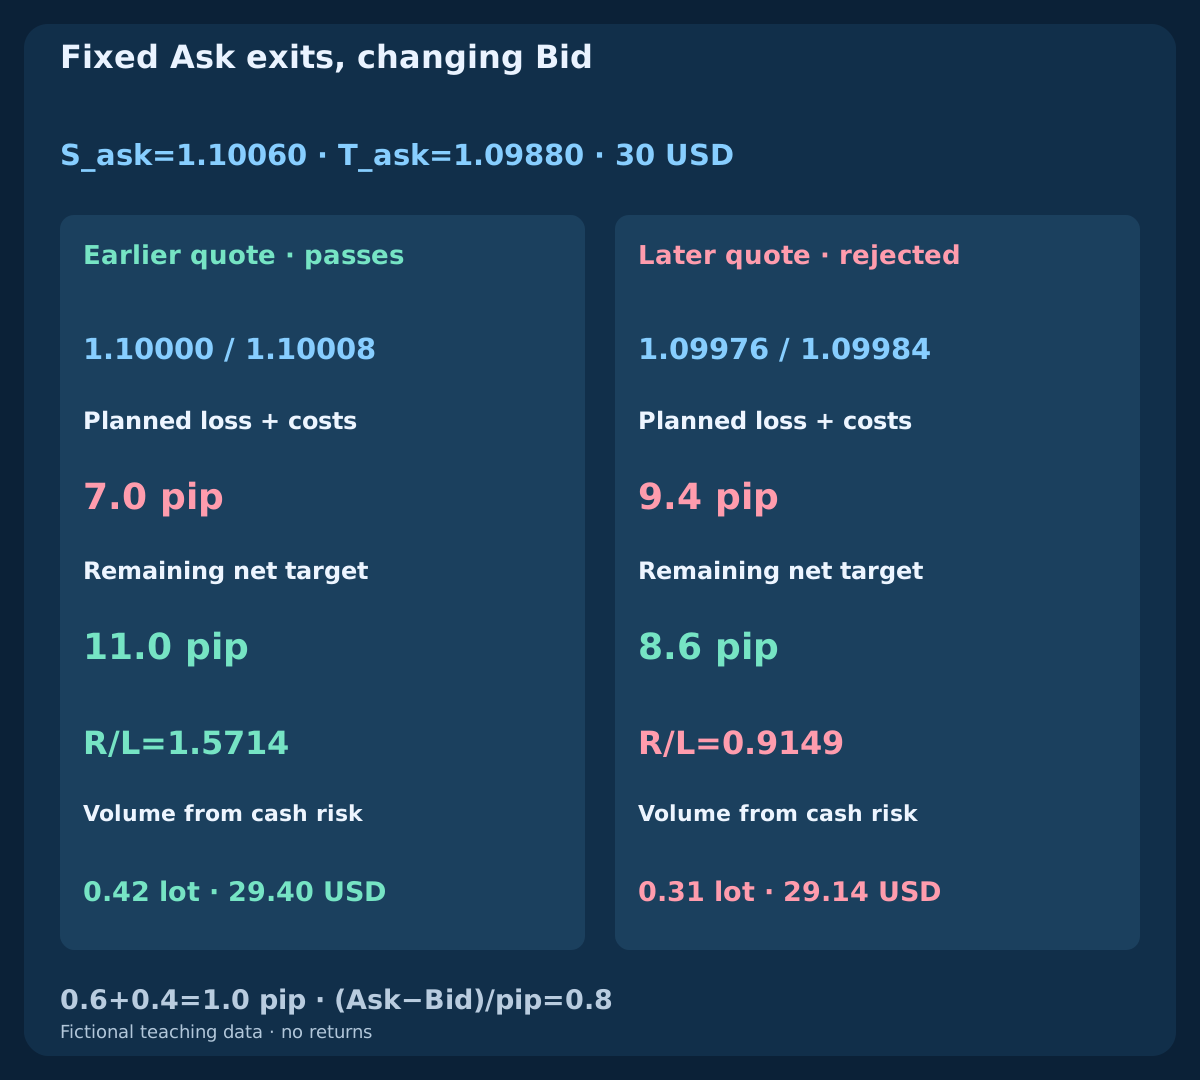
This separate price example uses SELL entry at Bid, with Ask-side stop 1.10060 and target 1.09880. Earlier Bid/Ask is 1.10000 / 1.10008; later it is 1.09976 / 1.09984. Each spread is 0.8 pip. Round-trip commission 0.6 pip plus total adverse-execution reserve 0.4 pip adds 1.0 pip. Earlier planned loss is 7.0 pips, net target 11.0 pips and ratio 1.5714; later these become 9.4 pips, 8.6 pips and 0.9149.
With the declared comparison threshold net reward / planned loss >=1.30, earlier passes and later fails. For equity 12000 USD, budget 0.25%=30 USD, pip value 10 USD per standard lot and step 0.01, round down to 0.42 lots / 29.40 USD earlier. Later comparison-only sizing is 0.31 lots / 29.14 USD; it cannot repair the failed ratio. These alternative quotes are independent of the histories and are not orders or fills. Explaining SELL prices does not define a mirrored SELL signal model.
| Quote | Bid / Ask | Stop (pip) | Loss + costs | Net target | Ratio | Lots | Risk USD |
|---|---|---|---|---|---|---|---|
| Earlier quote · passes | 1.10000 / 1.10008 | 6.0 | 7.0 | 11.0 | 1.5714 | 0.42 | 29.40 |
| Later quote · rejected | 1.09976 / 1.09984 | 8.4 | 9.4 | 8.6 | 0.9149 | 0.31 | 29.14 |
14. Count quote-side costs once and retain execution uncertainty
SELL loss distance before fees and reserve is (S_ask-Bid)/pip and target room is (Bid-T_ask)/pip. The executable-side spread effect is already included; do not add it again. For BUY the equivalent distances are (Ask-S_bid)/pip and (T_bid-Ask)/pip. A Bid-only candle cannot establish the complete Ask path needed to check a short-side stop or target.
The example assumes EURUSD pip 0.0001, point and tick 0.00001, contract 100000 EUR and a USD account. Verify actual symbol properties, account-currency conversion, minimum volume, margin and stop constraints. Planned risk is not a loss cap: gaps, slippage, rejected protection and unknown requests can change it. After a timeout, reconcile actual orders and fills before retrying; keep those events in the record.
15. Compare the extra cross on the same first-return calendar
Use valid first frozen-edge returns without the X requirement as an observation baseline, then compare with Q. Both versions retain the same P origins, context, depth boundary, deadline and first-return price limit. Keep rejected and expired episodes, not just qualified examples. Once complete trading rules exist, apply identical quote selection, protection, exits, volume and cost policies to both versions.
Reserve untouched later data and record all tried periods, width limits, slope limits, zones and deadlines. Examine net expectancy, drawdown, turnover, uncertainty and cost sensitivity; fewer signals or a selected higher win rate is not sufficient. Tick chronology matters when exits can compete inside one candle. The synthetic file verifies mechanics only. It cannot establish whether the additional cross removes more losing opportunities than winning ones.
16. Review the model before writing a complete strategy
A reproducible record identifies symbol, quote side, timeframe, price input, band mean and variance denominator, Stochastic slowing and signal method, zero cases, precision, completed-buffer reads and data gaps. It fixes the prior-bar reference, first return, equality rules, event priority, lock release and independent order clock. Another reader should reproduce the same observations without selecting the favourable chart after the outcome.
This is the second guide in the scalping-combination group. The EMA–RSI guide studies a different momentum-reset sequence; the next guide examines EMA with MACD, including their information overlap. Complete strategies follow the guide foundation. Existing band-reversion and M1 price-action pages remain separate hypotheses; the related cost and testing guides help turn an observation into a research specification.
Frequently asked questions
Does a close inside the current band equal a frozen-edge return?
No. In moving_only, price falls while the lower band falls farther. The close is above its current band but below the earlier frozen edge. The model keeps those observations separate and does not assign Q to the moving-band appearance.
Must Stochastic rise above 20 on the return bar?
Not under this declared rule. K at P must be at or below 20, but the first return needs a fresh K/D cross. In timely, K is still 16.1017 when that cross qualifies. A zone-exit requirement would be another candidate.
Can a later cross validate an earlier price return?
The first return without the required cross is rejected and closes the episode. A later cross has no active P. Waiting after that return changes the model and requires its own explicit timing and execution comparison.
Is the first return exactly at P+2 allowed?
Yes, if cancellation checks pass, price is strictly between the frozen lower edge and middle, and the fresh cross occurs on that bar. At P+3, expiry takes priority even when price and the oscillator recover together.
Do Bollinger Bands and Stochastic provide independent confirmation?
Both use overlapping prices, so different formulas do not create independent evidence. The assigned roles clarify location and timing. Their combined usefulness must be measured with complete rules and costs on suitable market data.
Does Q or the SELL quote example define a complete strategy?
No. Q is a BUY-side observation. The independent SELL example explains quote geometry, not a SELL signal. Order, protection, exit, session, cost and portfolio rules still need a complete specification and testing.
Sources and research notes
MetaQuotes documents iBands and iStochastic and publishes the ratio-of-sums Stochastic reference. John Bollinger explains the limits of band touches, trend walks and statistical interpretations. The population dispersion, zero-denominator convention, exact K/D comparisons, synthetic paths and episode rules here are explicitly declared teaching choices; live-terminal parity and optimal settings are not established. OrderSend documents executable quote sides. Both downloads expose our example calculations.
- MQL4 Reference: iBands
- MQL4 Reference: iStochastic
- MetaQuotes: Stochastic Oscillator reference
- John Bollinger: Bollinger Band Rules
- MQL4 Reference: OrderSend
Educational content. All histories and quote examples are fictional. Forex trading involves risk. Band location, oscillator agreement, planned stops and cost reserves cannot guarantee profitable execution or cap actual losses.